Key Insights
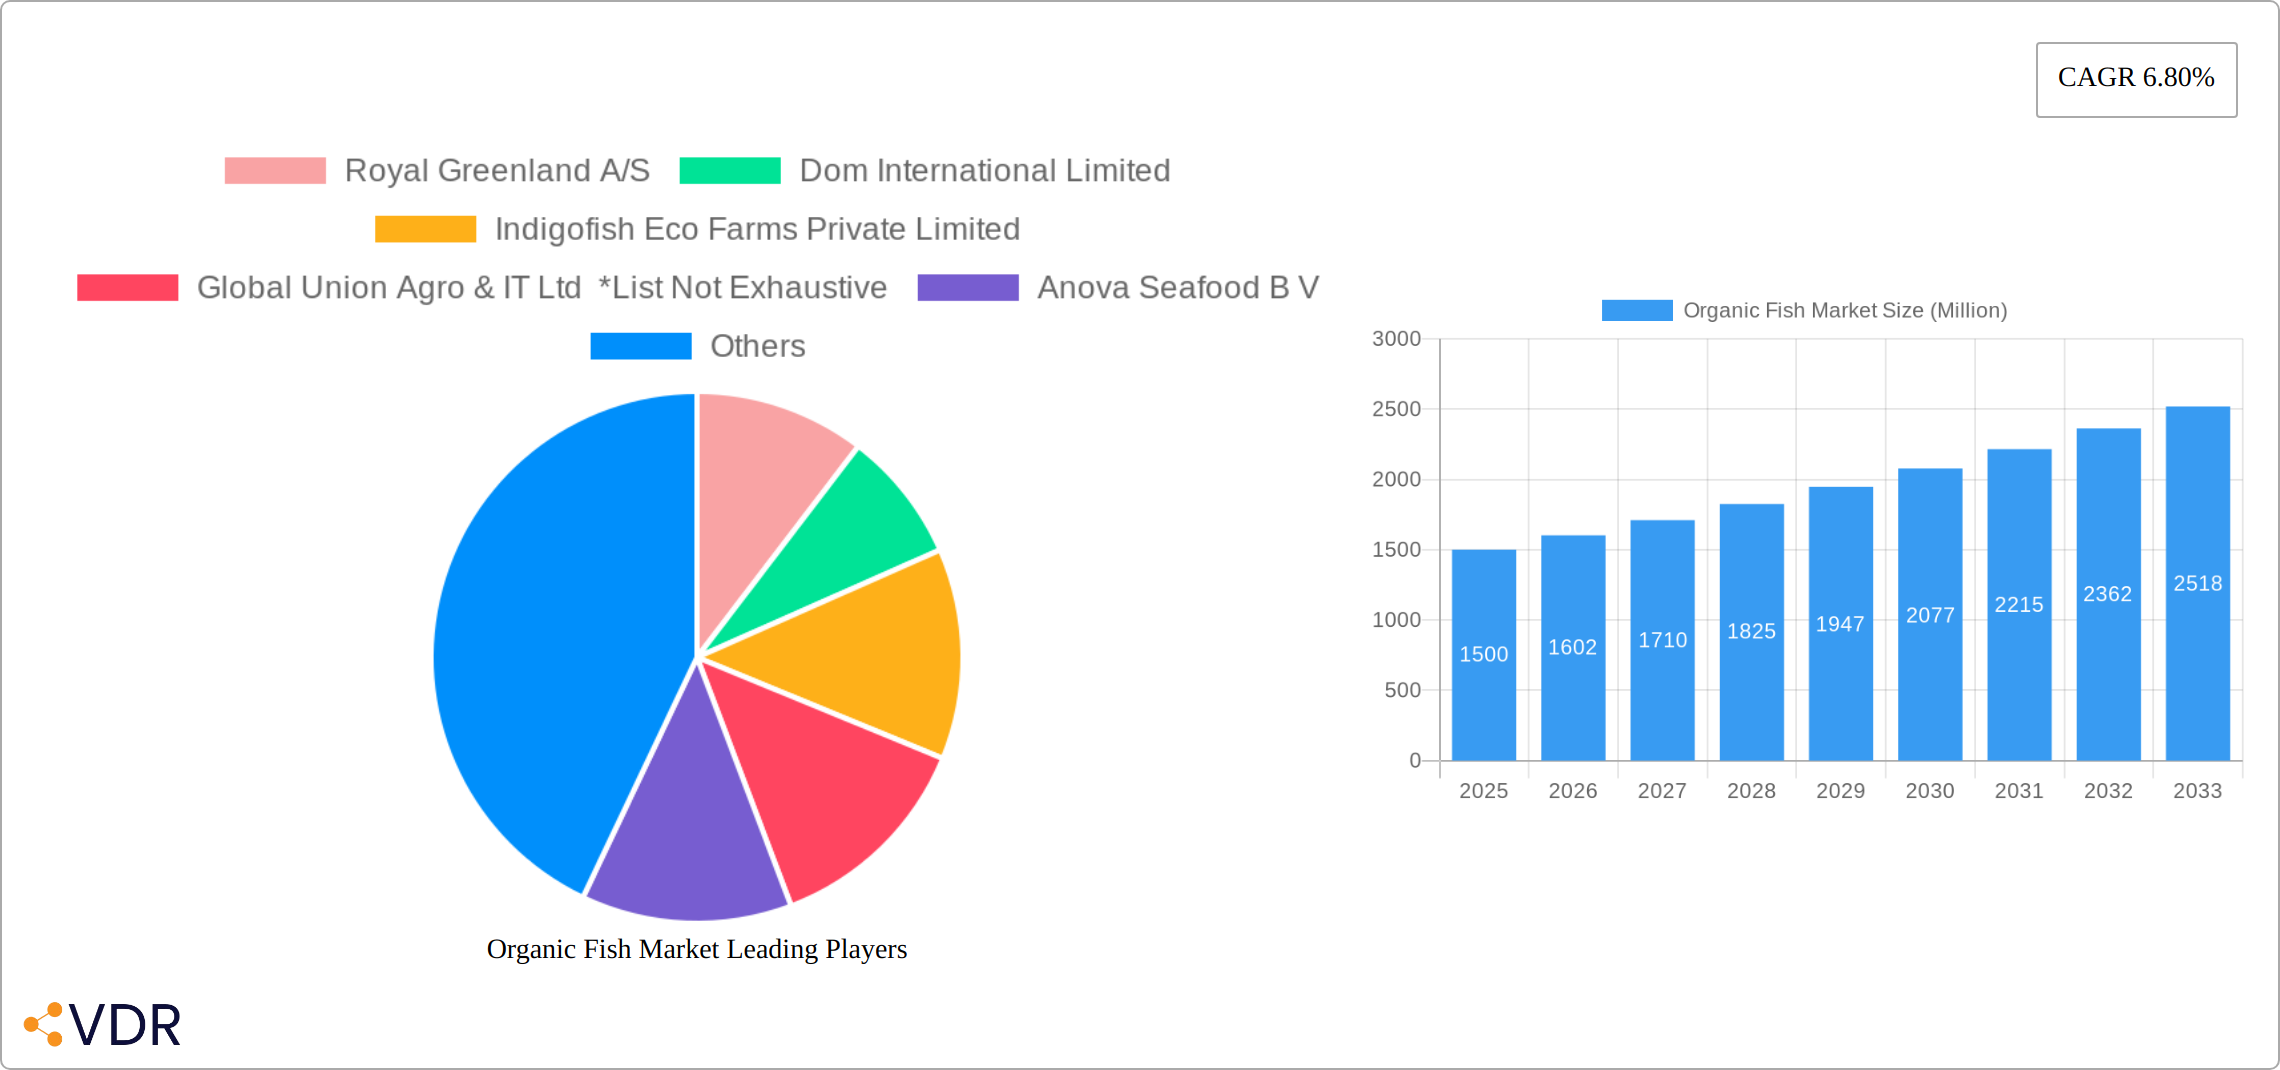
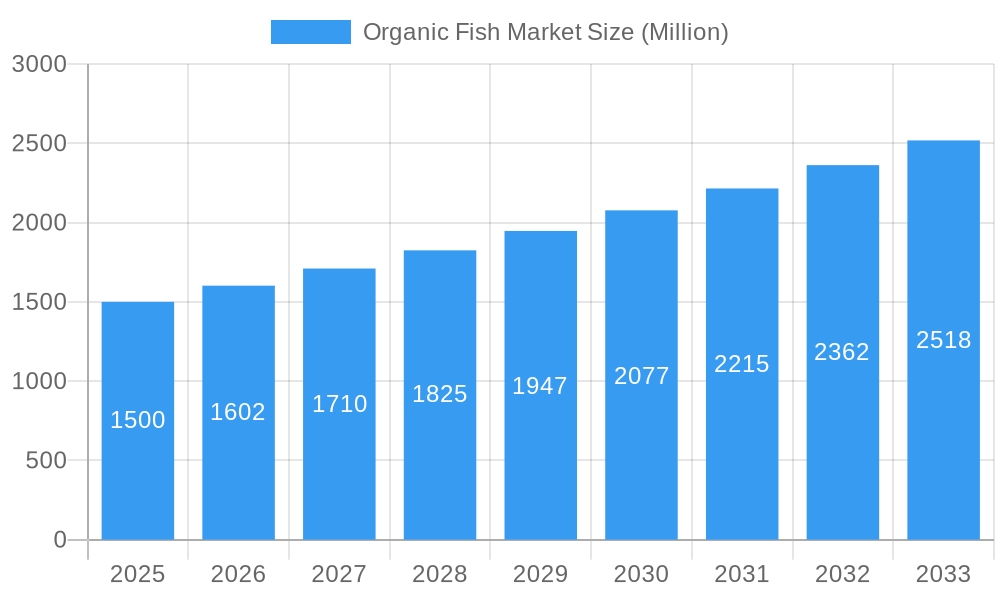
The global organic fish market, valued at approximately 3.02 billion in 2025, is projected to experience robust growth with a Compound Annual Growth Rate (CAGR) of 6% from 2025 to 2033. This expansion is driven by escalating consumer demand for healthy, sustainably sourced seafood and growing awareness of organic aquaculture's environmental and health benefits. Rising disposable incomes and concerns over foodborne illnesses from conventional fish further bolster consumer preference for organic alternatives. While the fresh/chilled segment currently leads, the frozen/canned segment is anticipated to grow significantly due to its extended shelf life and convenience. The off-trade channel (retail) holds a larger market share than the on-trade (food services), though both are expected to expand. Salmon and tuna are dominant species, with "other types" offering future growth potential as consumers explore diverse organic fish. Geographically, North America and Europe lead, but the Asia-Pacific region presents substantial untapped potential. Challenges include the higher cost of organic fish and the need for advanced sustainable aquaculture practices to meet demand.
Organic Fish Market Market Size (In Billion)
Market segmentation highlights key opportunities. Major players like Mowi ASA and Royal Greenland A/S leverage established networks and brand recognition. Emerging specialized farms cater to niche markets, with success dependent on marketing superior quality and sustainability. Future trends include innovation in aquaculture techniques, enhanced traceability systems, a broader product range, and supportive regulatory frameworks for sustainable aquaculture.
Organic Fish Market Company Market Share
Organic Fish Market: A Comprehensive Market Report (2019-2033)
This comprehensive report provides an in-depth analysis of the global organic fish market, encompassing historical data (2019-2024), the base year (2025), and a detailed forecast spanning 2025-2033. The report meticulously examines market dynamics, growth trends, regional dominance, product landscapes, key players, and emerging opportunities within the parent market of seafood and the child market of organic food products. The study helps stakeholders gain a competitive edge by understanding the current market scenario and predicting future trajectories. Market values are presented in million units.
Organic Fish Market Dynamics & Structure
This section analyzes the competitive landscape of the organic fish market, exploring factors influencing its growth and evolution. We delve into market concentration, technological innovations, regulatory frameworks, the presence of substitute products, end-user demographics, and mergers and acquisitions (M&A) activity. The analysis includes both quantitative data (market share, M&A deal volumes – estimated at xx million deals in 2024) and qualitative assessments of innovation barriers and other challenges.
- Market Concentration: The market exhibits a moderately concentrated structure, with a few major players holding significant shares (estimated at 40% combined market share for the top 5 players in 2024).
- Technological Innovation: Advancements in aquaculture technology and sustainable farming practices are key drivers, alongside innovations in packaging and processing. Barriers to innovation include high capital investment requirements and regulatory complexities.
- Regulatory Framework: Stringent regulations regarding organic certification and food safety standards significantly influence market dynamics. Compliance costs impact smaller players disproportionately.
- Competitive Substitutes: Conventional farmed fish and plant-based protein alternatives present competitive pressures.
- End-User Demographics: Growing health consciousness among consumers, especially in developed countries, is a significant driver, with increasing demand for sustainably sourced, high-quality protein.
- M&A Trends: The organic fish sector has witnessed a moderate level of M&A activity in recent years, primarily focused on consolidation and expansion into new markets.
Organic Fish Market Growth Trends & Insights
This section provides a detailed analysis of the organic fish market's size evolution, adoption rates, technological disruptions, and shifting consumer behavior. Utilizing various analytical tools and methodologies, we project robust market expansion and growth during the forecast period. The report explores market size evolution from xx million in 2019 to an estimated xx million in 2024, projecting a CAGR of xx% from 2025 to 2033. Market penetration is increasing steadily, driven by heightened consumer awareness and demand for healthier, sustainable food choices.
Dominant Regions, Countries, or Segments in Organic Fish Market
This section identifies the leading regions, countries, and market segments (Form, Distribution Channel, and Type) driving the expansion of the organic fish market. We analyze the factors contributing to their dominance, including market share, growth potential, economic policies, infrastructure development, and evolving consumer preferences. While North America and Europe currently hold the largest market share, the Asia-Pacific region exhibits substantial growth potential fueled by rising disposable incomes and increasing health consciousness.
- Form: Fresh/chilled organic fish remains the dominant segment, favored for its superior taste and perceived freshness. However, the frozen/canned segment is experiencing robust growth, driven by its extended shelf life, convenience, and reduced food waste. This trend is particularly evident in regions with less developed cold chain infrastructure.
- Distribution Channel: The off-trade segment (retail), encompassing supermarkets, specialty stores, and online retailers, currently dominates the market. This is largely attributed to increased consumer accessibility and the growing popularity of online grocery shopping. The on-trade (food service) segment is also experiencing growth, albeit at a more moderate pace, as restaurants and caterers increasingly incorporate organic fish into their menus to cater to health-conscious consumers.
- Type: Salmon continues to be the leading organic fish type due to high consumer demand, established farming practices, and readily available supply. However, tuna and other species, such as trout and cod, represent significant niche markets with considerable growth potential, particularly as consumers explore a wider variety of sustainable seafood options.
- Key Drivers: The market's expansion is fueled by several key factors: escalating consumer demand for healthy and sustainable protein sources; increasing health awareness and a preference for natural, minimally processed foods; supportive government policies promoting sustainable aquaculture practices, particularly in regions like Norway and Scotland; and advancements in logistics and cold chain infrastructure which enhance the availability and quality of organic fish products.
Organic Fish Market Product Landscape
The organic fish market offers a range of products, including fresh and frozen fillets, canned products, and value-added processed items. Innovation focuses on enhancing product quality, extending shelf life, and improving sustainability. Key technological advancements include improved aquaculture techniques and sustainable packaging solutions. Unique selling propositions often center around traceability, sustainable farming practices, and high-quality standards.
Key Drivers, Barriers & Challenges in Organic Fish Market
Key Drivers: The organic fish market is propelled by the growing global health awareness driving demand for healthy and sustainable protein sources. Increasing disposable incomes in developing economies are expanding the consumer base, while supportive government regulations and policies focused on sustainable aquaculture practices further stimulate market growth. The rising popularity of sustainable and ethical sourcing also plays a significant role.
Key Barriers & Challenges: The high production costs associated with organic aquaculture practices can impact affordability and limit market accessibility, particularly in price-sensitive regions. Limited availability in certain regions due to logistical constraints and fluctuating supply can also hinder market penetration. Furthermore, potential supply chain disruptions stemming from climate change and other unforeseen events present a significant challenge. Stringent certification processes and regulatory hurdles can also increase production costs and complexity. The competitive pressure from conventionally farmed fish and the emergence of plant-based protein alternatives pose a considerable threat, with an estimated xx million in lost revenue in 2024 attributed to these pressures.
Emerging Opportunities in Organic Fish Market
Significant opportunities exist in expanding into untapped markets, especially in developing economies with a burgeoning middle class and a growing preference for healthy food options. Innovations in processing and packaging technologies are crucial for enhancing product value, extending shelf life, and broadening market reach. Developing novel product formats, such as ready-to-eat meals and convenient snack options, can attract a wider range of consumers and drive further growth. Furthermore, focusing on sustainable and transparent supply chains can build consumer trust and enhance brand loyalty.
Growth Accelerators in the Organic Fish Market Industry
Technological advancements in aquaculture, such as recirculating aquaculture systems (RAS) and automated feeding systems, are playing a pivotal role in boosting productivity and efficiency. Strategic collaborations between producers, distributors, and retailers are essential for optimizing supply chain efficiency and ensuring wider market access. Expansion into new markets and product diversification, coupled with effective marketing and branding strategies, remain key strategies for achieving sustained and profitable growth.
Key Players Shaping the Organic Fish Market Market
- Royal Greenland A/S
- Dom International Limited
- Indigofish Eco Farms Private Limited
- Global Union Agro & IT Ltd
- Anova Seafood B V
- Coombe Farm Organic
- Artisanfish LLC
- Glenarm Organic Salmon Ltd
- Mowi ASA
- The Irish Organic Salmon Co
Notable Milestones in Organic Fish Market Sector
- February 2022: MOWI expanded its product range by launching new organic Scottish salmon on Ocado, featuring two new organic salmon products certified by the Soil Association. This demonstrates the growing consumer demand for certified organic products and the expansion of retail channels for organic seafood.
- January 2022: Organic Sea Harvest introduced a plastic-free, compostable packaging solution for its organic salmon, highlighting the industry's increasing commitment to sustainability and eco-friendly practices. This initiative is likely to attract environmentally conscious consumers and further enhance the brand's reputation.
In-Depth Organic Fish Market Market Outlook
The organic fish market is poised for substantial growth, driven by increasing consumer demand for healthy and sustainable food options. Strategic investments in sustainable aquaculture practices, technological advancements, and effective marketing campaigns will be crucial for realizing the market's full potential. Expanding into new markets and developing innovative products will further fuel market expansion. The forecast period holds significant opportunities for growth and innovation in the organic fish sector.
Organic Fish Market Segmentation
-
1. Type
- 1.1. Salmon
- 1.2. Tuna
- 1.3. Other Types
-
2. Form
- 2.1. Fresh/Chilled
- 2.2. Frozen/Canned
- 2.3. Processed
-
3. Distribution Channel
- 3.1. On-Trade
-
3.2. Off-Trade
- 3.2.1. Convenience/Grocery Stores
- 3.2.2. Online Retail Stores
Organic Fish Market Segmentation By Geography
-
1. North America
- 1.1. United States
- 1.2. Canada
- 1.3. Mexico
- 1.4. Rest of North America
-
2. Europe
- 2.1. Spain
- 2.2. United Kingdom
- 2.3. Germany
- 2.4. France
- 2.5. Italy
- 2.6. Russia
- 2.7. Rest of Europe
-
3. Asia Pacific
- 3.1. China
- 3.2. Japan
- 3.3. India
- 3.4. Australia
- 3.5. Rest of Asia Pacific
-
4. South America
- 4.1. Brazil
- 4.2. Argentina
- 4.3. Rest of South America
-
5. Middle East and Africa
- 5.1. South Africa
- 5.2. Saudi Arabia
- 5.3. Rest of Middle East and Africa
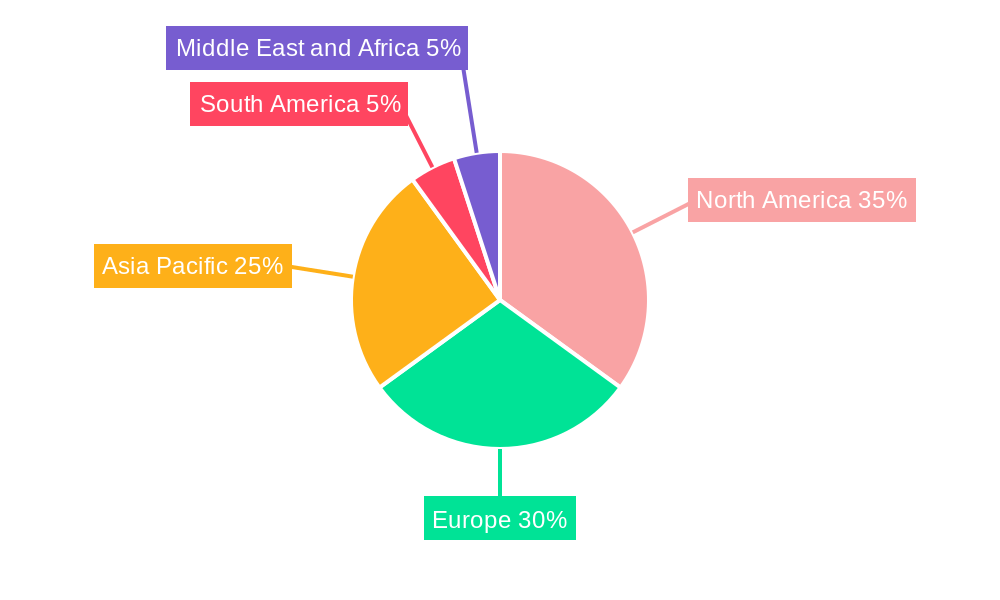
Organic Fish Market Regional Market Share
Geographic Coverage of Organic Fish Market
Organic Fish Market REPORT HIGHLIGHTS
| Aspects | Details |
|---|---|
| Study Period | 2020-2034 |
| Base Year | 2025 |
| Estimated Year | 2026 |
| Forecast Period | 2026-2034 |
| Historical Period | 2020-2025 |
| Growth Rate | CAGR of 6% from 2020-2034 |
| Segmentation |
|
Table of Contents
- 1. Introduction
- 1.1. Research Scope
- 1.2. Market Segmentation
- 1.3. Research Methodology
- 1.4. Definitions and Assumptions
- 2. Executive Summary
- 2.1. Introduction
- 3. Market Dynamics
- 3.1. Introduction
- 3.2. Market Drivers
- 3.2.1. Increasing Demand for Processed Food Products; Technological Advancements Supporting Market Growth
- 3.3. Market Restrains
- 3.3.1. Increasing Cost of Production Due to Rise in Energy and Labor Cost
- 3.4. Market Trends
- 3.4.1. Rising Health Awareness Promoting Demand
- 4. Market Factor Analysis
- 4.1. Porters Five Forces
- 4.2. Supply/Value Chain
- 4.3. PESTEL analysis
- 4.4. Market Entropy
- 4.5. Patent/Trademark Analysis
- 5. Global Organic Fish Market Analysis, Insights and Forecast, 2020-2032
- 5.1. Market Analysis, Insights and Forecast - by Type
- 5.1.1. Salmon
- 5.1.2. Tuna
- 5.1.3. Other Types
- 5.2. Market Analysis, Insights and Forecast - by Form
- 5.2.1. Fresh/Chilled
- 5.2.2. Frozen/Canned
- 5.2.3. Processed
- 5.3. Market Analysis, Insights and Forecast - by Distribution Channel
- 5.3.1. On-Trade
- 5.3.2. Off-Trade
- 5.3.2.1. Convenience/Grocery Stores
- 5.3.2.2. Online Retail Stores
- 5.4. Market Analysis, Insights and Forecast - by Region
- 5.4.1. North America
- 5.4.2. Europe
- 5.4.3. Asia Pacific
- 5.4.4. South America
- 5.4.5. Middle East and Africa
- 5.1. Market Analysis, Insights and Forecast - by Type
- 6. North America Organic Fish Market Analysis, Insights and Forecast, 2020-2032
- 6.1. Market Analysis, Insights and Forecast - by Type
- 6.1.1. Salmon
- 6.1.2. Tuna
- 6.1.3. Other Types
- 6.2. Market Analysis, Insights and Forecast - by Form
- 6.2.1. Fresh/Chilled
- 6.2.2. Frozen/Canned
- 6.2.3. Processed
- 6.3. Market Analysis, Insights and Forecast - by Distribution Channel
- 6.3.1. On-Trade
- 6.3.2. Off-Trade
- 6.3.2.1. Convenience/Grocery Stores
- 6.3.2.2. Online Retail Stores
- 6.1. Market Analysis, Insights and Forecast - by Type
- 7. Europe Organic Fish Market Analysis, Insights and Forecast, 2020-2032
- 7.1. Market Analysis, Insights and Forecast - by Type
- 7.1.1. Salmon
- 7.1.2. Tuna
- 7.1.3. Other Types
- 7.2. Market Analysis, Insights and Forecast - by Form
- 7.2.1. Fresh/Chilled
- 7.2.2. Frozen/Canned
- 7.2.3. Processed
- 7.3. Market Analysis, Insights and Forecast - by Distribution Channel
- 7.3.1. On-Trade
- 7.3.2. Off-Trade
- 7.3.2.1. Convenience/Grocery Stores
- 7.3.2.2. Online Retail Stores
- 7.1. Market Analysis, Insights and Forecast - by Type
- 8. Asia Pacific Organic Fish Market Analysis, Insights and Forecast, 2020-2032
- 8.1. Market Analysis, Insights and Forecast - by Type
- 8.1.1. Salmon
- 8.1.2. Tuna
- 8.1.3. Other Types
- 8.2. Market Analysis, Insights and Forecast - by Form
- 8.2.1. Fresh/Chilled
- 8.2.2. Frozen/Canned
- 8.2.3. Processed
- 8.3. Market Analysis, Insights and Forecast - by Distribution Channel
- 8.3.1. On-Trade
- 8.3.2. Off-Trade
- 8.3.2.1. Convenience/Grocery Stores
- 8.3.2.2. Online Retail Stores
- 8.1. Market Analysis, Insights and Forecast - by Type
- 9. South America Organic Fish Market Analysis, Insights and Forecast, 2020-2032
- 9.1. Market Analysis, Insights and Forecast - by Type
- 9.1.1. Salmon
- 9.1.2. Tuna
- 9.1.3. Other Types
- 9.2. Market Analysis, Insights and Forecast - by Form
- 9.2.1. Fresh/Chilled
- 9.2.2. Frozen/Canned
- 9.2.3. Processed
- 9.3. Market Analysis, Insights and Forecast - by Distribution Channel
- 9.3.1. On-Trade
- 9.3.2. Off-Trade
- 9.3.2.1. Convenience/Grocery Stores
- 9.3.2.2. Online Retail Stores
- 9.1. Market Analysis, Insights and Forecast - by Type
- 10. Middle East and Africa Organic Fish Market Analysis, Insights and Forecast, 2020-2032
- 10.1. Market Analysis, Insights and Forecast - by Type
- 10.1.1. Salmon
- 10.1.2. Tuna
- 10.1.3. Other Types
- 10.2. Market Analysis, Insights and Forecast - by Form
- 10.2.1. Fresh/Chilled
- 10.2.2. Frozen/Canned
- 10.2.3. Processed
- 10.3. Market Analysis, Insights and Forecast - by Distribution Channel
- 10.3.1. On-Trade
- 10.3.2. Off-Trade
- 10.3.2.1. Convenience/Grocery Stores
- 10.3.2.2. Online Retail Stores
- 10.1. Market Analysis, Insights and Forecast - by Type
- 11. Competitive Analysis
- 11.1. Global Market Share Analysis 2025
- 11.2. Company Profiles
- 11.2.1 Royal Greenland A/S
- 11.2.1.1. Overview
- 11.2.1.2. Products
- 11.2.1.3. SWOT Analysis
- 11.2.1.4. Recent Developments
- 11.2.1.5. Financials (Based on Availability)
- 11.2.2 Dom International Limited
- 11.2.2.1. Overview
- 11.2.2.2. Products
- 11.2.2.3. SWOT Analysis
- 11.2.2.4. Recent Developments
- 11.2.2.5. Financials (Based on Availability)
- 11.2.3 Indigofish Eco Farms Private Limited
- 11.2.3.1. Overview
- 11.2.3.2. Products
- 11.2.3.3. SWOT Analysis
- 11.2.3.4. Recent Developments
- 11.2.3.5. Financials (Based on Availability)
- 11.2.4 Global Union Agro & IT Ltd *List Not Exhaustive
- 11.2.4.1. Overview
- 11.2.4.2. Products
- 11.2.4.3. SWOT Analysis
- 11.2.4.4. Recent Developments
- 11.2.4.5. Financials (Based on Availability)
- 11.2.5 Anova Seafood B V
- 11.2.5.1. Overview
- 11.2.5.2. Products
- 11.2.5.3. SWOT Analysis
- 11.2.5.4. Recent Developments
- 11.2.5.5. Financials (Based on Availability)
- 11.2.6 Coombe Farm Organic
- 11.2.6.1. Overview
- 11.2.6.2. Products
- 11.2.6.3. SWOT Analysis
- 11.2.6.4. Recent Developments
- 11.2.6.5. Financials (Based on Availability)
- 11.2.7 Artisanfish LLC
- 11.2.7.1. Overview
- 11.2.7.2. Products
- 11.2.7.3. SWOT Analysis
- 11.2.7.4. Recent Developments
- 11.2.7.5. Financials (Based on Availability)
- 11.2.8 Glenarm Organic Salmon Ltd
- 11.2.8.1. Overview
- 11.2.8.2. Products
- 11.2.8.3. SWOT Analysis
- 11.2.8.4. Recent Developments
- 11.2.8.5. Financials (Based on Availability)
- 11.2.9 Mowi ASA
- 11.2.9.1. Overview
- 11.2.9.2. Products
- 11.2.9.3. SWOT Analysis
- 11.2.9.4. Recent Developments
- 11.2.9.5. Financials (Based on Availability)
- 11.2.10 The Irish Organic Salmon Co
- 11.2.10.1. Overview
- 11.2.10.2. Products
- 11.2.10.3. SWOT Analysis
- 11.2.10.4. Recent Developments
- 11.2.10.5. Financials (Based on Availability)
- 11.2.1 Royal Greenland A/S
List of Figures
- Figure 1: Global Organic Fish Market Revenue Breakdown (billion, %) by Region 2025 & 2033
- Figure 2: Global Organic Fish Market Volume Breakdown (k Tons, %) by Region 2025 & 2033
- Figure 3: North America Organic Fish Market Revenue (billion), by Type 2025 & 2033
- Figure 4: North America Organic Fish Market Volume (k Tons), by Type 2025 & 2033
- Figure 5: North America Organic Fish Market Revenue Share (%), by Type 2025 & 2033
- Figure 6: North America Organic Fish Market Volume Share (%), by Type 2025 & 2033
- Figure 7: North America Organic Fish Market Revenue (billion), by Form 2025 & 2033
- Figure 8: North America Organic Fish Market Volume (k Tons), by Form 2025 & 2033
- Figure 9: North America Organic Fish Market Revenue Share (%), by Form 2025 & 2033
- Figure 10: North America Organic Fish Market Volume Share (%), by Form 2025 & 2033
- Figure 11: North America Organic Fish Market Revenue (billion), by Distribution Channel 2025 & 2033
- Figure 12: North America Organic Fish Market Volume (k Tons), by Distribution Channel 2025 & 2033
- Figure 13: North America Organic Fish Market Revenue Share (%), by Distribution Channel 2025 & 2033
- Figure 14: North America Organic Fish Market Volume Share (%), by Distribution Channel 2025 & 2033
- Figure 15: North America Organic Fish Market Revenue (billion), by Country 2025 & 2033
- Figure 16: North America Organic Fish Market Volume (k Tons), by Country 2025 & 2033
- Figure 17: North America Organic Fish Market Revenue Share (%), by Country 2025 & 2033
- Figure 18: North America Organic Fish Market Volume Share (%), by Country 2025 & 2033
- Figure 19: Europe Organic Fish Market Revenue (billion), by Type 2025 & 2033
- Figure 20: Europe Organic Fish Market Volume (k Tons), by Type 2025 & 2033
- Figure 21: Europe Organic Fish Market Revenue Share (%), by Type 2025 & 2033
- Figure 22: Europe Organic Fish Market Volume Share (%), by Type 2025 & 2033
- Figure 23: Europe Organic Fish Market Revenue (billion), by Form 2025 & 2033
- Figure 24: Europe Organic Fish Market Volume (k Tons), by Form 2025 & 2033
- Figure 25: Europe Organic Fish Market Revenue Share (%), by Form 2025 & 2033
- Figure 26: Europe Organic Fish Market Volume Share (%), by Form 2025 & 2033
- Figure 27: Europe Organic Fish Market Revenue (billion), by Distribution Channel 2025 & 2033
- Figure 28: Europe Organic Fish Market Volume (k Tons), by Distribution Channel 2025 & 2033
- Figure 29: Europe Organic Fish Market Revenue Share (%), by Distribution Channel 2025 & 2033
- Figure 30: Europe Organic Fish Market Volume Share (%), by Distribution Channel 2025 & 2033
- Figure 31: Europe Organic Fish Market Revenue (billion), by Country 2025 & 2033
- Figure 32: Europe Organic Fish Market Volume (k Tons), by Country 2025 & 2033
- Figure 33: Europe Organic Fish Market Revenue Share (%), by Country 2025 & 2033
- Figure 34: Europe Organic Fish Market Volume Share (%), by Country 2025 & 2033
- Figure 35: Asia Pacific Organic Fish Market Revenue (billion), by Type 2025 & 2033
- Figure 36: Asia Pacific Organic Fish Market Volume (k Tons), by Type 2025 & 2033
- Figure 37: Asia Pacific Organic Fish Market Revenue Share (%), by Type 2025 & 2033
- Figure 38: Asia Pacific Organic Fish Market Volume Share (%), by Type 2025 & 2033
- Figure 39: Asia Pacific Organic Fish Market Revenue (billion), by Form 2025 & 2033
- Figure 40: Asia Pacific Organic Fish Market Volume (k Tons), by Form 2025 & 2033
- Figure 41: Asia Pacific Organic Fish Market Revenue Share (%), by Form 2025 & 2033
- Figure 42: Asia Pacific Organic Fish Market Volume Share (%), by Form 2025 & 2033
- Figure 43: Asia Pacific Organic Fish Market Revenue (billion), by Distribution Channel 2025 & 2033
- Figure 44: Asia Pacific Organic Fish Market Volume (k Tons), by Distribution Channel 2025 & 2033
- Figure 45: Asia Pacific Organic Fish Market Revenue Share (%), by Distribution Channel 2025 & 2033
- Figure 46: Asia Pacific Organic Fish Market Volume Share (%), by Distribution Channel 2025 & 2033
- Figure 47: Asia Pacific Organic Fish Market Revenue (billion), by Country 2025 & 2033
- Figure 48: Asia Pacific Organic Fish Market Volume (k Tons), by Country 2025 & 2033
- Figure 49: Asia Pacific Organic Fish Market Revenue Share (%), by Country 2025 & 2033
- Figure 50: Asia Pacific Organic Fish Market Volume Share (%), by Country 2025 & 2033
- Figure 51: South America Organic Fish Market Revenue (billion), by Type 2025 & 2033
- Figure 52: South America Organic Fish Market Volume (k Tons), by Type 2025 & 2033
- Figure 53: South America Organic Fish Market Revenue Share (%), by Type 2025 & 2033
- Figure 54: South America Organic Fish Market Volume Share (%), by Type 2025 & 2033
- Figure 55: South America Organic Fish Market Revenue (billion), by Form 2025 & 2033
- Figure 56: South America Organic Fish Market Volume (k Tons), by Form 2025 & 2033
- Figure 57: South America Organic Fish Market Revenue Share (%), by Form 2025 & 2033
- Figure 58: South America Organic Fish Market Volume Share (%), by Form 2025 & 2033
- Figure 59: South America Organic Fish Market Revenue (billion), by Distribution Channel 2025 & 2033
- Figure 60: South America Organic Fish Market Volume (k Tons), by Distribution Channel 2025 & 2033
- Figure 61: South America Organic Fish Market Revenue Share (%), by Distribution Channel 2025 & 2033
- Figure 62: South America Organic Fish Market Volume Share (%), by Distribution Channel 2025 & 2033
- Figure 63: South America Organic Fish Market Revenue (billion), by Country 2025 & 2033
- Figure 64: South America Organic Fish Market Volume (k Tons), by Country 2025 & 2033
- Figure 65: South America Organic Fish Market Revenue Share (%), by Country 2025 & 2033
- Figure 66: South America Organic Fish Market Volume Share (%), by Country 2025 & 2033
- Figure 67: Middle East and Africa Organic Fish Market Revenue (billion), by Type 2025 & 2033
- Figure 68: Middle East and Africa Organic Fish Market Volume (k Tons), by Type 2025 & 2033
- Figure 69: Middle East and Africa Organic Fish Market Revenue Share (%), by Type 2025 & 2033
- Figure 70: Middle East and Africa Organic Fish Market Volume Share (%), by Type 2025 & 2033
- Figure 71: Middle East and Africa Organic Fish Market Revenue (billion), by Form 2025 & 2033
- Figure 72: Middle East and Africa Organic Fish Market Volume (k Tons), by Form 2025 & 2033
- Figure 73: Middle East and Africa Organic Fish Market Revenue Share (%), by Form 2025 & 2033
- Figure 74: Middle East and Africa Organic Fish Market Volume Share (%), by Form 2025 & 2033
- Figure 75: Middle East and Africa Organic Fish Market Revenue (billion), by Distribution Channel 2025 & 2033
- Figure 76: Middle East and Africa Organic Fish Market Volume (k Tons), by Distribution Channel 2025 & 2033
- Figure 77: Middle East and Africa Organic Fish Market Revenue Share (%), by Distribution Channel 2025 & 2033
- Figure 78: Middle East and Africa Organic Fish Market Volume Share (%), by Distribution Channel 2025 & 2033
- Figure 79: Middle East and Africa Organic Fish Market Revenue (billion), by Country 2025 & 2033
- Figure 80: Middle East and Africa Organic Fish Market Volume (k Tons), by Country 2025 & 2033
- Figure 81: Middle East and Africa Organic Fish Market Revenue Share (%), by Country 2025 & 2033
- Figure 82: Middle East and Africa Organic Fish Market Volume Share (%), by Country 2025 & 2033
List of Tables
- Table 1: Global Organic Fish Market Revenue billion Forecast, by Type 2020 & 2033
- Table 2: Global Organic Fish Market Volume k Tons Forecast, by Type 2020 & 2033
- Table 3: Global Organic Fish Market Revenue billion Forecast, by Form 2020 & 2033
- Table 4: Global Organic Fish Market Volume k Tons Forecast, by Form 2020 & 2033
- Table 5: Global Organic Fish Market Revenue billion Forecast, by Distribution Channel 2020 & 2033
- Table 6: Global Organic Fish Market Volume k Tons Forecast, by Distribution Channel 2020 & 2033
- Table 7: Global Organic Fish Market Revenue billion Forecast, by Region 2020 & 2033
- Table 8: Global Organic Fish Market Volume k Tons Forecast, by Region 2020 & 2033
- Table 9: Global Organic Fish Market Revenue billion Forecast, by Type 2020 & 2033
- Table 10: Global Organic Fish Market Volume k Tons Forecast, by Type 2020 & 2033
- Table 11: Global Organic Fish Market Revenue billion Forecast, by Form 2020 & 2033
- Table 12: Global Organic Fish Market Volume k Tons Forecast, by Form 2020 & 2033
- Table 13: Global Organic Fish Market Revenue billion Forecast, by Distribution Channel 2020 & 2033
- Table 14: Global Organic Fish Market Volume k Tons Forecast, by Distribution Channel 2020 & 2033
- Table 15: Global Organic Fish Market Revenue billion Forecast, by Country 2020 & 2033
- Table 16: Global Organic Fish Market Volume k Tons Forecast, by Country 2020 & 2033
- Table 17: United States Organic Fish Market Revenue (billion) Forecast, by Application 2020 & 2033
- Table 18: United States Organic Fish Market Volume (k Tons) Forecast, by Application 2020 & 2033
- Table 19: Canada Organic Fish Market Revenue (billion) Forecast, by Application 2020 & 2033
- Table 20: Canada Organic Fish Market Volume (k Tons) Forecast, by Application 2020 & 2033
- Table 21: Mexico Organic Fish Market Revenue (billion) Forecast, by Application 2020 & 2033
- Table 22: Mexico Organic Fish Market Volume (k Tons) Forecast, by Application 2020 & 2033
- Table 23: Rest of North America Organic Fish Market Revenue (billion) Forecast, by Application 2020 & 2033
- Table 24: Rest of North America Organic Fish Market Volume (k Tons) Forecast, by Application 2020 & 2033
- Table 25: Global Organic Fish Market Revenue billion Forecast, by Type 2020 & 2033
- Table 26: Global Organic Fish Market Volume k Tons Forecast, by Type 2020 & 2033
- Table 27: Global Organic Fish Market Revenue billion Forecast, by Form 2020 & 2033
- Table 28: Global Organic Fish Market Volume k Tons Forecast, by Form 2020 & 2033
- Table 29: Global Organic Fish Market Revenue billion Forecast, by Distribution Channel 2020 & 2033
- Table 30: Global Organic Fish Market Volume k Tons Forecast, by Distribution Channel 2020 & 2033
- Table 31: Global Organic Fish Market Revenue billion Forecast, by Country 2020 & 2033
- Table 32: Global Organic Fish Market Volume k Tons Forecast, by Country 2020 & 2033
- Table 33: Spain Organic Fish Market Revenue (billion) Forecast, by Application 2020 & 2033
- Table 34: Spain Organic Fish Market Volume (k Tons) Forecast, by Application 2020 & 2033
- Table 35: United Kingdom Organic Fish Market Revenue (billion) Forecast, by Application 2020 & 2033
- Table 36: United Kingdom Organic Fish Market Volume (k Tons) Forecast, by Application 2020 & 2033
- Table 37: Germany Organic Fish Market Revenue (billion) Forecast, by Application 2020 & 2033
- Table 38: Germany Organic Fish Market Volume (k Tons) Forecast, by Application 2020 & 2033
- Table 39: France Organic Fish Market Revenue (billion) Forecast, by Application 2020 & 2033
- Table 40: France Organic Fish Market Volume (k Tons) Forecast, by Application 2020 & 2033
- Table 41: Italy Organic Fish Market Revenue (billion) Forecast, by Application 2020 & 2033
- Table 42: Italy Organic Fish Market Volume (k Tons) Forecast, by Application 2020 & 2033
- Table 43: Russia Organic Fish Market Revenue (billion) Forecast, by Application 2020 & 2033
- Table 44: Russia Organic Fish Market Volume (k Tons) Forecast, by Application 2020 & 2033
- Table 45: Rest of Europe Organic Fish Market Revenue (billion) Forecast, by Application 2020 & 2033
- Table 46: Rest of Europe Organic Fish Market Volume (k Tons) Forecast, by Application 2020 & 2033
- Table 47: Global Organic Fish Market Revenue billion Forecast, by Type 2020 & 2033
- Table 48: Global Organic Fish Market Volume k Tons Forecast, by Type 2020 & 2033
- Table 49: Global Organic Fish Market Revenue billion Forecast, by Form 2020 & 2033
- Table 50: Global Organic Fish Market Volume k Tons Forecast, by Form 2020 & 2033
- Table 51: Global Organic Fish Market Revenue billion Forecast, by Distribution Channel 2020 & 2033
- Table 52: Global Organic Fish Market Volume k Tons Forecast, by Distribution Channel 2020 & 2033
- Table 53: Global Organic Fish Market Revenue billion Forecast, by Country 2020 & 2033
- Table 54: Global Organic Fish Market Volume k Tons Forecast, by Country 2020 & 2033
- Table 55: China Organic Fish Market Revenue (billion) Forecast, by Application 2020 & 2033
- Table 56: China Organic Fish Market Volume (k Tons) Forecast, by Application 2020 & 2033
- Table 57: Japan Organic Fish Market Revenue (billion) Forecast, by Application 2020 & 2033
- Table 58: Japan Organic Fish Market Volume (k Tons) Forecast, by Application 2020 & 2033
- Table 59: India Organic Fish Market Revenue (billion) Forecast, by Application 2020 & 2033
- Table 60: India Organic Fish Market Volume (k Tons) Forecast, by Application 2020 & 2033
- Table 61: Australia Organic Fish Market Revenue (billion) Forecast, by Application 2020 & 2033
- Table 62: Australia Organic Fish Market Volume (k Tons) Forecast, by Application 2020 & 2033
- Table 63: Rest of Asia Pacific Organic Fish Market Revenue (billion) Forecast, by Application 2020 & 2033
- Table 64: Rest of Asia Pacific Organic Fish Market Volume (k Tons) Forecast, by Application 2020 & 2033
- Table 65: Global Organic Fish Market Revenue billion Forecast, by Type 2020 & 2033
- Table 66: Global Organic Fish Market Volume k Tons Forecast, by Type 2020 & 2033
- Table 67: Global Organic Fish Market Revenue billion Forecast, by Form 2020 & 2033
- Table 68: Global Organic Fish Market Volume k Tons Forecast, by Form 2020 & 2033
- Table 69: Global Organic Fish Market Revenue billion Forecast, by Distribution Channel 2020 & 2033
- Table 70: Global Organic Fish Market Volume k Tons Forecast, by Distribution Channel 2020 & 2033
- Table 71: Global Organic Fish Market Revenue billion Forecast, by Country 2020 & 2033
- Table 72: Global Organic Fish Market Volume k Tons Forecast, by Country 2020 & 2033
- Table 73: Brazil Organic Fish Market Revenue (billion) Forecast, by Application 2020 & 2033
- Table 74: Brazil Organic Fish Market Volume (k Tons) Forecast, by Application 2020 & 2033
- Table 75: Argentina Organic Fish Market Revenue (billion) Forecast, by Application 2020 & 2033
- Table 76: Argentina Organic Fish Market Volume (k Tons) Forecast, by Application 2020 & 2033
- Table 77: Rest of South America Organic Fish Market Revenue (billion) Forecast, by Application 2020 & 2033
- Table 78: Rest of South America Organic Fish Market Volume (k Tons) Forecast, by Application 2020 & 2033
- Table 79: Global Organic Fish Market Revenue billion Forecast, by Type 2020 & 2033
- Table 80: Global Organic Fish Market Volume k Tons Forecast, by Type 2020 & 2033
- Table 81: Global Organic Fish Market Revenue billion Forecast, by Form 2020 & 2033
- Table 82: Global Organic Fish Market Volume k Tons Forecast, by Form 2020 & 2033
- Table 83: Global Organic Fish Market Revenue billion Forecast, by Distribution Channel 2020 & 2033
- Table 84: Global Organic Fish Market Volume k Tons Forecast, by Distribution Channel 2020 & 2033
- Table 85: Global Organic Fish Market Revenue billion Forecast, by Country 2020 & 2033
- Table 86: Global Organic Fish Market Volume k Tons Forecast, by Country 2020 & 2033
- Table 87: South Africa Organic Fish Market Revenue (billion) Forecast, by Application 2020 & 2033
- Table 88: South Africa Organic Fish Market Volume (k Tons) Forecast, by Application 2020 & 2033
- Table 89: Saudi Arabia Organic Fish Market Revenue (billion) Forecast, by Application 2020 & 2033
- Table 90: Saudi Arabia Organic Fish Market Volume (k Tons) Forecast, by Application 2020 & 2033
- Table 91: Rest of Middle East and Africa Organic Fish Market Revenue (billion) Forecast, by Application 2020 & 2033
- Table 92: Rest of Middle East and Africa Organic Fish Market Volume (k Tons) Forecast, by Application 2020 & 2033
Frequently Asked Questions
1. What is the projected Compound Annual Growth Rate (CAGR) of the Organic Fish Market?
The projected CAGR is approximately 6%.
2. Which companies are prominent players in the Organic Fish Market?
Key companies in the market include Royal Greenland A/S, Dom International Limited, Indigofish Eco Farms Private Limited, Global Union Agro & IT Ltd *List Not Exhaustive, Anova Seafood B V, Coombe Farm Organic, Artisanfish LLC, Glenarm Organic Salmon Ltd, Mowi ASA, The Irish Organic Salmon Co.
3. What are the main segments of the Organic Fish Market?
The market segments include Type, Form, Distribution Channel.
4. Can you provide details about the market size?
The market size is estimated to be USD 3.02 billion as of 2022.
5. What are some drivers contributing to market growth?
Increasing Demand for Processed Food Products; Technological Advancements Supporting Market Growth.
6. What are the notable trends driving market growth?
Rising Health Awareness Promoting Demand.
7. Are there any restraints impacting market growth?
Increasing Cost of Production Due to Rise in Energy and Labor Cost.
8. Can you provide examples of recent developments in the market?
February 2022: MOWI launched new organic Scottish salmon on Ocado. MOWI expanded its range of products by launching two new organic salmon products independently verified by the Soil Association. The new MOWI Scottish salmon fillets (240g) and mild smoked Scottish salmon slices (100g) are available on Ocado.com.
9. What pricing options are available for accessing the report?
Pricing options include single-user, multi-user, and enterprise licenses priced at USD 4750, USD 5250, and USD 8750 respectively.
10. Is the market size provided in terms of value or volume?
The market size is provided in terms of value, measured in billion and volume, measured in k Tons.
11. Are there any specific market keywords associated with the report?
Yes, the market keyword associated with the report is "Organic Fish Market," which aids in identifying and referencing the specific market segment covered.
12. How do I determine which pricing option suits my needs best?
The pricing options vary based on user requirements and access needs. Individual users may opt for single-user licenses, while businesses requiring broader access may choose multi-user or enterprise licenses for cost-effective access to the report.
13. Are there any additional resources or data provided in the Organic Fish Market report?
While the report offers comprehensive insights, it's advisable to review the specific contents or supplementary materials provided to ascertain if additional resources or data are available.
14. How can I stay updated on further developments or reports in the Organic Fish Market?
To stay informed about further developments, trends, and reports in the Organic Fish Market, consider subscribing to industry newsletters, following relevant companies and organizations, or regularly checking reputable industry news sources and publications.
Methodology
Step 1 - Identification of Relevant Samples Size from Population Database


Step 2 - Approaches for Defining Global Market Size (Value, Volume* & Price*)

Note*: In applicable scenarios
Step 3 - Data Sources
Primary Research
- Web Analytics
- Survey Reports
- Research Institute
- Latest Research Reports
- Opinion Leaders
Secondary Research
- Annual Reports
- White Paper
- Latest Press Release
- Industry Association
- Paid Database
- Investor Presentations

Step 4 - Data Triangulation
Involves using different sources of information in order to increase the validity of a study
These sources are likely to be stakeholders in a program - participants, other researchers, program staff, other community members, and so on.
Then we put all data in single framework & apply various statistical tools to find out the dynamic on the market.
During the analysis stage, feedback from the stakeholder groups would be compared to determine areas of agreement as well as areas of divergence

