
Key Insights
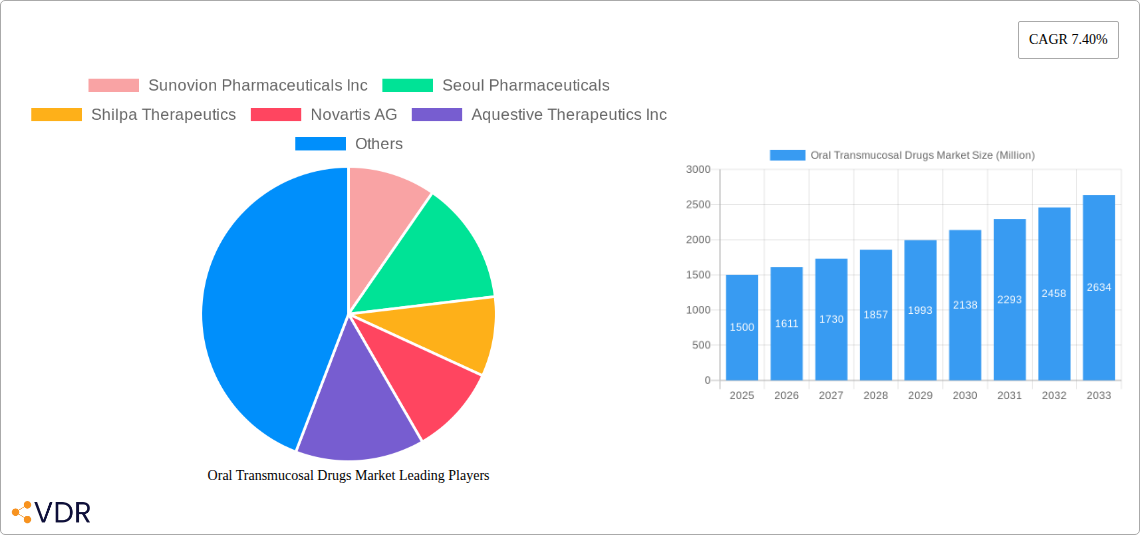
The global oral transmucosal drug market is experiencing robust growth, projected to reach a substantial size by 2033, driven by a 7.40% CAGR. This expansion is fueled by several key factors. Firstly, the increasing prevalence of chronic conditions like opioid dependence, nausea and vomiting, and neurological disorders, coupled with a growing preference for non-invasive drug delivery methods, significantly boosts market demand. Secondly, the pharmaceutical industry's continuous innovation in developing more effective and patient-friendly oral transmucosal formulations, such as sublingual tablets and films, contributes to market expansion. Technological advancements leading to improved bioavailability and faster onset of action are further enhancing the appeal of these drugs. Finally, the rising accessibility of online pharmacies and increasing healthcare expenditure in developed and emerging economies are also contributing to market growth.
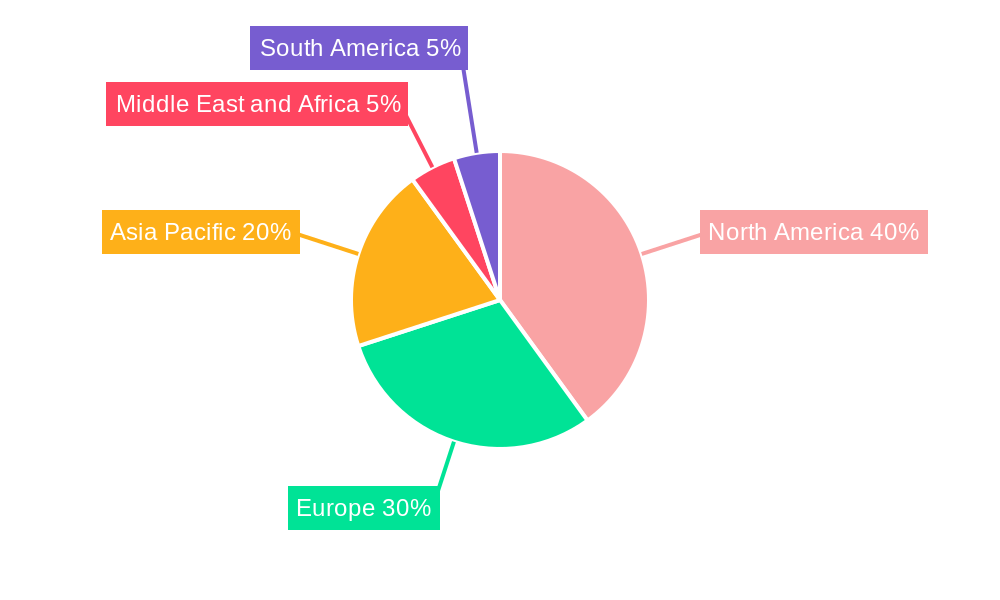
However, the market faces some challenges. High research and development costs associated with developing new formulations and securing regulatory approvals pose a significant hurdle for smaller pharmaceutical companies. Furthermore, potential side effects associated with certain oral transmucosal drugs and concerns regarding patient compliance can hinder market growth. Despite these restraints, the market segmentation, encompassing various product types, routes of administration, indications, and distribution channels, presents significant opportunities for specialized drug development and targeted marketing strategies. The prominent players mentioned – Sunovion Pharmaceuticals Inc, Seoul Pharmaceuticals, Shilpa Therapeutics, Novartis AG, Aquestive Therapeutics Inc, ZIM Laboratories Limited, GW Pharmaceuticals plc, C L Pharm Co Ltd, IntelGenx Corp, and Pfizer Inc – are actively engaged in developing innovative products and expanding their market presence. The geographic distribution of the market across North America, Europe, Asia Pacific, Middle East & Africa, and South America reflects varying levels of healthcare infrastructure and drug adoption rates, presenting opportunities for regional-specific market penetration.
Oral Transmucosal Drugs Market: A Comprehensive Market Report (2019-2033)
This comprehensive report provides an in-depth analysis of the Oral Transmucosal Drugs market, encompassing its current state, future trajectory, and key players. With a focus on market segmentation by product type, route of administration, indication, and distribution channel, this report offers invaluable insights for industry professionals, investors, and stakeholders. The study period covers 2019-2033, with 2025 serving as the base and estimated year. The forecast period spans 2025-2033, while the historical period encompasses 2019-2024. The total market size in 2025 is estimated at xx Million units.
Oral Transmucosal Drugs Market Market Dynamics & Structure
The oral transmucosal drug market is characterized by moderate concentration, with key players like Sunovion Pharmaceuticals Inc, Novartis AG, and Pfizer Inc holding significant market share (estimated at xx% combined in 2025). Technological innovation, primarily focused on enhanced drug delivery systems (e.g., improved film formulations and faster dissolution), is a major growth driver. Stringent regulatory frameworks, particularly concerning bioavailability and safety, present challenges. Competitive pressure from other drug delivery methods (e.g., injectables, transdermal patches) necessitates continuous innovation. The market exhibits growth across diverse end-user demographics, reflecting the increasing prevalence of chronic conditions requiring convenient and effective treatment options. M&A activity has been moderate (xx deals in the past 5 years), indicating a strategic focus on expanding product portfolios and strengthening market presence.
- Market Concentration: Moderately concentrated, with top 3 players holding xx% market share in 2025.
- Technological Innovation: Focus on improved drug delivery systems (e.g., faster-dissolving films).
- Regulatory Landscape: Stringent regulations concerning bioavailability and safety.
- Competitive Substitutes: Transdermal patches, injectables, oral capsules.
- End-User Demographics: Growing prevalence of chronic conditions driving market demand.
- M&A Activity: Moderate activity (xx deals in the past 5 years), driven by portfolio expansion.
Oral Transmucosal Drugs Market Growth Trends & Insights
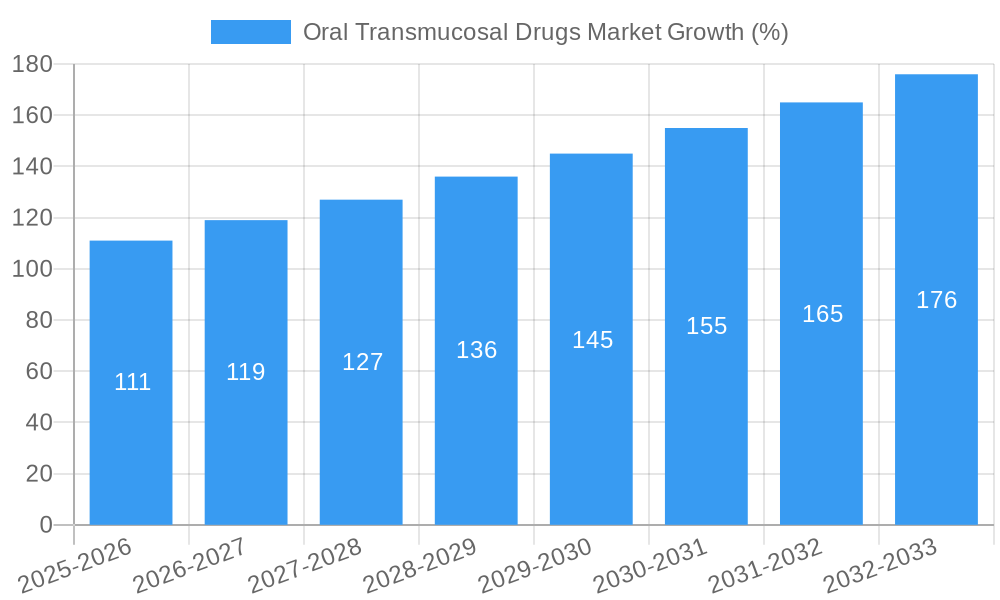
The oral transmucosal drug market is poised for significant growth, driven by increasing patient preference for non-invasive drug delivery methods and the expanding prevalence of chronic diseases like opioid dependence and neurological disorders. The market size has experienced substantial growth over the past few years, with a CAGR of xx% during the historical period (2019-2024). Technological advancements are enhancing drug efficacy and patient compliance, while shifting consumer behavior towards personalized medicine is fostering customized drug delivery solutions. Market penetration is expected to increase further, driven by rising healthcare expenditure and improved patient awareness. The forecast period (2025-2033) anticipates a CAGR of xx%, indicating substantial market expansion. Specific factors like the rising adoption of oral films and the growth of e-pharmacies contribute to this positive trajectory.
Dominant Regions, Countries, or Segments in Oral Transmucosal Drugs Market
North America currently dominates the oral transmucosal drug market, driven by high healthcare expenditure, advanced healthcare infrastructure, and a large patient population with chronic diseases. Europe follows as a significant market, with similar factors contributing to its growth. The sublingual mucosa route of administration holds the largest market share, owing to its ease of use and rapid absorption. Within product types, oral films are witnessing the highest growth, fuelled by improved patient convenience and bioavailability. Opioid dependence and neurological disorders represent key therapeutic areas driving market expansion. Hospital pharmacies currently hold a significant share of the distribution channel, followed by retail pharmacies. The online pharmacy segment is anticipated to show strong growth in the coming years due to increased accessibility and convenience.
- North America: Largest market share due to high healthcare expenditure and prevalence of chronic diseases.
- Europe: Second-largest market, characterized by strong pharmaceutical infrastructure.
- Sublingual Mucosa: Dominant route of administration due to ease of use and rapid absorption.
- Oral Films: Fastest-growing product type due to improved patient convenience and bioavailability.
- Opioid Dependence & Neurological Disorders: Key therapeutic indications driving market expansion.
- Hospital Pharmacies: Currently the dominant distribution channel.
- Online Pharmacies: High growth potential due to increased accessibility and convenience.
Oral Transmucosal Drugs Market Product Landscape
The oral transmucosal drug market showcases continuous innovation in product design and formulation. Recent advancements focus on improving drug stability, enhancing patient compliance, and developing faster-dissolving films and tablets. These advancements are directly reflected in improved patient outcomes and increased market penetration. The unique selling propositions frequently centre around enhanced bioavailability, reduced side effects, and simplified administration for improved patient compliance.
Key Drivers, Barriers & Challenges in Oral Transmucosal Drugs Market
Key Drivers: The rising prevalence of chronic diseases, growing demand for patient-friendly drug delivery systems, technological advancements in drug formulation, and increasing healthcare expenditure are primary drivers.
Challenges: Stringent regulatory approvals, complexities in formulation and manufacturing, potential for adverse effects, and the competitive landscape present significant challenges. High R&D costs and limited reimbursement policies also impact market growth. Supply chain disruptions can lead to shortages, negatively affecting market supply.
Emerging Opportunities in Oral Transmucosal Drugs Market
Untapped markets in developing economies with high disease burdens represent significant opportunities. The development of novel drug formulations, incorporating advanced technologies like nanotechnology for targeted drug delivery, is another promising area. Evolving consumer preferences for personalized medicine and digital healthcare platforms will drive demand for tailored solutions and remote patient monitoring tools integrated into treatment plans.
Growth Accelerators in the Oral Transmucosal Drugs Market Industry
Technological breakthroughs in drug delivery systems, strategic partnerships between pharmaceutical companies and technology providers, and expansion into new geographic markets will significantly accelerate growth. These combined efforts will foster the development of innovative products and increase accessibility across diverse populations.
Key Players Shaping the Oral Transmucosal Drugs Market Market
- Sunovion Pharmaceuticals Inc
- Seoul Pharmaceuticals
- Shilpa Therapeutics
- Novartis AG
- Aquestive Therapeutics Inc
- ZIM Laboratories Limited
- GW Pharmaceuticals plc
- C L Pharm Co Ltd
- IntelGenx Corp
- Pfizer Inc
Notable Milestones in Oral Transmucosal Drugs Market Sector
- September 2021: IntelGenx Corp. launched RIZAPORT (rizatriptan benzoate oral film) in Spain through its EU partner, Exeltis Healthcare S.L.
- January 2021: CURE Pharmaceutical received FDA IND approval for CUREfilm Blue (sildenafil citrate oral film) for erectile dysfunction.
In-Depth Oral Transmucosal Drugs Market Market Outlook
The oral transmucosal drug market holds significant long-term potential, driven by continued technological advancements, expansion into new therapeutic areas, and the growing demand for convenient and effective drug delivery options. Strategic partnerships and acquisitions will further shape the market landscape, creating opportunities for innovative product development and market expansion. The focus on personalized medicine and digital health integration promises to enhance patient outcomes and propel future market growth.
Oral Transmucosal Drugs Market Segmentation
-
1. Product Type
- 1.1. Tablets
- 1.2. Films
- 1.3. Liquid & Spray
- 1.4. Others
-
2. Route of Administration
- 2.1. Sublingual Mucosa
- 2.2. Buccal Mucosa
- 2.3. Others
-
3. Indication
- 3.1. Opioid Dependence
- 3.2. Nausea and Vomiting
- 3.3. Erectile Dysfunction
- 3.4. Neurological Disorders
- 3.5. Others
-
4. Distribution Channel
- 4.1. Hospital Pharmacies
- 4.2. Retail Pharmacies
- 4.3. Online Pharmacies
Oral Transmucosal Drugs Market Segmentation By Geography
-
1. North America
- 1.1. United States
- 1.2. Canada
- 1.3. Mexico
-
2. Europe
- 2.1. Germany
- 2.2. United Kingdom
- 2.3. France
- 2.4. Italy
- 2.5. Spain
- 2.6. Rest of Europe
-
3. Asia Pacific
- 3.1. China
- 3.2. Japan
- 3.3. India
- 3.4. Australia
- 3.5. South Korea
- 3.6. Rest of Asia Pacific
-
4. Middle East and Africa
- 4.1. GCC
- 4.2. South Africa
- 4.3. Rest of Middle East and Africa
-
5. South America
- 5.1. Brazil
- 5.2. Argentina
- 5.3. Rest of South America
Oral Transmucosal Drugs Market REPORT HIGHLIGHTS
| Aspects | Details |
|---|---|
| Study Period | 2019-2033 |
| Base Year | 2024 |
| Estimated Year | 2025 |
| Forecast Period | 2025-2033 |
| Historical Period | 2019-2024 |
| Growth Rate | CAGR of 7.40% from 2019-2033 |
| Segmentation |
|
Table of Contents
- 1. Introduction
- 1.1. Research Scope
- 1.2. Market Segmentation
- 1.3. Research Methodology
- 1.4. Definitions and Assumptions
- 2. Executive Summary
- 2.1. Introduction
- 3. Market Dynamics
- 3.1. Introduction
- 3.2. Market Drivers
- 3.2.1. Growing Burden of Target Diseases; Rise in R&D Activities and Product Launches
- 3.3. Market Restrains
- 3.3.1. Disadvantages Associated With Oral Transmucosal Drug Delivery
- 3.4. Market Trends
- 3.4.1. Tablets segment is Expected to Hold a Significant Share Over the Forecast Period
- 4. Market Factor Analysis
- 4.1. Porters Five Forces
- 4.2. Supply/Value Chain
- 4.3. PESTEL analysis
- 4.4. Market Entropy
- 4.5. Patent/Trademark Analysis
- 5. Global Oral Transmucosal Drugs Market Analysis, Insights and Forecast, 2019-2031
- 5.1. Market Analysis, Insights and Forecast - by Product Type
- 5.1.1. Tablets
- 5.1.2. Films
- 5.1.3. Liquid & Spray
- 5.1.4. Others
- 5.2. Market Analysis, Insights and Forecast - by Route of Administration
- 5.2.1. Sublingual Mucosa
- 5.2.2. Buccal Mucosa
- 5.2.3. Others
- 5.3. Market Analysis, Insights and Forecast - by Indication
- 5.3.1. Opioid Dependence
- 5.3.2. Nausea and Vomiting
- 5.3.3. Erectile Dysfunction
- 5.3.4. Neurological Disorders
- 5.3.5. Others
- 5.4. Market Analysis, Insights and Forecast - by Distribution Channel
- 5.4.1. Hospital Pharmacies
- 5.4.2. Retail Pharmacies
- 5.4.3. Online Pharmacies
- 5.5. Market Analysis, Insights and Forecast - by Region
- 5.5.1. North America
- 5.5.2. Europe
- 5.5.3. Asia Pacific
- 5.5.4. Middle East and Africa
- 5.5.5. South America
- 5.1. Market Analysis, Insights and Forecast - by Product Type
- 6. North America Oral Transmucosal Drugs Market Analysis, Insights and Forecast, 2019-2031
- 6.1. Market Analysis, Insights and Forecast - by Product Type
- 6.1.1. Tablets
- 6.1.2. Films
- 6.1.3. Liquid & Spray
- 6.1.4. Others
- 6.2. Market Analysis, Insights and Forecast - by Route of Administration
- 6.2.1. Sublingual Mucosa
- 6.2.2. Buccal Mucosa
- 6.2.3. Others
- 6.3. Market Analysis, Insights and Forecast - by Indication
- 6.3.1. Opioid Dependence
- 6.3.2. Nausea and Vomiting
- 6.3.3. Erectile Dysfunction
- 6.3.4. Neurological Disorders
- 6.3.5. Others
- 6.4. Market Analysis, Insights and Forecast - by Distribution Channel
- 6.4.1. Hospital Pharmacies
- 6.4.2. Retail Pharmacies
- 6.4.3. Online Pharmacies
- 6.1. Market Analysis, Insights and Forecast - by Product Type
- 7. Europe Oral Transmucosal Drugs Market Analysis, Insights and Forecast, 2019-2031
- 7.1. Market Analysis, Insights and Forecast - by Product Type
- 7.1.1. Tablets
- 7.1.2. Films
- 7.1.3. Liquid & Spray
- 7.1.4. Others
- 7.2. Market Analysis, Insights and Forecast - by Route of Administration
- 7.2.1. Sublingual Mucosa
- 7.2.2. Buccal Mucosa
- 7.2.3. Others
- 7.3. Market Analysis, Insights and Forecast - by Indication
- 7.3.1. Opioid Dependence
- 7.3.2. Nausea and Vomiting
- 7.3.3. Erectile Dysfunction
- 7.3.4. Neurological Disorders
- 7.3.5. Others
- 7.4. Market Analysis, Insights and Forecast - by Distribution Channel
- 7.4.1. Hospital Pharmacies
- 7.4.2. Retail Pharmacies
- 7.4.3. Online Pharmacies
- 7.1. Market Analysis, Insights and Forecast - by Product Type
- 8. Asia Pacific Oral Transmucosal Drugs Market Analysis, Insights and Forecast, 2019-2031
- 8.1. Market Analysis, Insights and Forecast - by Product Type
- 8.1.1. Tablets
- 8.1.2. Films
- 8.1.3. Liquid & Spray
- 8.1.4. Others
- 8.2. Market Analysis, Insights and Forecast - by Route of Administration
- 8.2.1. Sublingual Mucosa
- 8.2.2. Buccal Mucosa
- 8.2.3. Others
- 8.3. Market Analysis, Insights and Forecast - by Indication
- 8.3.1. Opioid Dependence
- 8.3.2. Nausea and Vomiting
- 8.3.3. Erectile Dysfunction
- 8.3.4. Neurological Disorders
- 8.3.5. Others
- 8.4. Market Analysis, Insights and Forecast - by Distribution Channel
- 8.4.1. Hospital Pharmacies
- 8.4.2. Retail Pharmacies
- 8.4.3. Online Pharmacies
- 8.1. Market Analysis, Insights and Forecast - by Product Type
- 9. Middle East and Africa Oral Transmucosal Drugs Market Analysis, Insights and Forecast, 2019-2031
- 9.1. Market Analysis, Insights and Forecast - by Product Type
- 9.1.1. Tablets
- 9.1.2. Films
- 9.1.3. Liquid & Spray
- 9.1.4. Others
- 9.2. Market Analysis, Insights and Forecast - by Route of Administration
- 9.2.1. Sublingual Mucosa
- 9.2.2. Buccal Mucosa
- 9.2.3. Others
- 9.3. Market Analysis, Insights and Forecast - by Indication
- 9.3.1. Opioid Dependence
- 9.3.2. Nausea and Vomiting
- 9.3.3. Erectile Dysfunction
- 9.3.4. Neurological Disorders
- 9.3.5. Others
- 9.4. Market Analysis, Insights and Forecast - by Distribution Channel
- 9.4.1. Hospital Pharmacies
- 9.4.2. Retail Pharmacies
- 9.4.3. Online Pharmacies
- 9.1. Market Analysis, Insights and Forecast - by Product Type
- 10. South America Oral Transmucosal Drugs Market Analysis, Insights and Forecast, 2019-2031
- 10.1. Market Analysis, Insights and Forecast - by Product Type
- 10.1.1. Tablets
- 10.1.2. Films
- 10.1.3. Liquid & Spray
- 10.1.4. Others
- 10.2. Market Analysis, Insights and Forecast - by Route of Administration
- 10.2.1. Sublingual Mucosa
- 10.2.2. Buccal Mucosa
- 10.2.3. Others
- 10.3. Market Analysis, Insights and Forecast - by Indication
- 10.3.1. Opioid Dependence
- 10.3.2. Nausea and Vomiting
- 10.3.3. Erectile Dysfunction
- 10.3.4. Neurological Disorders
- 10.3.5. Others
- 10.4. Market Analysis, Insights and Forecast - by Distribution Channel
- 10.4.1. Hospital Pharmacies
- 10.4.2. Retail Pharmacies
- 10.4.3. Online Pharmacies
- 10.1. Market Analysis, Insights and Forecast - by Product Type
- 11. North America Oral Transmucosal Drugs Market Analysis, Insights and Forecast, 2019-2031
- 11.1. Market Analysis, Insights and Forecast - By Country/Sub-region
- 11.1.1 United States
- 11.1.2 Canada
- 11.1.3 Mexico
- 12. Europe Oral Transmucosal Drugs Market Analysis, Insights and Forecast, 2019-2031
- 12.1. Market Analysis, Insights and Forecast - By Country/Sub-region
- 12.1.1 Germany
- 12.1.2 United Kingdom
- 12.1.3 France
- 12.1.4 Italy
- 12.1.5 Spain
- 12.1.6 Rest of Europe
- 13. Asia Pacific Oral Transmucosal Drugs Market Analysis, Insights and Forecast, 2019-2031
- 13.1. Market Analysis, Insights and Forecast - By Country/Sub-region
- 13.1.1 China
- 13.1.2 Japan
- 13.1.3 India
- 13.1.4 Australia
- 13.1.5 South Korea
- 13.1.6 Rest of Asia Pacific
- 14. Middle East and Africa Oral Transmucosal Drugs Market Analysis, Insights and Forecast, 2019-2031
- 14.1. Market Analysis, Insights and Forecast - By Country/Sub-region
- 14.1.1 GCC
- 14.1.2 South Africa
- 14.1.3 Rest of Middle East and Africa
- 15. South America Oral Transmucosal Drugs Market Analysis, Insights and Forecast, 2019-2031
- 15.1. Market Analysis, Insights and Forecast - By Country/Sub-region
- 15.1.1 Brazil
- 15.1.2 Argentina
- 15.1.3 Rest of South America
- 16. Competitive Analysis
- 16.1. Global Market Share Analysis 2024
- 16.2. Company Profiles
- 16.2.1 Sunovion Pharmaceuticals Inc
- 16.2.1.1. Overview
- 16.2.1.2. Products
- 16.2.1.3. SWOT Analysis
- 16.2.1.4. Recent Developments
- 16.2.1.5. Financials (Based on Availability)
- 16.2.2 Seoul Pharmaceuticals
- 16.2.2.1. Overview
- 16.2.2.2. Products
- 16.2.2.3. SWOT Analysis
- 16.2.2.4. Recent Developments
- 16.2.2.5. Financials (Based on Availability)
- 16.2.3 Shilpa Therapeutics
- 16.2.3.1. Overview
- 16.2.3.2. Products
- 16.2.3.3. SWOT Analysis
- 16.2.3.4. Recent Developments
- 16.2.3.5. Financials (Based on Availability)
- 16.2.4 Novartis AG
- 16.2.4.1. Overview
- 16.2.4.2. Products
- 16.2.4.3. SWOT Analysis
- 16.2.4.4. Recent Developments
- 16.2.4.5. Financials (Based on Availability)
- 16.2.5 Aquestive Therapeutics Inc
- 16.2.5.1. Overview
- 16.2.5.2. Products
- 16.2.5.3. SWOT Analysis
- 16.2.5.4. Recent Developments
- 16.2.5.5. Financials (Based on Availability)
- 16.2.6 ZIM Laboratories Limited
- 16.2.6.1. Overview
- 16.2.6.2. Products
- 16.2.6.3. SWOT Analysis
- 16.2.6.4. Recent Developments
- 16.2.6.5. Financials (Based on Availability)
- 16.2.7 GW Pharmaceuticals plc
- 16.2.7.1. Overview
- 16.2.7.2. Products
- 16.2.7.3. SWOT Analysis
- 16.2.7.4. Recent Developments
- 16.2.7.5. Financials (Based on Availability)
- 16.2.8 C L Pharm Co Ltd
- 16.2.8.1. Overview
- 16.2.8.2. Products
- 16.2.8.3. SWOT Analysis
- 16.2.8.4. Recent Developments
- 16.2.8.5. Financials (Based on Availability)
- 16.2.9 IntelGenx Corp
- 16.2.9.1. Overview
- 16.2.9.2. Products
- 16.2.9.3. SWOT Analysis
- 16.2.9.4. Recent Developments
- 16.2.9.5. Financials (Based on Availability)
- 16.2.10 Pfizer Inc
- 16.2.10.1. Overview
- 16.2.10.2. Products
- 16.2.10.3. SWOT Analysis
- 16.2.10.4. Recent Developments
- 16.2.10.5. Financials (Based on Availability)
- 16.2.1 Sunovion Pharmaceuticals Inc
List of Figures
- Figure 1: Global Oral Transmucosal Drugs Market Revenue Breakdown (Million, %) by Region 2024 & 2032
- Figure 2: Global Oral Transmucosal Drugs Market Volume Breakdown (K Unit, %) by Region 2024 & 2032
- Figure 3: North America Oral Transmucosal Drugs Market Revenue (Million), by Country 2024 & 2032
- Figure 4: North America Oral Transmucosal Drugs Market Volume (K Unit), by Country 2024 & 2032
- Figure 5: North America Oral Transmucosal Drugs Market Revenue Share (%), by Country 2024 & 2032
- Figure 6: North America Oral Transmucosal Drugs Market Volume Share (%), by Country 2024 & 2032
- Figure 7: Europe Oral Transmucosal Drugs Market Revenue (Million), by Country 2024 & 2032
- Figure 8: Europe Oral Transmucosal Drugs Market Volume (K Unit), by Country 2024 & 2032
- Figure 9: Europe Oral Transmucosal Drugs Market Revenue Share (%), by Country 2024 & 2032
- Figure 10: Europe Oral Transmucosal Drugs Market Volume Share (%), by Country 2024 & 2032
- Figure 11: Asia Pacific Oral Transmucosal Drugs Market Revenue (Million), by Country 2024 & 2032
- Figure 12: Asia Pacific Oral Transmucosal Drugs Market Volume (K Unit), by Country 2024 & 2032
- Figure 13: Asia Pacific Oral Transmucosal Drugs Market Revenue Share (%), by Country 2024 & 2032
- Figure 14: Asia Pacific Oral Transmucosal Drugs Market Volume Share (%), by Country 2024 & 2032
- Figure 15: Middle East and Africa Oral Transmucosal Drugs Market Revenue (Million), by Country 2024 & 2032
- Figure 16: Middle East and Africa Oral Transmucosal Drugs Market Volume (K Unit), by Country 2024 & 2032
- Figure 17: Middle East and Africa Oral Transmucosal Drugs Market Revenue Share (%), by Country 2024 & 2032
- Figure 18: Middle East and Africa Oral Transmucosal Drugs Market Volume Share (%), by Country 2024 & 2032
- Figure 19: South America Oral Transmucosal Drugs Market Revenue (Million), by Country 2024 & 2032
- Figure 20: South America Oral Transmucosal Drugs Market Volume (K Unit), by Country 2024 & 2032
- Figure 21: South America Oral Transmucosal Drugs Market Revenue Share (%), by Country 2024 & 2032
- Figure 22: South America Oral Transmucosal Drugs Market Volume Share (%), by Country 2024 & 2032
- Figure 23: North America Oral Transmucosal Drugs Market Revenue (Million), by Product Type 2024 & 2032
- Figure 24: North America Oral Transmucosal Drugs Market Volume (K Unit), by Product Type 2024 & 2032
- Figure 25: North America Oral Transmucosal Drugs Market Revenue Share (%), by Product Type 2024 & 2032
- Figure 26: North America Oral Transmucosal Drugs Market Volume Share (%), by Product Type 2024 & 2032
- Figure 27: North America Oral Transmucosal Drugs Market Revenue (Million), by Route of Administration 2024 & 2032
- Figure 28: North America Oral Transmucosal Drugs Market Volume (K Unit), by Route of Administration 2024 & 2032
- Figure 29: North America Oral Transmucosal Drugs Market Revenue Share (%), by Route of Administration 2024 & 2032
- Figure 30: North America Oral Transmucosal Drugs Market Volume Share (%), by Route of Administration 2024 & 2032
- Figure 31: North America Oral Transmucosal Drugs Market Revenue (Million), by Indication 2024 & 2032
- Figure 32: North America Oral Transmucosal Drugs Market Volume (K Unit), by Indication 2024 & 2032
- Figure 33: North America Oral Transmucosal Drugs Market Revenue Share (%), by Indication 2024 & 2032
- Figure 34: North America Oral Transmucosal Drugs Market Volume Share (%), by Indication 2024 & 2032
- Figure 35: North America Oral Transmucosal Drugs Market Revenue (Million), by Distribution Channel 2024 & 2032
- Figure 36: North America Oral Transmucosal Drugs Market Volume (K Unit), by Distribution Channel 2024 & 2032
- Figure 37: North America Oral Transmucosal Drugs Market Revenue Share (%), by Distribution Channel 2024 & 2032
- Figure 38: North America Oral Transmucosal Drugs Market Volume Share (%), by Distribution Channel 2024 & 2032
- Figure 39: North America Oral Transmucosal Drugs Market Revenue (Million), by Country 2024 & 2032
- Figure 40: North America Oral Transmucosal Drugs Market Volume (K Unit), by Country 2024 & 2032
- Figure 41: North America Oral Transmucosal Drugs Market Revenue Share (%), by Country 2024 & 2032
- Figure 42: North America Oral Transmucosal Drugs Market Volume Share (%), by Country 2024 & 2032
- Figure 43: Europe Oral Transmucosal Drugs Market Revenue (Million), by Product Type 2024 & 2032
- Figure 44: Europe Oral Transmucosal Drugs Market Volume (K Unit), by Product Type 2024 & 2032
- Figure 45: Europe Oral Transmucosal Drugs Market Revenue Share (%), by Product Type 2024 & 2032
- Figure 46: Europe Oral Transmucosal Drugs Market Volume Share (%), by Product Type 2024 & 2032
- Figure 47: Europe Oral Transmucosal Drugs Market Revenue (Million), by Route of Administration 2024 & 2032
- Figure 48: Europe Oral Transmucosal Drugs Market Volume (K Unit), by Route of Administration 2024 & 2032
- Figure 49: Europe Oral Transmucosal Drugs Market Revenue Share (%), by Route of Administration 2024 & 2032
- Figure 50: Europe Oral Transmucosal Drugs Market Volume Share (%), by Route of Administration 2024 & 2032
- Figure 51: Europe Oral Transmucosal Drugs Market Revenue (Million), by Indication 2024 & 2032
- Figure 52: Europe Oral Transmucosal Drugs Market Volume (K Unit), by Indication 2024 & 2032
- Figure 53: Europe Oral Transmucosal Drugs Market Revenue Share (%), by Indication 2024 & 2032
- Figure 54: Europe Oral Transmucosal Drugs Market Volume Share (%), by Indication 2024 & 2032
- Figure 55: Europe Oral Transmucosal Drugs Market Revenue (Million), by Distribution Channel 2024 & 2032
- Figure 56: Europe Oral Transmucosal Drugs Market Volume (K Unit), by Distribution Channel 2024 & 2032
- Figure 57: Europe Oral Transmucosal Drugs Market Revenue Share (%), by Distribution Channel 2024 & 2032
- Figure 58: Europe Oral Transmucosal Drugs Market Volume Share (%), by Distribution Channel 2024 & 2032
- Figure 59: Europe Oral Transmucosal Drugs Market Revenue (Million), by Country 2024 & 2032
- Figure 60: Europe Oral Transmucosal Drugs Market Volume (K Unit), by Country 2024 & 2032
- Figure 61: Europe Oral Transmucosal Drugs Market Revenue Share (%), by Country 2024 & 2032
- Figure 62: Europe Oral Transmucosal Drugs Market Volume Share (%), by Country 2024 & 2032
- Figure 63: Asia Pacific Oral Transmucosal Drugs Market Revenue (Million), by Product Type 2024 & 2032
- Figure 64: Asia Pacific Oral Transmucosal Drugs Market Volume (K Unit), by Product Type 2024 & 2032
- Figure 65: Asia Pacific Oral Transmucosal Drugs Market Revenue Share (%), by Product Type 2024 & 2032
- Figure 66: Asia Pacific Oral Transmucosal Drugs Market Volume Share (%), by Product Type 2024 & 2032
- Figure 67: Asia Pacific Oral Transmucosal Drugs Market Revenue (Million), by Route of Administration 2024 & 2032
- Figure 68: Asia Pacific Oral Transmucosal Drugs Market Volume (K Unit), by Route of Administration 2024 & 2032
- Figure 69: Asia Pacific Oral Transmucosal Drugs Market Revenue Share (%), by Route of Administration 2024 & 2032
- Figure 70: Asia Pacific Oral Transmucosal Drugs Market Volume Share (%), by Route of Administration 2024 & 2032
- Figure 71: Asia Pacific Oral Transmucosal Drugs Market Revenue (Million), by Indication 2024 & 2032
- Figure 72: Asia Pacific Oral Transmucosal Drugs Market Volume (K Unit), by Indication 2024 & 2032
- Figure 73: Asia Pacific Oral Transmucosal Drugs Market Revenue Share (%), by Indication 2024 & 2032
- Figure 74: Asia Pacific Oral Transmucosal Drugs Market Volume Share (%), by Indication 2024 & 2032
- Figure 75: Asia Pacific Oral Transmucosal Drugs Market Revenue (Million), by Distribution Channel 2024 & 2032
- Figure 76: Asia Pacific Oral Transmucosal Drugs Market Volume (K Unit), by Distribution Channel 2024 & 2032
- Figure 77: Asia Pacific Oral Transmucosal Drugs Market Revenue Share (%), by Distribution Channel 2024 & 2032
- Figure 78: Asia Pacific Oral Transmucosal Drugs Market Volume Share (%), by Distribution Channel 2024 & 2032
- Figure 79: Asia Pacific Oral Transmucosal Drugs Market Revenue (Million), by Country 2024 & 2032
- Figure 80: Asia Pacific Oral Transmucosal Drugs Market Volume (K Unit), by Country 2024 & 2032
- Figure 81: Asia Pacific Oral Transmucosal Drugs Market Revenue Share (%), by Country 2024 & 2032
- Figure 82: Asia Pacific Oral Transmucosal Drugs Market Volume Share (%), by Country 2024 & 2032
- Figure 83: Middle East and Africa Oral Transmucosal Drugs Market Revenue (Million), by Product Type 2024 & 2032
- Figure 84: Middle East and Africa Oral Transmucosal Drugs Market Volume (K Unit), by Product Type 2024 & 2032
- Figure 85: Middle East and Africa Oral Transmucosal Drugs Market Revenue Share (%), by Product Type 2024 & 2032
- Figure 86: Middle East and Africa Oral Transmucosal Drugs Market Volume Share (%), by Product Type 2024 & 2032
- Figure 87: Middle East and Africa Oral Transmucosal Drugs Market Revenue (Million), by Route of Administration 2024 & 2032
- Figure 88: Middle East and Africa Oral Transmucosal Drugs Market Volume (K Unit), by Route of Administration 2024 & 2032
- Figure 89: Middle East and Africa Oral Transmucosal Drugs Market Revenue Share (%), by Route of Administration 2024 & 2032
- Figure 90: Middle East and Africa Oral Transmucosal Drugs Market Volume Share (%), by Route of Administration 2024 & 2032
- Figure 91: Middle East and Africa Oral Transmucosal Drugs Market Revenue (Million), by Indication 2024 & 2032
- Figure 92: Middle East and Africa Oral Transmucosal Drugs Market Volume (K Unit), by Indication 2024 & 2032
- Figure 93: Middle East and Africa Oral Transmucosal Drugs Market Revenue Share (%), by Indication 2024 & 2032
- Figure 94: Middle East and Africa Oral Transmucosal Drugs Market Volume Share (%), by Indication 2024 & 2032
- Figure 95: Middle East and Africa Oral Transmucosal Drugs Market Revenue (Million), by Distribution Channel 2024 & 2032
- Figure 96: Middle East and Africa Oral Transmucosal Drugs Market Volume (K Unit), by Distribution Channel 2024 & 2032
- Figure 97: Middle East and Africa Oral Transmucosal Drugs Market Revenue Share (%), by Distribution Channel 2024 & 2032
- Figure 98: Middle East and Africa Oral Transmucosal Drugs Market Volume Share (%), by Distribution Channel 2024 & 2032
- Figure 99: Middle East and Africa Oral Transmucosal Drugs Market Revenue (Million), by Country 2024 & 2032
- Figure 100: Middle East and Africa Oral Transmucosal Drugs Market Volume (K Unit), by Country 2024 & 2032
- Figure 101: Middle East and Africa Oral Transmucosal Drugs Market Revenue Share (%), by Country 2024 & 2032
- Figure 102: Middle East and Africa Oral Transmucosal Drugs Market Volume Share (%), by Country 2024 & 2032
- Figure 103: South America Oral Transmucosal Drugs Market Revenue (Million), by Product Type 2024 & 2032
- Figure 104: South America Oral Transmucosal Drugs Market Volume (K Unit), by Product Type 2024 & 2032
- Figure 105: South America Oral Transmucosal Drugs Market Revenue Share (%), by Product Type 2024 & 2032
- Figure 106: South America Oral Transmucosal Drugs Market Volume Share (%), by Product Type 2024 & 2032
- Figure 107: South America Oral Transmucosal Drugs Market Revenue (Million), by Route of Administration 2024 & 2032
- Figure 108: South America Oral Transmucosal Drugs Market Volume (K Unit), by Route of Administration 2024 & 2032
- Figure 109: South America Oral Transmucosal Drugs Market Revenue Share (%), by Route of Administration 2024 & 2032
- Figure 110: South America Oral Transmucosal Drugs Market Volume Share (%), by Route of Administration 2024 & 2032
- Figure 111: South America Oral Transmucosal Drugs Market Revenue (Million), by Indication 2024 & 2032
- Figure 112: South America Oral Transmucosal Drugs Market Volume (K Unit), by Indication 2024 & 2032
- Figure 113: South America Oral Transmucosal Drugs Market Revenue Share (%), by Indication 2024 & 2032
- Figure 114: South America Oral Transmucosal Drugs Market Volume Share (%), by Indication 2024 & 2032
- Figure 115: South America Oral Transmucosal Drugs Market Revenue (Million), by Distribution Channel 2024 & 2032
- Figure 116: South America Oral Transmucosal Drugs Market Volume (K Unit), by Distribution Channel 2024 & 2032
- Figure 117: South America Oral Transmucosal Drugs Market Revenue Share (%), by Distribution Channel 2024 & 2032
- Figure 118: South America Oral Transmucosal Drugs Market Volume Share (%), by Distribution Channel 2024 & 2032
- Figure 119: South America Oral Transmucosal Drugs Market Revenue (Million), by Country 2024 & 2032
- Figure 120: South America Oral Transmucosal Drugs Market Volume (K Unit), by Country 2024 & 2032
- Figure 121: South America Oral Transmucosal Drugs Market Revenue Share (%), by Country 2024 & 2032
- Figure 122: South America Oral Transmucosal Drugs Market Volume Share (%), by Country 2024 & 2032
List of Tables
- Table 1: Global Oral Transmucosal Drugs Market Revenue Million Forecast, by Region 2019 & 2032
- Table 2: Global Oral Transmucosal Drugs Market Volume K Unit Forecast, by Region 2019 & 2032
- Table 3: Global Oral Transmucosal Drugs Market Revenue Million Forecast, by Product Type 2019 & 2032
- Table 4: Global Oral Transmucosal Drugs Market Volume K Unit Forecast, by Product Type 2019 & 2032
- Table 5: Global Oral Transmucosal Drugs Market Revenue Million Forecast, by Route of Administration 2019 & 2032
- Table 6: Global Oral Transmucosal Drugs Market Volume K Unit Forecast, by Route of Administration 2019 & 2032
- Table 7: Global Oral Transmucosal Drugs Market Revenue Million Forecast, by Indication 2019 & 2032
- Table 8: Global Oral Transmucosal Drugs Market Volume K Unit Forecast, by Indication 2019 & 2032
- Table 9: Global Oral Transmucosal Drugs Market Revenue Million Forecast, by Distribution Channel 2019 & 2032
- Table 10: Global Oral Transmucosal Drugs Market Volume K Unit Forecast, by Distribution Channel 2019 & 2032
- Table 11: Global Oral Transmucosal Drugs Market Revenue Million Forecast, by Region 2019 & 2032
- Table 12: Global Oral Transmucosal Drugs Market Volume K Unit Forecast, by Region 2019 & 2032
- Table 13: Global Oral Transmucosal Drugs Market Revenue Million Forecast, by Country 2019 & 2032
- Table 14: Global Oral Transmucosal Drugs Market Volume K Unit Forecast, by Country 2019 & 2032
- Table 15: United States Oral Transmucosal Drugs Market Revenue (Million) Forecast, by Application 2019 & 2032
- Table 16: United States Oral Transmucosal Drugs Market Volume (K Unit) Forecast, by Application 2019 & 2032
- Table 17: Canada Oral Transmucosal Drugs Market Revenue (Million) Forecast, by Application 2019 & 2032
- Table 18: Canada Oral Transmucosal Drugs Market Volume (K Unit) Forecast, by Application 2019 & 2032
- Table 19: Mexico Oral Transmucosal Drugs Market Revenue (Million) Forecast, by Application 2019 & 2032
- Table 20: Mexico Oral Transmucosal Drugs Market Volume (K Unit) Forecast, by Application 2019 & 2032
- Table 21: Global Oral Transmucosal Drugs Market Revenue Million Forecast, by Country 2019 & 2032
- Table 22: Global Oral Transmucosal Drugs Market Volume K Unit Forecast, by Country 2019 & 2032
- Table 23: Germany Oral Transmucosal Drugs Market Revenue (Million) Forecast, by Application 2019 & 2032
- Table 24: Germany Oral Transmucosal Drugs Market Volume (K Unit) Forecast, by Application 2019 & 2032
- Table 25: United Kingdom Oral Transmucosal Drugs Market Revenue (Million) Forecast, by Application 2019 & 2032
- Table 26: United Kingdom Oral Transmucosal Drugs Market Volume (K Unit) Forecast, by Application 2019 & 2032
- Table 27: France Oral Transmucosal Drugs Market Revenue (Million) Forecast, by Application 2019 & 2032
- Table 28: France Oral Transmucosal Drugs Market Volume (K Unit) Forecast, by Application 2019 & 2032
- Table 29: Italy Oral Transmucosal Drugs Market Revenue (Million) Forecast, by Application 2019 & 2032
- Table 30: Italy Oral Transmucosal Drugs Market Volume (K Unit) Forecast, by Application 2019 & 2032
- Table 31: Spain Oral Transmucosal Drugs Market Revenue (Million) Forecast, by Application 2019 & 2032
- Table 32: Spain Oral Transmucosal Drugs Market Volume (K Unit) Forecast, by Application 2019 & 2032
- Table 33: Rest of Europe Oral Transmucosal Drugs Market Revenue (Million) Forecast, by Application 2019 & 2032
- Table 34: Rest of Europe Oral Transmucosal Drugs Market Volume (K Unit) Forecast, by Application 2019 & 2032
- Table 35: Global Oral Transmucosal Drugs Market Revenue Million Forecast, by Country 2019 & 2032
- Table 36: Global Oral Transmucosal Drugs Market Volume K Unit Forecast, by Country 2019 & 2032
- Table 37: China Oral Transmucosal Drugs Market Revenue (Million) Forecast, by Application 2019 & 2032
- Table 38: China Oral Transmucosal Drugs Market Volume (K Unit) Forecast, by Application 2019 & 2032
- Table 39: Japan Oral Transmucosal Drugs Market Revenue (Million) Forecast, by Application 2019 & 2032
- Table 40: Japan Oral Transmucosal Drugs Market Volume (K Unit) Forecast, by Application 2019 & 2032
- Table 41: India Oral Transmucosal Drugs Market Revenue (Million) Forecast, by Application 2019 & 2032
- Table 42: India Oral Transmucosal Drugs Market Volume (K Unit) Forecast, by Application 2019 & 2032
- Table 43: Australia Oral Transmucosal Drugs Market Revenue (Million) Forecast, by Application 2019 & 2032
- Table 44: Australia Oral Transmucosal Drugs Market Volume (K Unit) Forecast, by Application 2019 & 2032
- Table 45: South Korea Oral Transmucosal Drugs Market Revenue (Million) Forecast, by Application 2019 & 2032
- Table 46: South Korea Oral Transmucosal Drugs Market Volume (K Unit) Forecast, by Application 2019 & 2032
- Table 47: Rest of Asia Pacific Oral Transmucosal Drugs Market Revenue (Million) Forecast, by Application 2019 & 2032
- Table 48: Rest of Asia Pacific Oral Transmucosal Drugs Market Volume (K Unit) Forecast, by Application 2019 & 2032
- Table 49: Global Oral Transmucosal Drugs Market Revenue Million Forecast, by Country 2019 & 2032
- Table 50: Global Oral Transmucosal Drugs Market Volume K Unit Forecast, by Country 2019 & 2032
- Table 51: GCC Oral Transmucosal Drugs Market Revenue (Million) Forecast, by Application 2019 & 2032
- Table 52: GCC Oral Transmucosal Drugs Market Volume (K Unit) Forecast, by Application 2019 & 2032
- Table 53: South Africa Oral Transmucosal Drugs Market Revenue (Million) Forecast, by Application 2019 & 2032
- Table 54: South Africa Oral Transmucosal Drugs Market Volume (K Unit) Forecast, by Application 2019 & 2032
- Table 55: Rest of Middle East and Africa Oral Transmucosal Drugs Market Revenue (Million) Forecast, by Application 2019 & 2032
- Table 56: Rest of Middle East and Africa Oral Transmucosal Drugs Market Volume (K Unit) Forecast, by Application 2019 & 2032
- Table 57: Global Oral Transmucosal Drugs Market Revenue Million Forecast, by Country 2019 & 2032
- Table 58: Global Oral Transmucosal Drugs Market Volume K Unit Forecast, by Country 2019 & 2032
- Table 59: Brazil Oral Transmucosal Drugs Market Revenue (Million) Forecast, by Application 2019 & 2032
- Table 60: Brazil Oral Transmucosal Drugs Market Volume (K Unit) Forecast, by Application 2019 & 2032
- Table 61: Argentina Oral Transmucosal Drugs Market Revenue (Million) Forecast, by Application 2019 & 2032
- Table 62: Argentina Oral Transmucosal Drugs Market Volume (K Unit) Forecast, by Application 2019 & 2032
- Table 63: Rest of South America Oral Transmucosal Drugs Market Revenue (Million) Forecast, by Application 2019 & 2032
- Table 64: Rest of South America Oral Transmucosal Drugs Market Volume (K Unit) Forecast, by Application 2019 & 2032
- Table 65: Global Oral Transmucosal Drugs Market Revenue Million Forecast, by Product Type 2019 & 2032
- Table 66: Global Oral Transmucosal Drugs Market Volume K Unit Forecast, by Product Type 2019 & 2032
- Table 67: Global Oral Transmucosal Drugs Market Revenue Million Forecast, by Route of Administration 2019 & 2032
- Table 68: Global Oral Transmucosal Drugs Market Volume K Unit Forecast, by Route of Administration 2019 & 2032
- Table 69: Global Oral Transmucosal Drugs Market Revenue Million Forecast, by Indication 2019 & 2032
- Table 70: Global Oral Transmucosal Drugs Market Volume K Unit Forecast, by Indication 2019 & 2032
- Table 71: Global Oral Transmucosal Drugs Market Revenue Million Forecast, by Distribution Channel 2019 & 2032
- Table 72: Global Oral Transmucosal Drugs Market Volume K Unit Forecast, by Distribution Channel 2019 & 2032
- Table 73: Global Oral Transmucosal Drugs Market Revenue Million Forecast, by Country 2019 & 2032
- Table 74: Global Oral Transmucosal Drugs Market Volume K Unit Forecast, by Country 2019 & 2032
- Table 75: United States Oral Transmucosal Drugs Market Revenue (Million) Forecast, by Application 2019 & 2032
- Table 76: United States Oral Transmucosal Drugs Market Volume (K Unit) Forecast, by Application 2019 & 2032
- Table 77: Canada Oral Transmucosal Drugs Market Revenue (Million) Forecast, by Application 2019 & 2032
- Table 78: Canada Oral Transmucosal Drugs Market Volume (K Unit) Forecast, by Application 2019 & 2032
- Table 79: Mexico Oral Transmucosal Drugs Market Revenue (Million) Forecast, by Application 2019 & 2032
- Table 80: Mexico Oral Transmucosal Drugs Market Volume (K Unit) Forecast, by Application 2019 & 2032
- Table 81: Global Oral Transmucosal Drugs Market Revenue Million Forecast, by Product Type 2019 & 2032
- Table 82: Global Oral Transmucosal Drugs Market Volume K Unit Forecast, by Product Type 2019 & 2032
- Table 83: Global Oral Transmucosal Drugs Market Revenue Million Forecast, by Route of Administration 2019 & 2032
- Table 84: Global Oral Transmucosal Drugs Market Volume K Unit Forecast, by Route of Administration 2019 & 2032
- Table 85: Global Oral Transmucosal Drugs Market Revenue Million Forecast, by Indication 2019 & 2032
- Table 86: Global Oral Transmucosal Drugs Market Volume K Unit Forecast, by Indication 2019 & 2032
- Table 87: Global Oral Transmucosal Drugs Market Revenue Million Forecast, by Distribution Channel 2019 & 2032
- Table 88: Global Oral Transmucosal Drugs Market Volume K Unit Forecast, by Distribution Channel 2019 & 2032
- Table 89: Global Oral Transmucosal Drugs Market Revenue Million Forecast, by Country 2019 & 2032
- Table 90: Global Oral Transmucosal Drugs Market Volume K Unit Forecast, by Country 2019 & 2032
- Table 91: Germany Oral Transmucosal Drugs Market Revenue (Million) Forecast, by Application 2019 & 2032
- Table 92: Germany Oral Transmucosal Drugs Market Volume (K Unit) Forecast, by Application 2019 & 2032
- Table 93: United Kingdom Oral Transmucosal Drugs Market Revenue (Million) Forecast, by Application 2019 & 2032
- Table 94: United Kingdom Oral Transmucosal Drugs Market Volume (K Unit) Forecast, by Application 2019 & 2032
- Table 95: France Oral Transmucosal Drugs Market Revenue (Million) Forecast, by Application 2019 & 2032
- Table 96: France Oral Transmucosal Drugs Market Volume (K Unit) Forecast, by Application 2019 & 2032
- Table 97: Italy Oral Transmucosal Drugs Market Revenue (Million) Forecast, by Application 2019 & 2032
- Table 98: Italy Oral Transmucosal Drugs Market Volume (K Unit) Forecast, by Application 2019 & 2032
- Table 99: Spain Oral Transmucosal Drugs Market Revenue (Million) Forecast, by Application 2019 & 2032
- Table 100: Spain Oral Transmucosal Drugs Market Volume (K Unit) Forecast, by Application 2019 & 2032
- Table 101: Rest of Europe Oral Transmucosal Drugs Market Revenue (Million) Forecast, by Application 2019 & 2032
- Table 102: Rest of Europe Oral Transmucosal Drugs Market Volume (K Unit) Forecast, by Application 2019 & 2032
- Table 103: Global Oral Transmucosal Drugs Market Revenue Million Forecast, by Product Type 2019 & 2032
- Table 104: Global Oral Transmucosal Drugs Market Volume K Unit Forecast, by Product Type 2019 & 2032
- Table 105: Global Oral Transmucosal Drugs Market Revenue Million Forecast, by Route of Administration 2019 & 2032
- Table 106: Global Oral Transmucosal Drugs Market Volume K Unit Forecast, by Route of Administration 2019 & 2032
- Table 107: Global Oral Transmucosal Drugs Market Revenue Million Forecast, by Indication 2019 & 2032
- Table 108: Global Oral Transmucosal Drugs Market Volume K Unit Forecast, by Indication 2019 & 2032
- Table 109: Global Oral Transmucosal Drugs Market Revenue Million Forecast, by Distribution Channel 2019 & 2032
- Table 110: Global Oral Transmucosal Drugs Market Volume K Unit Forecast, by Distribution Channel 2019 & 2032
- Table 111: Global Oral Transmucosal Drugs Market Revenue Million Forecast, by Country 2019 & 2032
- Table 112: Global Oral Transmucosal Drugs Market Volume K Unit Forecast, by Country 2019 & 2032
- Table 113: China Oral Transmucosal Drugs Market Revenue (Million) Forecast, by Application 2019 & 2032
- Table 114: China Oral Transmucosal Drugs Market Volume (K Unit) Forecast, by Application 2019 & 2032
- Table 115: Japan Oral Transmucosal Drugs Market Revenue (Million) Forecast, by Application 2019 & 2032
- Table 116: Japan Oral Transmucosal Drugs Market Volume (K Unit) Forecast, by Application 2019 & 2032
- Table 117: India Oral Transmucosal Drugs Market Revenue (Million) Forecast, by Application 2019 & 2032
- Table 118: India Oral Transmucosal Drugs Market Volume (K Unit) Forecast, by Application 2019 & 2032
- Table 119: Australia Oral Transmucosal Drugs Market Revenue (Million) Forecast, by Application 2019 & 2032
- Table 120: Australia Oral Transmucosal Drugs Market Volume (K Unit) Forecast, by Application 2019 & 2032
- Table 121: South Korea Oral Transmucosal Drugs Market Revenue (Million) Forecast, by Application 2019 & 2032
- Table 122: South Korea Oral Transmucosal Drugs Market Volume (K Unit) Forecast, by Application 2019 & 2032
- Table 123: Rest of Asia Pacific Oral Transmucosal Drugs Market Revenue (Million) Forecast, by Application 2019 & 2032
- Table 124: Rest of Asia Pacific Oral Transmucosal Drugs Market Volume (K Unit) Forecast, by Application 2019 & 2032
- Table 125: Global Oral Transmucosal Drugs Market Revenue Million Forecast, by Product Type 2019 & 2032
- Table 126: Global Oral Transmucosal Drugs Market Volume K Unit Forecast, by Product Type 2019 & 2032
- Table 127: Global Oral Transmucosal Drugs Market Revenue Million Forecast, by Route of Administration 2019 & 2032
- Table 128: Global Oral Transmucosal Drugs Market Volume K Unit Forecast, by Route of Administration 2019 & 2032
- Table 129: Global Oral Transmucosal Drugs Market Revenue Million Forecast, by Indication 2019 & 2032
- Table 130: Global Oral Transmucosal Drugs Market Volume K Unit Forecast, by Indication 2019 & 2032
- Table 131: Global Oral Transmucosal Drugs Market Revenue Million Forecast, by Distribution Channel 2019 & 2032
- Table 132: Global Oral Transmucosal Drugs Market Volume K Unit Forecast, by Distribution Channel 2019 & 2032
- Table 133: Global Oral Transmucosal Drugs Market Revenue Million Forecast, by Country 2019 & 2032
- Table 134: Global Oral Transmucosal Drugs Market Volume K Unit Forecast, by Country 2019 & 2032
- Table 135: GCC Oral Transmucosal Drugs Market Revenue (Million) Forecast, by Application 2019 & 2032
- Table 136: GCC Oral Transmucosal Drugs Market Volume (K Unit) Forecast, by Application 2019 & 2032
- Table 137: South Africa Oral Transmucosal Drugs Market Revenue (Million) Forecast, by Application 2019 & 2032
- Table 138: South Africa Oral Transmucosal Drugs Market Volume (K Unit) Forecast, by Application 2019 & 2032
- Table 139: Rest of Middle East and Africa Oral Transmucosal Drugs Market Revenue (Million) Forecast, by Application 2019 & 2032
- Table 140: Rest of Middle East and Africa Oral Transmucosal Drugs Market Volume (K Unit) Forecast, by Application 2019 & 2032
- Table 141: Global Oral Transmucosal Drugs Market Revenue Million Forecast, by Product Type 2019 & 2032
- Table 142: Global Oral Transmucosal Drugs Market Volume K Unit Forecast, by Product Type 2019 & 2032
- Table 143: Global Oral Transmucosal Drugs Market Revenue Million Forecast, by Route of Administration 2019 & 2032
- Table 144: Global Oral Transmucosal Drugs Market Volume K Unit Forecast, by Route of Administration 2019 & 2032
- Table 145: Global Oral Transmucosal Drugs Market Revenue Million Forecast, by Indication 2019 & 2032
- Table 146: Global Oral Transmucosal Drugs Market Volume K Unit Forecast, by Indication 2019 & 2032
- Table 147: Global Oral Transmucosal Drugs Market Revenue Million Forecast, by Distribution Channel 2019 & 2032
- Table 148: Global Oral Transmucosal Drugs Market Volume K Unit Forecast, by Distribution Channel 2019 & 2032
- Table 149: Global Oral Transmucosal Drugs Market Revenue Million Forecast, by Country 2019 & 2032
- Table 150: Global Oral Transmucosal Drugs Market Volume K Unit Forecast, by Country 2019 & 2032
- Table 151: Brazil Oral Transmucosal Drugs Market Revenue (Million) Forecast, by Application 2019 & 2032
- Table 152: Brazil Oral Transmucosal Drugs Market Volume (K Unit) Forecast, by Application 2019 & 2032
- Table 153: Argentina Oral Transmucosal Drugs Market Revenue (Million) Forecast, by Application 2019 & 2032
- Table 154: Argentina Oral Transmucosal Drugs Market Volume (K Unit) Forecast, by Application 2019 & 2032
- Table 155: Rest of South America Oral Transmucosal Drugs Market Revenue (Million) Forecast, by Application 2019 & 2032
- Table 156: Rest of South America Oral Transmucosal Drugs Market Volume (K Unit) Forecast, by Application 2019 & 2032
Frequently Asked Questions
1. What is the projected Compound Annual Growth Rate (CAGR) of the Oral Transmucosal Drugs Market?
The projected CAGR is approximately 7.40%.
2. Which companies are prominent players in the Oral Transmucosal Drugs Market?
Key companies in the market include Sunovion Pharmaceuticals Inc, Seoul Pharmaceuticals, Shilpa Therapeutics, Novartis AG, Aquestive Therapeutics Inc, ZIM Laboratories Limited, GW Pharmaceuticals plc , C L Pharm Co Ltd, IntelGenx Corp, Pfizer Inc.
3. What are the main segments of the Oral Transmucosal Drugs Market?
The market segments include Product Type, Route of Administration, Indication, Distribution Channel.
4. Can you provide details about the market size?
The market size is estimated to be USD XX Million as of 2022.
5. What are some drivers contributing to market growth?
Growing Burden of Target Diseases; Rise in R&D Activities and Product Launches.
6. What are the notable trends driving market growth?
Tablets segment is Expected to Hold a Significant Share Over the Forecast Period.
7. Are there any restraints impacting market growth?
Disadvantages Associated With Oral Transmucosal Drug Delivery.
8. Can you provide examples of recent developments in the market?
In September 2021, IntelGenx Corp. launched RIZAPORT in Spain. Exeltis Healthcare S.L. is a commercialization partner of IntelGenx Corp. in the European Union for RIZAPORT. It is an oral film formulation of rizatriptan benzoate.
9. What pricing options are available for accessing the report?
Pricing options include single-user, multi-user, and enterprise licenses priced at USD 4750, USD 5250, and USD 8750 respectively.
10. Is the market size provided in terms of value or volume?
The market size is provided in terms of value, measured in Million and volume, measured in K Unit.
11. Are there any specific market keywords associated with the report?
Yes, the market keyword associated with the report is "Oral Transmucosal Drugs Market," which aids in identifying and referencing the specific market segment covered.
12. How do I determine which pricing option suits my needs best?
The pricing options vary based on user requirements and access needs. Individual users may opt for single-user licenses, while businesses requiring broader access may choose multi-user or enterprise licenses for cost-effective access to the report.
13. Are there any additional resources or data provided in the Oral Transmucosal Drugs Market report?
While the report offers comprehensive insights, it's advisable to review the specific contents or supplementary materials provided to ascertain if additional resources or data are available.
14. How can I stay updated on further developments or reports in the Oral Transmucosal Drugs Market?
To stay informed about further developments, trends, and reports in the Oral Transmucosal Drugs Market, consider subscribing to industry newsletters, following relevant companies and organizations, or regularly checking reputable industry news sources and publications.
Methodology
Step 1 - Identification of Relevant Samples Size from Population Database


Step 2 - Approaches for Defining Global Market Size (Value, Volume* & Price*)

Note*: In applicable scenarios
Step 3 - Data Sources
Primary Research
- Web Analytics
- Survey Reports
- Research Institute
- Latest Research Reports
- Opinion Leaders
Secondary Research
- Annual Reports
- White Paper
- Latest Press Release
- Industry Association
- Paid Database
- Investor Presentations

Step 4 - Data Triangulation
Involves using different sources of information in order to increase the validity of a study
These sources are likely to be stakeholders in a program - participants, other researchers, program staff, other community members, and so on.
Then we put all data in single framework & apply various statistical tools to find out the dynamic on the market.
During the analysis stage, feedback from the stakeholder groups would be compared to determine areas of agreement as well as areas of divergence


