
Key Insights
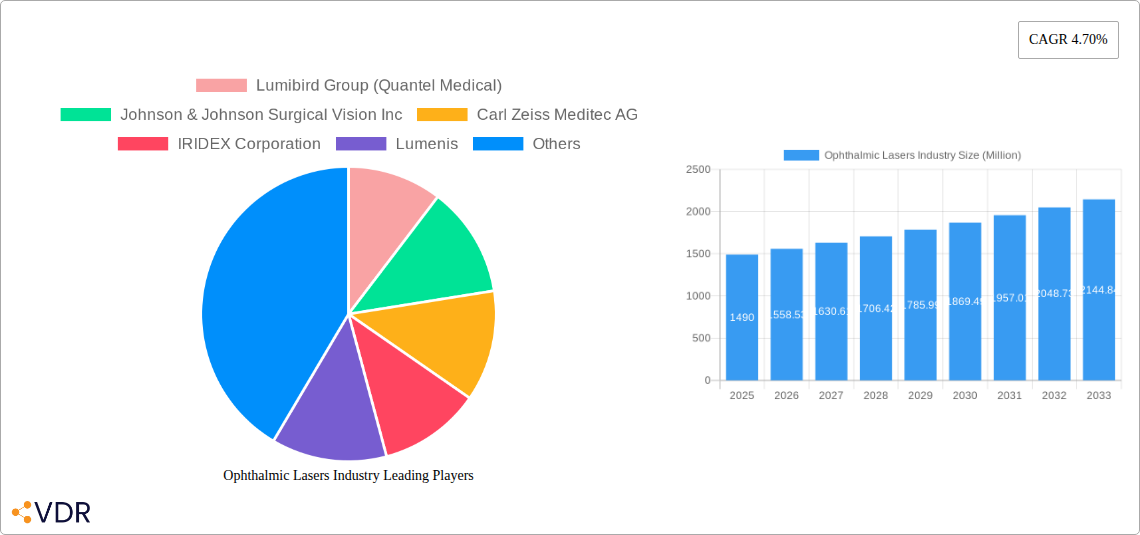
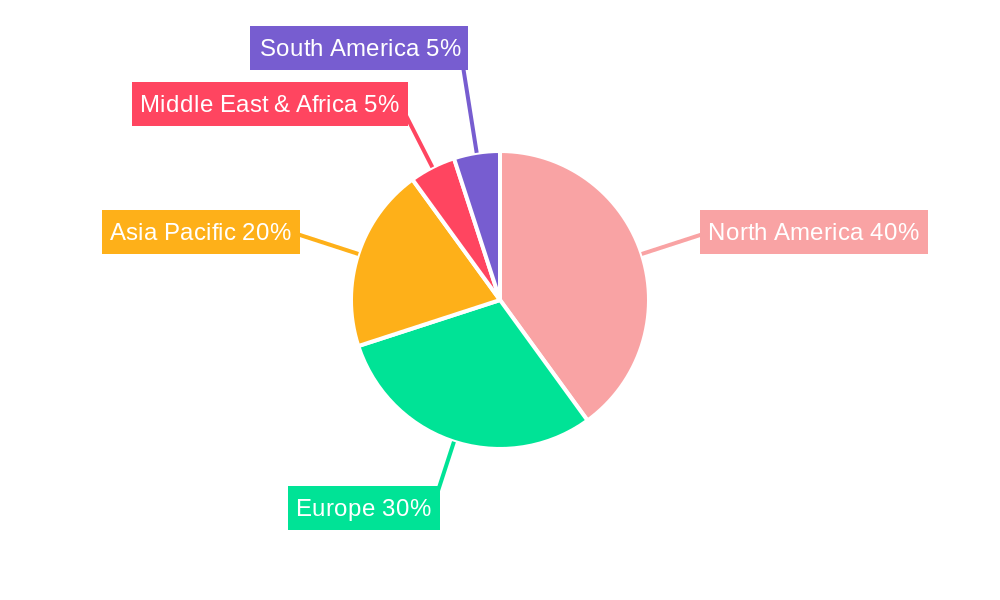
The ophthalmic lasers market, valued at $1.49 billion in 2025, is projected to experience robust growth, driven by a rising prevalence of age-related eye diseases like cataracts and glaucoma, coupled with an increasing demand for minimally invasive procedures and technologically advanced refractive error correction techniques. The market's Compound Annual Growth Rate (CAGR) of 4.70% from 2025 to 2033 indicates a steady expansion, fueled by advancements in laser technology, such as the development of more precise and efficient femtosecond and diode lasers. This allows for improved surgical outcomes, shorter recovery times, and enhanced patient satisfaction, further driving market adoption. The segmental analysis reveals that diode lasers currently hold a significant market share due to their versatility and cost-effectiveness across various applications. However, the femtosecond laser segment is poised for significant growth owing to its superior precision in procedures like cataract surgery and refractive corrections. Geographically, North America and Europe currently dominate the market due to high healthcare expenditure and technological advancements. However, the Asia-Pacific region is expected to witness substantial growth in the coming years, driven by rising disposable incomes, improving healthcare infrastructure, and a growing geriatric population. The presence of established players like Johnson & Johnson, Zeiss, and Alcon, alongside innovative companies like Lumenis and SCHWIND, ensures a competitive landscape fostering continuous innovation and technological advancements.
Market restraints include the high cost of advanced laser systems, potential side effects associated with certain procedures, and the stringent regulatory requirements for medical devices. However, these challenges are being progressively addressed through technological advancements that lead to cost reductions and improved safety profiles. The market's future growth will significantly depend on factors such as the continued development of less-invasive surgical techniques, increasing awareness among the general population regarding eye health, and favorable government regulations promoting the adoption of advanced ophthalmic laser systems. The expanding applications of ophthalmic lasers in areas like diabetic retinopathy treatment further contribute to the overall market expansion. The integration of advanced imaging techniques and AI-powered diagnostic tools alongside laser systems also promises significant advancements in precision and efficiency, potentially boosting market growth further.
Ophthalmic Lasers Industry Market Report: 2019-2033
This comprehensive report provides an in-depth analysis of the Ophthalmic Lasers market, encompassing market dynamics, growth trends, regional insights, product landscape, and key players. The study period covers 2019-2033, with 2025 as the base and estimated year. The forecast period is 2025-2033, and the historical period is 2019-2024. The report segments the market by product (Diode Lasers, Femtosecond Lasers, Excimer Lasers, Nd:YAG Lasers, Other Products), application (Glaucoma, Cataract Removal, Refractive Error Corrections, Diabetic Retinopathy, Other Applications), and end-user (Hospitals, Eye Clinics, Other End Users). The market size is valued in million units.
Ophthalmic Lasers Industry Market Dynamics & Structure
The ophthalmic lasers market is characterized by a moderately concentrated structure with several major players holding significant market share. Technological innovation, particularly in areas like femtosecond lasers and micro-pulse technology, is a key driver. Stringent regulatory frameworks governing medical devices influence market entry and product approvals. Competitive pressures from substitute technologies and ongoing mergers and acquisitions (M&A) activities further shape the market landscape. The aging global population and rising prevalence of eye diseases are fueling market growth. However, high initial investment costs and procedural complexities pose barriers to entry for smaller players.
- Market Concentration: The top 5 players account for approximately xx% of the global market share in 2025.
- Technological Innovation: Advancements in laser technology, such as improved precision and reduced side effects, are driving market growth.
- Regulatory Landscape: Stringent regulatory approvals (e.g., FDA, CE mark) increase the cost and time to market for new products.
- M&A Activity: Consolidation through mergers and acquisitions is expected to continue, leading to further market concentration. An estimated xx M&A deals occurred between 2019-2024.
- End-User Demographics: The aging population and increased prevalence of vision disorders are key demographic drivers.
Ophthalmic Lasers Industry Growth Trends & Insights
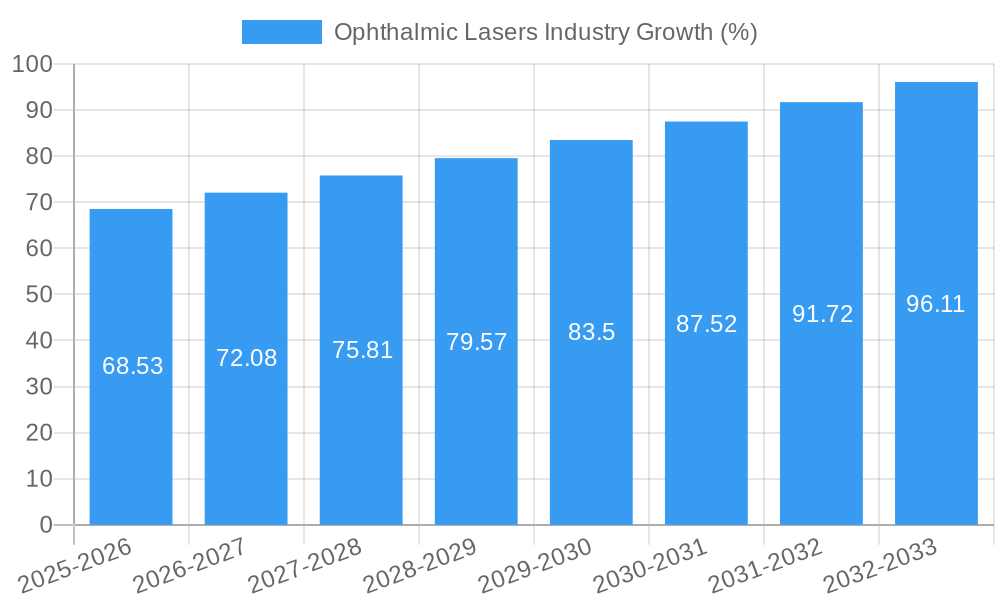
The ophthalmic lasers market is experiencing robust growth, driven by increasing demand for minimally invasive procedures, technological advancements, and rising healthcare expenditure. The market size is projected to reach xx million units by 2033, exhibiting a CAGR of xx% during the forecast period. Increased adoption rates, particularly in developing economies, contribute significantly to this growth. Technological disruptions, such as the introduction of more precise and versatile laser systems, are further accelerating market expansion. Consumer preference shifts towards advanced, less-invasive procedures are also impacting the market positively. Market penetration in underserved regions presents significant opportunities.
Dominant Regions, Countries, or Segments in Ophthalmic Lasers Industry
North America currently holds the largest market share, followed by Europe and Asia-Pacific. However, Asia-Pacific is expected to witness the highest growth rate due to rising disposable incomes, improving healthcare infrastructure, and increasing prevalence of eye diseases. Within product segments, Nd:YAG lasers currently dominate due to their widespread use in cataract surgery and other procedures. However, the femtosecond laser segment is experiencing the fastest growth, driven by its superior precision and reduced complications. In applications, cataract removal and refractive error corrections are the leading segments. Hospitals constitute the largest end-user segment due to their higher capacity for complex procedures.
- Key Drivers: Increasing healthcare expenditure, rising prevalence of age-related eye diseases, and technological advancements.
- Dominant Regions: North America (xx% market share in 2025), followed by Europe and Asia-Pacific.
- Fastest Growing Segment: Femtosecond Lasers, due to its precision and versatility.
- Largest Application Segment: Cataract Removal.
Ophthalmic Lasers Industry Product Landscape
The ophthalmic lasers market features a diverse range of products, including diode lasers, femtosecond lasers, excimer lasers, and Nd:YAG lasers. Recent innovations focus on enhanced precision, reduced side effects, and improved ease of use. These advancements involve the integration of advanced imaging technologies and software, enabling more accurate and efficient treatments. Unique selling propositions include minimally invasive procedures, faster recovery times, and improved patient outcomes.
Key Drivers, Barriers & Challenges in Ophthalmic Lasers Industry
Key Drivers:
- Technological advancements leading to better precision and reduced invasiveness.
- Rising prevalence of age-related eye diseases.
- Increasing healthcare expenditure.
Challenges:
- High initial investment costs for advanced laser systems limiting accessibility.
- Stringent regulatory approvals slowing down market entry.
- Intense competition among established players impacting pricing.
Emerging Opportunities in Ophthalmic Lasers Industry
- Expanding into untapped markets in developing countries.
- Development of innovative applications for treating new eye conditions.
- Personalized treatment approaches tailoring laser procedures to individual patient needs.
Growth Accelerators in the Ophthalmic Lasers Industry
Technological breakthroughs, strategic partnerships to expand market access, and a focus on developing innovative applications are major growth catalysts. Furthermore, expansion into emerging markets and improved affordability of advanced laser systems will play a critical role.
Key Players Shaping the Ophthalmic Lasers Industry Market
- Lumibird Group (Quantel Medical)
- Johnson & Johnson Surgical Vision Inc
- Carl Zeiss Meditec AG
- IRIDEX Corporation
- Lumenis
- SCHWIND eye-tech-solutions
- Ziemer Opthalmic Systems AG
- Novartis AG (Alcon Laboratories Inc)
- Topcon Corporation
- Bausch Health Companies Inc (Bausch & Lomb Incorporated )
- LIGHTMED
- NIDEK Co Ltd
Notable Milestones in Ophthalmic Lasers Industry Sector
- June 2022: Iridex Corporation receives regulatory clearance in China for its Cyclo G6 glaucoma treatment platform.
- April 2022: Lumibird Group launches the Capsulo Nd:YAG laser for capsulotomy and iridotomy.
In-Depth Ophthalmic Lasers Industry Market Outlook
The ophthalmic lasers market is poised for continued growth, fueled by technological advancements, expanding applications, and rising healthcare spending. Strategic partnerships and expansion into new markets offer significant opportunities for market players. Continued innovation in areas such as femtosecond lasers and micro-pulse technology will be crucial for maintaining market competitiveness and driving long-term growth.
Ophthalmic Lasers Industry Segmentation
-
1. Product
- 1.1. Diode Lasers
- 1.2. Femtosecond Lasers
- 1.3. Excimer Lasers
- 1.4. Nd:YAG Lasers
- 1.5. Other Products
-
2. Application
- 2.1. Glaucoma
- 2.2. Cataract Removal
- 2.3. Refractive Error Corrections
- 2.4. Diabetic Retinopathy
- 2.5. Other Applications
-
3. End User
- 3.1. Hospitals
- 3.2. Eye Clinics
- 3.3. Other End Users
Ophthalmic Lasers Industry Segmentation By Geography
-
1. North America
- 1.1. United States
- 1.2. Canada
- 1.3. Mexico
-
2. Europe
- 2.1. Germany
- 2.2. United Kingdom
- 2.3. France
- 2.4. Italy
- 2.5. Spain
- 2.6. Rest of Europe
-
3. Asia Pacific
- 3.1. China
- 3.2. Japan
- 3.3. India
- 3.4. Australia
- 3.5. South Korea
- 3.6. Rest of Asia Pacific
-
4. Middle East and Africa
- 4.1. GCC
- 4.2. South Africa
- 4.3. Rest of Middle East and Africa
-
5. South America
- 5.1. Brazil
- 5.2. Argentina
- 5.3. Rest of South America
Ophthalmic Lasers Industry REPORT HIGHLIGHTS
| Aspects | Details |
|---|---|
| Study Period | 2019-2033 |
| Base Year | 2024 |
| Estimated Year | 2025 |
| Forecast Period | 2025-2033 |
| Historical Period | 2019-2024 |
| Growth Rate | CAGR of 4.70% from 2019-2033 |
| Segmentation |
|
Table of Contents
- 1. Introduction
- 1.1. Research Scope
- 1.2. Market Segmentation
- 1.3. Research Methodology
- 1.4. Definitions and Assumptions
- 2. Executive Summary
- 2.1. Introduction
- 3. Market Dynamics
- 3.1. Introduction
- 3.2. Market Drivers
- 3.2.1. High Prevalence of Ophthalmic Disorders; Increasing Regulatory Approvals for Ophthalmic Lasers; Increasing Initiatives to Control Visual Impairments
- 3.3. Market Restrains
- 3.3.1. Huge Cost Associated with Ophthalmic Laser Therapies; Reduced Availability of Skilled Practitioners
- 3.4. Market Trends
- 3.4.1. Refractive Error Corrections Segment is Expected to Hold a Significant Market Share in the Ophthalmic Lasers Market
- 4. Market Factor Analysis
- 4.1. Porters Five Forces
- 4.2. Supply/Value Chain
- 4.3. PESTEL analysis
- 4.4. Market Entropy
- 4.5. Patent/Trademark Analysis
- 5. Global Ophthalmic Lasers Industry Analysis, Insights and Forecast, 2019-2031
- 5.1. Market Analysis, Insights and Forecast - by Product
- 5.1.1. Diode Lasers
- 5.1.2. Femtosecond Lasers
- 5.1.3. Excimer Lasers
- 5.1.4. Nd:YAG Lasers
- 5.1.5. Other Products
- 5.2. Market Analysis, Insights and Forecast - by Application
- 5.2.1. Glaucoma
- 5.2.2. Cataract Removal
- 5.2.3. Refractive Error Corrections
- 5.2.4. Diabetic Retinopathy
- 5.2.5. Other Applications
- 5.3. Market Analysis, Insights and Forecast - by End User
- 5.3.1. Hospitals
- 5.3.2. Eye Clinics
- 5.3.3. Other End Users
- 5.4. Market Analysis, Insights and Forecast - by Region
- 5.4.1. North America
- 5.4.2. Europe
- 5.4.3. Asia Pacific
- 5.4.4. Middle East and Africa
- 5.4.5. South America
- 5.1. Market Analysis, Insights and Forecast - by Product
- 6. North America Ophthalmic Lasers Industry Analysis, Insights and Forecast, 2019-2031
- 6.1. Market Analysis, Insights and Forecast - by Product
- 6.1.1. Diode Lasers
- 6.1.2. Femtosecond Lasers
- 6.1.3. Excimer Lasers
- 6.1.4. Nd:YAG Lasers
- 6.1.5. Other Products
- 6.2. Market Analysis, Insights and Forecast - by Application
- 6.2.1. Glaucoma
- 6.2.2. Cataract Removal
- 6.2.3. Refractive Error Corrections
- 6.2.4. Diabetic Retinopathy
- 6.2.5. Other Applications
- 6.3. Market Analysis, Insights and Forecast - by End User
- 6.3.1. Hospitals
- 6.3.2. Eye Clinics
- 6.3.3. Other End Users
- 6.1. Market Analysis, Insights and Forecast - by Product
- 7. Europe Ophthalmic Lasers Industry Analysis, Insights and Forecast, 2019-2031
- 7.1. Market Analysis, Insights and Forecast - by Product
- 7.1.1. Diode Lasers
- 7.1.2. Femtosecond Lasers
- 7.1.3. Excimer Lasers
- 7.1.4. Nd:YAG Lasers
- 7.1.5. Other Products
- 7.2. Market Analysis, Insights and Forecast - by Application
- 7.2.1. Glaucoma
- 7.2.2. Cataract Removal
- 7.2.3. Refractive Error Corrections
- 7.2.4. Diabetic Retinopathy
- 7.2.5. Other Applications
- 7.3. Market Analysis, Insights and Forecast - by End User
- 7.3.1. Hospitals
- 7.3.2. Eye Clinics
- 7.3.3. Other End Users
- 7.1. Market Analysis, Insights and Forecast - by Product
- 8. Asia Pacific Ophthalmic Lasers Industry Analysis, Insights and Forecast, 2019-2031
- 8.1. Market Analysis, Insights and Forecast - by Product
- 8.1.1. Diode Lasers
- 8.1.2. Femtosecond Lasers
- 8.1.3. Excimer Lasers
- 8.1.4. Nd:YAG Lasers
- 8.1.5. Other Products
- 8.2. Market Analysis, Insights and Forecast - by Application
- 8.2.1. Glaucoma
- 8.2.2. Cataract Removal
- 8.2.3. Refractive Error Corrections
- 8.2.4. Diabetic Retinopathy
- 8.2.5. Other Applications
- 8.3. Market Analysis, Insights and Forecast - by End User
- 8.3.1. Hospitals
- 8.3.2. Eye Clinics
- 8.3.3. Other End Users
- 8.1. Market Analysis, Insights and Forecast - by Product
- 9. Middle East and Africa Ophthalmic Lasers Industry Analysis, Insights and Forecast, 2019-2031
- 9.1. Market Analysis, Insights and Forecast - by Product
- 9.1.1. Diode Lasers
- 9.1.2. Femtosecond Lasers
- 9.1.3. Excimer Lasers
- 9.1.4. Nd:YAG Lasers
- 9.1.5. Other Products
- 9.2. Market Analysis, Insights and Forecast - by Application
- 9.2.1. Glaucoma
- 9.2.2. Cataract Removal
- 9.2.3. Refractive Error Corrections
- 9.2.4. Diabetic Retinopathy
- 9.2.5. Other Applications
- 9.3. Market Analysis, Insights and Forecast - by End User
- 9.3.1. Hospitals
- 9.3.2. Eye Clinics
- 9.3.3. Other End Users
- 9.1. Market Analysis, Insights and Forecast - by Product
- 10. South America Ophthalmic Lasers Industry Analysis, Insights and Forecast, 2019-2031
- 10.1. Market Analysis, Insights and Forecast - by Product
- 10.1.1. Diode Lasers
- 10.1.2. Femtosecond Lasers
- 10.1.3. Excimer Lasers
- 10.1.4. Nd:YAG Lasers
- 10.1.5. Other Products
- 10.2. Market Analysis, Insights and Forecast - by Application
- 10.2.1. Glaucoma
- 10.2.2. Cataract Removal
- 10.2.3. Refractive Error Corrections
- 10.2.4. Diabetic Retinopathy
- 10.2.5. Other Applications
- 10.3. Market Analysis, Insights and Forecast - by End User
- 10.3.1. Hospitals
- 10.3.2. Eye Clinics
- 10.3.3. Other End Users
- 10.1. Market Analysis, Insights and Forecast - by Product
- 11. North America Ophthalmic Lasers Industry Analysis, Insights and Forecast, 2019-2031
- 11.1. Market Analysis, Insights and Forecast - By Country/Sub-region
- 11.1.1 United States
- 11.1.2 Canada
- 11.1.3 Mexico
- 12. Europe Ophthalmic Lasers Industry Analysis, Insights and Forecast, 2019-2031
- 12.1. Market Analysis, Insights and Forecast - By Country/Sub-region
- 12.1.1 Germany
- 12.1.2 United Kingdom
- 12.1.3 France
- 12.1.4 Italy
- 12.1.5 Spain
- 12.1.6 Rest of Europe
- 13. Asia Pacific Ophthalmic Lasers Industry Analysis, Insights and Forecast, 2019-2031
- 13.1. Market Analysis, Insights and Forecast - By Country/Sub-region
- 13.1.1 China
- 13.1.2 Japan
- 13.1.3 India
- 13.1.4 Australia
- 13.1.5 South Korea
- 13.1.6 Rest of Asia Pacific
- 14. Middle East and Africa Ophthalmic Lasers Industry Analysis, Insights and Forecast, 2019-2031
- 14.1. Market Analysis, Insights and Forecast - By Country/Sub-region
- 14.1.1 GCC
- 14.1.2 South Africa
- 14.1.3 Rest of Middle East and Africa
- 15. South America Ophthalmic Lasers Industry Analysis, Insights and Forecast, 2019-2031
- 15.1. Market Analysis, Insights and Forecast - By Country/Sub-region
- 15.1.1 Brazil
- 15.1.2 Argentina
- 15.1.3 Rest of South America
- 16. Competitive Analysis
- 16.1. Global Market Share Analysis 2024
- 16.2. Company Profiles
- 16.2.1 Lumibird Group (Quantel Medical)
- 16.2.1.1. Overview
- 16.2.1.2. Products
- 16.2.1.3. SWOT Analysis
- 16.2.1.4. Recent Developments
- 16.2.1.5. Financials (Based on Availability)
- 16.2.2 Johnson & Johnson Surgical Vision Inc
- 16.2.2.1. Overview
- 16.2.2.2. Products
- 16.2.2.3. SWOT Analysis
- 16.2.2.4. Recent Developments
- 16.2.2.5. Financials (Based on Availability)
- 16.2.3 Carl Zeiss Meditec AG
- 16.2.3.1. Overview
- 16.2.3.2. Products
- 16.2.3.3. SWOT Analysis
- 16.2.3.4. Recent Developments
- 16.2.3.5. Financials (Based on Availability)
- 16.2.4 IRIDEX Corporation
- 16.2.4.1. Overview
- 16.2.4.2. Products
- 16.2.4.3. SWOT Analysis
- 16.2.4.4. Recent Developments
- 16.2.4.5. Financials (Based on Availability)
- 16.2.5 Lumenis
- 16.2.5.1. Overview
- 16.2.5.2. Products
- 16.2.5.3. SWOT Analysis
- 16.2.5.4. Recent Developments
- 16.2.5.5. Financials (Based on Availability)
- 16.2.6 SCHWIND eye-tech-solutions
- 16.2.6.1. Overview
- 16.2.6.2. Products
- 16.2.6.3. SWOT Analysis
- 16.2.6.4. Recent Developments
- 16.2.6.5. Financials (Based on Availability)
- 16.2.7 Ziemer Opthalmic Systems AG
- 16.2.7.1. Overview
- 16.2.7.2. Products
- 16.2.7.3. SWOT Analysis
- 16.2.7.4. Recent Developments
- 16.2.7.5. Financials (Based on Availability)
- 16.2.8 Novartis AG (Alcon Laboratories Inc)
- 16.2.8.1. Overview
- 16.2.8.2. Products
- 16.2.8.3. SWOT Analysis
- 16.2.8.4. Recent Developments
- 16.2.8.5. Financials (Based on Availability)
- 16.2.9 Topcon Corporation
- 16.2.9.1. Overview
- 16.2.9.2. Products
- 16.2.9.3. SWOT Analysis
- 16.2.9.4. Recent Developments
- 16.2.9.5. Financials (Based on Availability)
- 16.2.10 Bausch Health Companies Inc (Bausch & Lomb Incorporated )
- 16.2.10.1. Overview
- 16.2.10.2. Products
- 16.2.10.3. SWOT Analysis
- 16.2.10.4. Recent Developments
- 16.2.10.5. Financials (Based on Availability)
- 16.2.11 LIGHTMED
- 16.2.11.1. Overview
- 16.2.11.2. Products
- 16.2.11.3. SWOT Analysis
- 16.2.11.4. Recent Developments
- 16.2.11.5. Financials (Based on Availability)
- 16.2.12 NIDEK Co Ltd
- 16.2.12.1. Overview
- 16.2.12.2. Products
- 16.2.12.3. SWOT Analysis
- 16.2.12.4. Recent Developments
- 16.2.12.5. Financials (Based on Availability)
- 16.2.1 Lumibird Group (Quantel Medical)
List of Figures
- Figure 1: Global Ophthalmic Lasers Industry Revenue Breakdown (Million, %) by Region 2024 & 2032
- Figure 2: Global Ophthalmic Lasers Industry Volume Breakdown (K Unit, %) by Region 2024 & 2032
- Figure 3: North America Ophthalmic Lasers Industry Revenue (Million), by Country 2024 & 2032
- Figure 4: North America Ophthalmic Lasers Industry Volume (K Unit), by Country 2024 & 2032
- Figure 5: North America Ophthalmic Lasers Industry Revenue Share (%), by Country 2024 & 2032
- Figure 6: North America Ophthalmic Lasers Industry Volume Share (%), by Country 2024 & 2032
- Figure 7: Europe Ophthalmic Lasers Industry Revenue (Million), by Country 2024 & 2032
- Figure 8: Europe Ophthalmic Lasers Industry Volume (K Unit), by Country 2024 & 2032
- Figure 9: Europe Ophthalmic Lasers Industry Revenue Share (%), by Country 2024 & 2032
- Figure 10: Europe Ophthalmic Lasers Industry Volume Share (%), by Country 2024 & 2032
- Figure 11: Asia Pacific Ophthalmic Lasers Industry Revenue (Million), by Country 2024 & 2032
- Figure 12: Asia Pacific Ophthalmic Lasers Industry Volume (K Unit), by Country 2024 & 2032
- Figure 13: Asia Pacific Ophthalmic Lasers Industry Revenue Share (%), by Country 2024 & 2032
- Figure 14: Asia Pacific Ophthalmic Lasers Industry Volume Share (%), by Country 2024 & 2032
- Figure 15: Middle East and Africa Ophthalmic Lasers Industry Revenue (Million), by Country 2024 & 2032
- Figure 16: Middle East and Africa Ophthalmic Lasers Industry Volume (K Unit), by Country 2024 & 2032
- Figure 17: Middle East and Africa Ophthalmic Lasers Industry Revenue Share (%), by Country 2024 & 2032
- Figure 18: Middle East and Africa Ophthalmic Lasers Industry Volume Share (%), by Country 2024 & 2032
- Figure 19: South America Ophthalmic Lasers Industry Revenue (Million), by Country 2024 & 2032
- Figure 20: South America Ophthalmic Lasers Industry Volume (K Unit), by Country 2024 & 2032
- Figure 21: South America Ophthalmic Lasers Industry Revenue Share (%), by Country 2024 & 2032
- Figure 22: South America Ophthalmic Lasers Industry Volume Share (%), by Country 2024 & 2032
- Figure 23: North America Ophthalmic Lasers Industry Revenue (Million), by Product 2024 & 2032
- Figure 24: North America Ophthalmic Lasers Industry Volume (K Unit), by Product 2024 & 2032
- Figure 25: North America Ophthalmic Lasers Industry Revenue Share (%), by Product 2024 & 2032
- Figure 26: North America Ophthalmic Lasers Industry Volume Share (%), by Product 2024 & 2032
- Figure 27: North America Ophthalmic Lasers Industry Revenue (Million), by Application 2024 & 2032
- Figure 28: North America Ophthalmic Lasers Industry Volume (K Unit), by Application 2024 & 2032
- Figure 29: North America Ophthalmic Lasers Industry Revenue Share (%), by Application 2024 & 2032
- Figure 30: North America Ophthalmic Lasers Industry Volume Share (%), by Application 2024 & 2032
- Figure 31: North America Ophthalmic Lasers Industry Revenue (Million), by End User 2024 & 2032
- Figure 32: North America Ophthalmic Lasers Industry Volume (K Unit), by End User 2024 & 2032
- Figure 33: North America Ophthalmic Lasers Industry Revenue Share (%), by End User 2024 & 2032
- Figure 34: North America Ophthalmic Lasers Industry Volume Share (%), by End User 2024 & 2032
- Figure 35: North America Ophthalmic Lasers Industry Revenue (Million), by Country 2024 & 2032
- Figure 36: North America Ophthalmic Lasers Industry Volume (K Unit), by Country 2024 & 2032
- Figure 37: North America Ophthalmic Lasers Industry Revenue Share (%), by Country 2024 & 2032
- Figure 38: North America Ophthalmic Lasers Industry Volume Share (%), by Country 2024 & 2032
- Figure 39: Europe Ophthalmic Lasers Industry Revenue (Million), by Product 2024 & 2032
- Figure 40: Europe Ophthalmic Lasers Industry Volume (K Unit), by Product 2024 & 2032
- Figure 41: Europe Ophthalmic Lasers Industry Revenue Share (%), by Product 2024 & 2032
- Figure 42: Europe Ophthalmic Lasers Industry Volume Share (%), by Product 2024 & 2032
- Figure 43: Europe Ophthalmic Lasers Industry Revenue (Million), by Application 2024 & 2032
- Figure 44: Europe Ophthalmic Lasers Industry Volume (K Unit), by Application 2024 & 2032
- Figure 45: Europe Ophthalmic Lasers Industry Revenue Share (%), by Application 2024 & 2032
- Figure 46: Europe Ophthalmic Lasers Industry Volume Share (%), by Application 2024 & 2032
- Figure 47: Europe Ophthalmic Lasers Industry Revenue (Million), by End User 2024 & 2032
- Figure 48: Europe Ophthalmic Lasers Industry Volume (K Unit), by End User 2024 & 2032
- Figure 49: Europe Ophthalmic Lasers Industry Revenue Share (%), by End User 2024 & 2032
- Figure 50: Europe Ophthalmic Lasers Industry Volume Share (%), by End User 2024 & 2032
- Figure 51: Europe Ophthalmic Lasers Industry Revenue (Million), by Country 2024 & 2032
- Figure 52: Europe Ophthalmic Lasers Industry Volume (K Unit), by Country 2024 & 2032
- Figure 53: Europe Ophthalmic Lasers Industry Revenue Share (%), by Country 2024 & 2032
- Figure 54: Europe Ophthalmic Lasers Industry Volume Share (%), by Country 2024 & 2032
- Figure 55: Asia Pacific Ophthalmic Lasers Industry Revenue (Million), by Product 2024 & 2032
- Figure 56: Asia Pacific Ophthalmic Lasers Industry Volume (K Unit), by Product 2024 & 2032
- Figure 57: Asia Pacific Ophthalmic Lasers Industry Revenue Share (%), by Product 2024 & 2032
- Figure 58: Asia Pacific Ophthalmic Lasers Industry Volume Share (%), by Product 2024 & 2032
- Figure 59: Asia Pacific Ophthalmic Lasers Industry Revenue (Million), by Application 2024 & 2032
- Figure 60: Asia Pacific Ophthalmic Lasers Industry Volume (K Unit), by Application 2024 & 2032
- Figure 61: Asia Pacific Ophthalmic Lasers Industry Revenue Share (%), by Application 2024 & 2032
- Figure 62: Asia Pacific Ophthalmic Lasers Industry Volume Share (%), by Application 2024 & 2032
- Figure 63: Asia Pacific Ophthalmic Lasers Industry Revenue (Million), by End User 2024 & 2032
- Figure 64: Asia Pacific Ophthalmic Lasers Industry Volume (K Unit), by End User 2024 & 2032
- Figure 65: Asia Pacific Ophthalmic Lasers Industry Revenue Share (%), by End User 2024 & 2032
- Figure 66: Asia Pacific Ophthalmic Lasers Industry Volume Share (%), by End User 2024 & 2032
- Figure 67: Asia Pacific Ophthalmic Lasers Industry Revenue (Million), by Country 2024 & 2032
- Figure 68: Asia Pacific Ophthalmic Lasers Industry Volume (K Unit), by Country 2024 & 2032
- Figure 69: Asia Pacific Ophthalmic Lasers Industry Revenue Share (%), by Country 2024 & 2032
- Figure 70: Asia Pacific Ophthalmic Lasers Industry Volume Share (%), by Country 2024 & 2032
- Figure 71: Middle East and Africa Ophthalmic Lasers Industry Revenue (Million), by Product 2024 & 2032
- Figure 72: Middle East and Africa Ophthalmic Lasers Industry Volume (K Unit), by Product 2024 & 2032
- Figure 73: Middle East and Africa Ophthalmic Lasers Industry Revenue Share (%), by Product 2024 & 2032
- Figure 74: Middle East and Africa Ophthalmic Lasers Industry Volume Share (%), by Product 2024 & 2032
- Figure 75: Middle East and Africa Ophthalmic Lasers Industry Revenue (Million), by Application 2024 & 2032
- Figure 76: Middle East and Africa Ophthalmic Lasers Industry Volume (K Unit), by Application 2024 & 2032
- Figure 77: Middle East and Africa Ophthalmic Lasers Industry Revenue Share (%), by Application 2024 & 2032
- Figure 78: Middle East and Africa Ophthalmic Lasers Industry Volume Share (%), by Application 2024 & 2032
- Figure 79: Middle East and Africa Ophthalmic Lasers Industry Revenue (Million), by End User 2024 & 2032
- Figure 80: Middle East and Africa Ophthalmic Lasers Industry Volume (K Unit), by End User 2024 & 2032
- Figure 81: Middle East and Africa Ophthalmic Lasers Industry Revenue Share (%), by End User 2024 & 2032
- Figure 82: Middle East and Africa Ophthalmic Lasers Industry Volume Share (%), by End User 2024 & 2032
- Figure 83: Middle East and Africa Ophthalmic Lasers Industry Revenue (Million), by Country 2024 & 2032
- Figure 84: Middle East and Africa Ophthalmic Lasers Industry Volume (K Unit), by Country 2024 & 2032
- Figure 85: Middle East and Africa Ophthalmic Lasers Industry Revenue Share (%), by Country 2024 & 2032
- Figure 86: Middle East and Africa Ophthalmic Lasers Industry Volume Share (%), by Country 2024 & 2032
- Figure 87: South America Ophthalmic Lasers Industry Revenue (Million), by Product 2024 & 2032
- Figure 88: South America Ophthalmic Lasers Industry Volume (K Unit), by Product 2024 & 2032
- Figure 89: South America Ophthalmic Lasers Industry Revenue Share (%), by Product 2024 & 2032
- Figure 90: South America Ophthalmic Lasers Industry Volume Share (%), by Product 2024 & 2032
- Figure 91: South America Ophthalmic Lasers Industry Revenue (Million), by Application 2024 & 2032
- Figure 92: South America Ophthalmic Lasers Industry Volume (K Unit), by Application 2024 & 2032
- Figure 93: South America Ophthalmic Lasers Industry Revenue Share (%), by Application 2024 & 2032
- Figure 94: South America Ophthalmic Lasers Industry Volume Share (%), by Application 2024 & 2032
- Figure 95: South America Ophthalmic Lasers Industry Revenue (Million), by End User 2024 & 2032
- Figure 96: South America Ophthalmic Lasers Industry Volume (K Unit), by End User 2024 & 2032
- Figure 97: South America Ophthalmic Lasers Industry Revenue Share (%), by End User 2024 & 2032
- Figure 98: South America Ophthalmic Lasers Industry Volume Share (%), by End User 2024 & 2032
- Figure 99: South America Ophthalmic Lasers Industry Revenue (Million), by Country 2024 & 2032
- Figure 100: South America Ophthalmic Lasers Industry Volume (K Unit), by Country 2024 & 2032
- Figure 101: South America Ophthalmic Lasers Industry Revenue Share (%), by Country 2024 & 2032
- Figure 102: South America Ophthalmic Lasers Industry Volume Share (%), by Country 2024 & 2032
List of Tables
- Table 1: Global Ophthalmic Lasers Industry Revenue Million Forecast, by Region 2019 & 2032
- Table 2: Global Ophthalmic Lasers Industry Volume K Unit Forecast, by Region 2019 & 2032
- Table 3: Global Ophthalmic Lasers Industry Revenue Million Forecast, by Product 2019 & 2032
- Table 4: Global Ophthalmic Lasers Industry Volume K Unit Forecast, by Product 2019 & 2032
- Table 5: Global Ophthalmic Lasers Industry Revenue Million Forecast, by Application 2019 & 2032
- Table 6: Global Ophthalmic Lasers Industry Volume K Unit Forecast, by Application 2019 & 2032
- Table 7: Global Ophthalmic Lasers Industry Revenue Million Forecast, by End User 2019 & 2032
- Table 8: Global Ophthalmic Lasers Industry Volume K Unit Forecast, by End User 2019 & 2032
- Table 9: Global Ophthalmic Lasers Industry Revenue Million Forecast, by Region 2019 & 2032
- Table 10: Global Ophthalmic Lasers Industry Volume K Unit Forecast, by Region 2019 & 2032
- Table 11: Global Ophthalmic Lasers Industry Revenue Million Forecast, by Country 2019 & 2032
- Table 12: Global Ophthalmic Lasers Industry Volume K Unit Forecast, by Country 2019 & 2032
- Table 13: United States Ophthalmic Lasers Industry Revenue (Million) Forecast, by Application 2019 & 2032
- Table 14: United States Ophthalmic Lasers Industry Volume (K Unit) Forecast, by Application 2019 & 2032
- Table 15: Canada Ophthalmic Lasers Industry Revenue (Million) Forecast, by Application 2019 & 2032
- Table 16: Canada Ophthalmic Lasers Industry Volume (K Unit) Forecast, by Application 2019 & 2032
- Table 17: Mexico Ophthalmic Lasers Industry Revenue (Million) Forecast, by Application 2019 & 2032
- Table 18: Mexico Ophthalmic Lasers Industry Volume (K Unit) Forecast, by Application 2019 & 2032
- Table 19: Global Ophthalmic Lasers Industry Revenue Million Forecast, by Country 2019 & 2032
- Table 20: Global Ophthalmic Lasers Industry Volume K Unit Forecast, by Country 2019 & 2032
- Table 21: Germany Ophthalmic Lasers Industry Revenue (Million) Forecast, by Application 2019 & 2032
- Table 22: Germany Ophthalmic Lasers Industry Volume (K Unit) Forecast, by Application 2019 & 2032
- Table 23: United Kingdom Ophthalmic Lasers Industry Revenue (Million) Forecast, by Application 2019 & 2032
- Table 24: United Kingdom Ophthalmic Lasers Industry Volume (K Unit) Forecast, by Application 2019 & 2032
- Table 25: France Ophthalmic Lasers Industry Revenue (Million) Forecast, by Application 2019 & 2032
- Table 26: France Ophthalmic Lasers Industry Volume (K Unit) Forecast, by Application 2019 & 2032
- Table 27: Italy Ophthalmic Lasers Industry Revenue (Million) Forecast, by Application 2019 & 2032
- Table 28: Italy Ophthalmic Lasers Industry Volume (K Unit) Forecast, by Application 2019 & 2032
- Table 29: Spain Ophthalmic Lasers Industry Revenue (Million) Forecast, by Application 2019 & 2032
- Table 30: Spain Ophthalmic Lasers Industry Volume (K Unit) Forecast, by Application 2019 & 2032
- Table 31: Rest of Europe Ophthalmic Lasers Industry Revenue (Million) Forecast, by Application 2019 & 2032
- Table 32: Rest of Europe Ophthalmic Lasers Industry Volume (K Unit) Forecast, by Application 2019 & 2032
- Table 33: Global Ophthalmic Lasers Industry Revenue Million Forecast, by Country 2019 & 2032
- Table 34: Global Ophthalmic Lasers Industry Volume K Unit Forecast, by Country 2019 & 2032
- Table 35: China Ophthalmic Lasers Industry Revenue (Million) Forecast, by Application 2019 & 2032
- Table 36: China Ophthalmic Lasers Industry Volume (K Unit) Forecast, by Application 2019 & 2032
- Table 37: Japan Ophthalmic Lasers Industry Revenue (Million) Forecast, by Application 2019 & 2032
- Table 38: Japan Ophthalmic Lasers Industry Volume (K Unit) Forecast, by Application 2019 & 2032
- Table 39: India Ophthalmic Lasers Industry Revenue (Million) Forecast, by Application 2019 & 2032
- Table 40: India Ophthalmic Lasers Industry Volume (K Unit) Forecast, by Application 2019 & 2032
- Table 41: Australia Ophthalmic Lasers Industry Revenue (Million) Forecast, by Application 2019 & 2032
- Table 42: Australia Ophthalmic Lasers Industry Volume (K Unit) Forecast, by Application 2019 & 2032
- Table 43: South Korea Ophthalmic Lasers Industry Revenue (Million) Forecast, by Application 2019 & 2032
- Table 44: South Korea Ophthalmic Lasers Industry Volume (K Unit) Forecast, by Application 2019 & 2032
- Table 45: Rest of Asia Pacific Ophthalmic Lasers Industry Revenue (Million) Forecast, by Application 2019 & 2032
- Table 46: Rest of Asia Pacific Ophthalmic Lasers Industry Volume (K Unit) Forecast, by Application 2019 & 2032
- Table 47: Global Ophthalmic Lasers Industry Revenue Million Forecast, by Country 2019 & 2032
- Table 48: Global Ophthalmic Lasers Industry Volume K Unit Forecast, by Country 2019 & 2032
- Table 49: GCC Ophthalmic Lasers Industry Revenue (Million) Forecast, by Application 2019 & 2032
- Table 50: GCC Ophthalmic Lasers Industry Volume (K Unit) Forecast, by Application 2019 & 2032
- Table 51: South Africa Ophthalmic Lasers Industry Revenue (Million) Forecast, by Application 2019 & 2032
- Table 52: South Africa Ophthalmic Lasers Industry Volume (K Unit) Forecast, by Application 2019 & 2032
- Table 53: Rest of Middle East and Africa Ophthalmic Lasers Industry Revenue (Million) Forecast, by Application 2019 & 2032
- Table 54: Rest of Middle East and Africa Ophthalmic Lasers Industry Volume (K Unit) Forecast, by Application 2019 & 2032
- Table 55: Global Ophthalmic Lasers Industry Revenue Million Forecast, by Country 2019 & 2032
- Table 56: Global Ophthalmic Lasers Industry Volume K Unit Forecast, by Country 2019 & 2032
- Table 57: Brazil Ophthalmic Lasers Industry Revenue (Million) Forecast, by Application 2019 & 2032
- Table 58: Brazil Ophthalmic Lasers Industry Volume (K Unit) Forecast, by Application 2019 & 2032
- Table 59: Argentina Ophthalmic Lasers Industry Revenue (Million) Forecast, by Application 2019 & 2032
- Table 60: Argentina Ophthalmic Lasers Industry Volume (K Unit) Forecast, by Application 2019 & 2032
- Table 61: Rest of South America Ophthalmic Lasers Industry Revenue (Million) Forecast, by Application 2019 & 2032
- Table 62: Rest of South America Ophthalmic Lasers Industry Volume (K Unit) Forecast, by Application 2019 & 2032
- Table 63: Global Ophthalmic Lasers Industry Revenue Million Forecast, by Product 2019 & 2032
- Table 64: Global Ophthalmic Lasers Industry Volume K Unit Forecast, by Product 2019 & 2032
- Table 65: Global Ophthalmic Lasers Industry Revenue Million Forecast, by Application 2019 & 2032
- Table 66: Global Ophthalmic Lasers Industry Volume K Unit Forecast, by Application 2019 & 2032
- Table 67: Global Ophthalmic Lasers Industry Revenue Million Forecast, by End User 2019 & 2032
- Table 68: Global Ophthalmic Lasers Industry Volume K Unit Forecast, by End User 2019 & 2032
- Table 69: Global Ophthalmic Lasers Industry Revenue Million Forecast, by Country 2019 & 2032
- Table 70: Global Ophthalmic Lasers Industry Volume K Unit Forecast, by Country 2019 & 2032
- Table 71: United States Ophthalmic Lasers Industry Revenue (Million) Forecast, by Application 2019 & 2032
- Table 72: United States Ophthalmic Lasers Industry Volume (K Unit) Forecast, by Application 2019 & 2032
- Table 73: Canada Ophthalmic Lasers Industry Revenue (Million) Forecast, by Application 2019 & 2032
- Table 74: Canada Ophthalmic Lasers Industry Volume (K Unit) Forecast, by Application 2019 & 2032
- Table 75: Mexico Ophthalmic Lasers Industry Revenue (Million) Forecast, by Application 2019 & 2032
- Table 76: Mexico Ophthalmic Lasers Industry Volume (K Unit) Forecast, by Application 2019 & 2032
- Table 77: Global Ophthalmic Lasers Industry Revenue Million Forecast, by Product 2019 & 2032
- Table 78: Global Ophthalmic Lasers Industry Volume K Unit Forecast, by Product 2019 & 2032
- Table 79: Global Ophthalmic Lasers Industry Revenue Million Forecast, by Application 2019 & 2032
- Table 80: Global Ophthalmic Lasers Industry Volume K Unit Forecast, by Application 2019 & 2032
- Table 81: Global Ophthalmic Lasers Industry Revenue Million Forecast, by End User 2019 & 2032
- Table 82: Global Ophthalmic Lasers Industry Volume K Unit Forecast, by End User 2019 & 2032
- Table 83: Global Ophthalmic Lasers Industry Revenue Million Forecast, by Country 2019 & 2032
- Table 84: Global Ophthalmic Lasers Industry Volume K Unit Forecast, by Country 2019 & 2032
- Table 85: Germany Ophthalmic Lasers Industry Revenue (Million) Forecast, by Application 2019 & 2032
- Table 86: Germany Ophthalmic Lasers Industry Volume (K Unit) Forecast, by Application 2019 & 2032
- Table 87: United Kingdom Ophthalmic Lasers Industry Revenue (Million) Forecast, by Application 2019 & 2032
- Table 88: United Kingdom Ophthalmic Lasers Industry Volume (K Unit) Forecast, by Application 2019 & 2032
- Table 89: France Ophthalmic Lasers Industry Revenue (Million) Forecast, by Application 2019 & 2032
- Table 90: France Ophthalmic Lasers Industry Volume (K Unit) Forecast, by Application 2019 & 2032
- Table 91: Italy Ophthalmic Lasers Industry Revenue (Million) Forecast, by Application 2019 & 2032
- Table 92: Italy Ophthalmic Lasers Industry Volume (K Unit) Forecast, by Application 2019 & 2032
- Table 93: Spain Ophthalmic Lasers Industry Revenue (Million) Forecast, by Application 2019 & 2032
- Table 94: Spain Ophthalmic Lasers Industry Volume (K Unit) Forecast, by Application 2019 & 2032
- Table 95: Rest of Europe Ophthalmic Lasers Industry Revenue (Million) Forecast, by Application 2019 & 2032
- Table 96: Rest of Europe Ophthalmic Lasers Industry Volume (K Unit) Forecast, by Application 2019 & 2032
- Table 97: Global Ophthalmic Lasers Industry Revenue Million Forecast, by Product 2019 & 2032
- Table 98: Global Ophthalmic Lasers Industry Volume K Unit Forecast, by Product 2019 & 2032
- Table 99: Global Ophthalmic Lasers Industry Revenue Million Forecast, by Application 2019 & 2032
- Table 100: Global Ophthalmic Lasers Industry Volume K Unit Forecast, by Application 2019 & 2032
- Table 101: Global Ophthalmic Lasers Industry Revenue Million Forecast, by End User 2019 & 2032
- Table 102: Global Ophthalmic Lasers Industry Volume K Unit Forecast, by End User 2019 & 2032
- Table 103: Global Ophthalmic Lasers Industry Revenue Million Forecast, by Country 2019 & 2032
- Table 104: Global Ophthalmic Lasers Industry Volume K Unit Forecast, by Country 2019 & 2032
- Table 105: China Ophthalmic Lasers Industry Revenue (Million) Forecast, by Application 2019 & 2032
- Table 106: China Ophthalmic Lasers Industry Volume (K Unit) Forecast, by Application 2019 & 2032
- Table 107: Japan Ophthalmic Lasers Industry Revenue (Million) Forecast, by Application 2019 & 2032
- Table 108: Japan Ophthalmic Lasers Industry Volume (K Unit) Forecast, by Application 2019 & 2032
- Table 109: India Ophthalmic Lasers Industry Revenue (Million) Forecast, by Application 2019 & 2032
- Table 110: India Ophthalmic Lasers Industry Volume (K Unit) Forecast, by Application 2019 & 2032
- Table 111: Australia Ophthalmic Lasers Industry Revenue (Million) Forecast, by Application 2019 & 2032
- Table 112: Australia Ophthalmic Lasers Industry Volume (K Unit) Forecast, by Application 2019 & 2032
- Table 113: South Korea Ophthalmic Lasers Industry Revenue (Million) Forecast, by Application 2019 & 2032
- Table 114: South Korea Ophthalmic Lasers Industry Volume (K Unit) Forecast, by Application 2019 & 2032
- Table 115: Rest of Asia Pacific Ophthalmic Lasers Industry Revenue (Million) Forecast, by Application 2019 & 2032
- Table 116: Rest of Asia Pacific Ophthalmic Lasers Industry Volume (K Unit) Forecast, by Application 2019 & 2032
- Table 117: Global Ophthalmic Lasers Industry Revenue Million Forecast, by Product 2019 & 2032
- Table 118: Global Ophthalmic Lasers Industry Volume K Unit Forecast, by Product 2019 & 2032
- Table 119: Global Ophthalmic Lasers Industry Revenue Million Forecast, by Application 2019 & 2032
- Table 120: Global Ophthalmic Lasers Industry Volume K Unit Forecast, by Application 2019 & 2032
- Table 121: Global Ophthalmic Lasers Industry Revenue Million Forecast, by End User 2019 & 2032
- Table 122: Global Ophthalmic Lasers Industry Volume K Unit Forecast, by End User 2019 & 2032
- Table 123: Global Ophthalmic Lasers Industry Revenue Million Forecast, by Country 2019 & 2032
- Table 124: Global Ophthalmic Lasers Industry Volume K Unit Forecast, by Country 2019 & 2032
- Table 125: GCC Ophthalmic Lasers Industry Revenue (Million) Forecast, by Application 2019 & 2032
- Table 126: GCC Ophthalmic Lasers Industry Volume (K Unit) Forecast, by Application 2019 & 2032
- Table 127: South Africa Ophthalmic Lasers Industry Revenue (Million) Forecast, by Application 2019 & 2032
- Table 128: South Africa Ophthalmic Lasers Industry Volume (K Unit) Forecast, by Application 2019 & 2032
- Table 129: Rest of Middle East and Africa Ophthalmic Lasers Industry Revenue (Million) Forecast, by Application 2019 & 2032
- Table 130: Rest of Middle East and Africa Ophthalmic Lasers Industry Volume (K Unit) Forecast, by Application 2019 & 2032
- Table 131: Global Ophthalmic Lasers Industry Revenue Million Forecast, by Product 2019 & 2032
- Table 132: Global Ophthalmic Lasers Industry Volume K Unit Forecast, by Product 2019 & 2032
- Table 133: Global Ophthalmic Lasers Industry Revenue Million Forecast, by Application 2019 & 2032
- Table 134: Global Ophthalmic Lasers Industry Volume K Unit Forecast, by Application 2019 & 2032
- Table 135: Global Ophthalmic Lasers Industry Revenue Million Forecast, by End User 2019 & 2032
- Table 136: Global Ophthalmic Lasers Industry Volume K Unit Forecast, by End User 2019 & 2032
- Table 137: Global Ophthalmic Lasers Industry Revenue Million Forecast, by Country 2019 & 2032
- Table 138: Global Ophthalmic Lasers Industry Volume K Unit Forecast, by Country 2019 & 2032
- Table 139: Brazil Ophthalmic Lasers Industry Revenue (Million) Forecast, by Application 2019 & 2032
- Table 140: Brazil Ophthalmic Lasers Industry Volume (K Unit) Forecast, by Application 2019 & 2032
- Table 141: Argentina Ophthalmic Lasers Industry Revenue (Million) Forecast, by Application 2019 & 2032
- Table 142: Argentina Ophthalmic Lasers Industry Volume (K Unit) Forecast, by Application 2019 & 2032
- Table 143: Rest of South America Ophthalmic Lasers Industry Revenue (Million) Forecast, by Application 2019 & 2032
- Table 144: Rest of South America Ophthalmic Lasers Industry Volume (K Unit) Forecast, by Application 2019 & 2032
Frequently Asked Questions
1. What is the projected Compound Annual Growth Rate (CAGR) of the Ophthalmic Lasers Industry?
The projected CAGR is approximately 4.70%.
2. Which companies are prominent players in the Ophthalmic Lasers Industry?
Key companies in the market include Lumibird Group (Quantel Medical), Johnson & Johnson Surgical Vision Inc, Carl Zeiss Meditec AG, IRIDEX Corporation, Lumenis, SCHWIND eye-tech-solutions, Ziemer Opthalmic Systems AG, Novartis AG (Alcon Laboratories Inc), Topcon Corporation, Bausch Health Companies Inc (Bausch & Lomb Incorporated ), LIGHTMED, NIDEK Co Ltd .
3. What are the main segments of the Ophthalmic Lasers Industry?
The market segments include Product, Application, End User.
4. Can you provide details about the market size?
The market size is estimated to be USD 1.49 Million as of 2022.
5. What are some drivers contributing to market growth?
High Prevalence of Ophthalmic Disorders; Increasing Regulatory Approvals for Ophthalmic Lasers; Increasing Initiatives to Control Visual Impairments.
6. What are the notable trends driving market growth?
Refractive Error Corrections Segment is Expected to Hold a Significant Market Share in the Ophthalmic Lasers Market.
7. Are there any restraints impacting market growth?
Huge Cost Associated with Ophthalmic Laser Therapies; Reduced Availability of Skilled Practitioners.
8. Can you provide examples of recent developments in the market?
In June 2022, Iridex Corporation received regulatory clearance to market and sell its Cyclo G6 platform for the treatment of glaucoma diseases in China by its National Medical Products Administration (NMPA). The Cyclo G6 system utilizes the company's MP3 Probe to deliver its MicroPulse TLT, providing non-incisional IOP control in a quick, effective, and safe procedure.
9. What pricing options are available for accessing the report?
Pricing options include single-user, multi-user, and enterprise licenses priced at USD 4750, USD 5250, and USD 8750 respectively.
10. Is the market size provided in terms of value or volume?
The market size is provided in terms of value, measured in Million and volume, measured in K Unit.
11. Are there any specific market keywords associated with the report?
Yes, the market keyword associated with the report is "Ophthalmic Lasers Industry," which aids in identifying and referencing the specific market segment covered.
12. How do I determine which pricing option suits my needs best?
The pricing options vary based on user requirements and access needs. Individual users may opt for single-user licenses, while businesses requiring broader access may choose multi-user or enterprise licenses for cost-effective access to the report.
13. Are there any additional resources or data provided in the Ophthalmic Lasers Industry report?
While the report offers comprehensive insights, it's advisable to review the specific contents or supplementary materials provided to ascertain if additional resources or data are available.
14. How can I stay updated on further developments or reports in the Ophthalmic Lasers Industry?
To stay informed about further developments, trends, and reports in the Ophthalmic Lasers Industry, consider subscribing to industry newsletters, following relevant companies and organizations, or regularly checking reputable industry news sources and publications.
Methodology
Step 1 - Identification of Relevant Samples Size from Population Database


Step 2 - Approaches for Defining Global Market Size (Value, Volume* & Price*)

Note*: In applicable scenarios
Step 3 - Data Sources
Primary Research
- Web Analytics
- Survey Reports
- Research Institute
- Latest Research Reports
- Opinion Leaders
Secondary Research
- Annual Reports
- White Paper
- Latest Press Release
- Industry Association
- Paid Database
- Investor Presentations

Step 4 - Data Triangulation
Involves using different sources of information in order to increase the validity of a study
These sources are likely to be stakeholders in a program - participants, other researchers, program staff, other community members, and so on.
Then we put all data in single framework & apply various statistical tools to find out the dynamic on the market.
During the analysis stage, feedback from the stakeholder groups would be compared to determine areas of agreement as well as areas of divergence


