
Key Insights
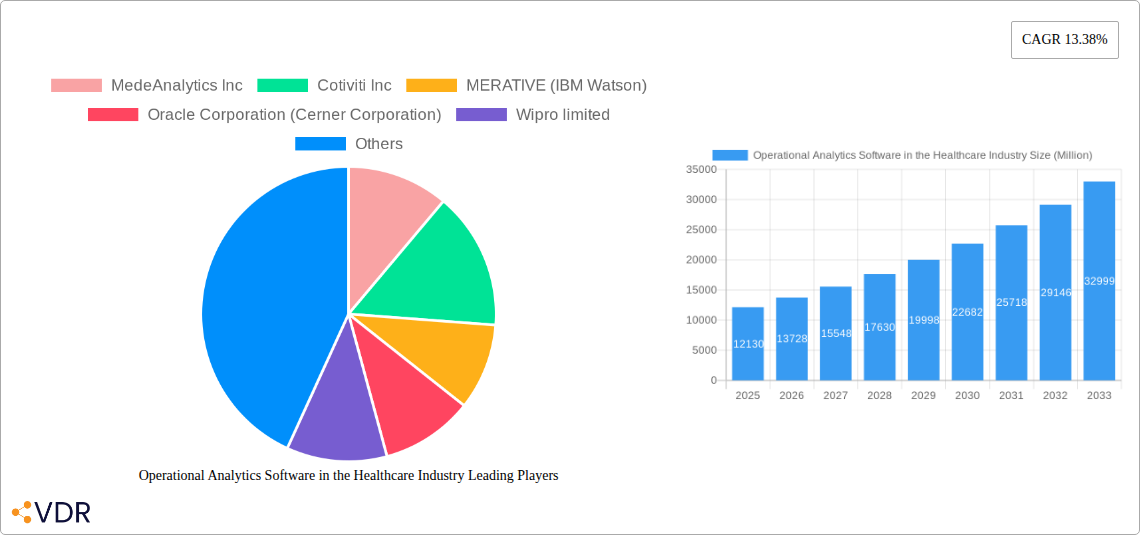
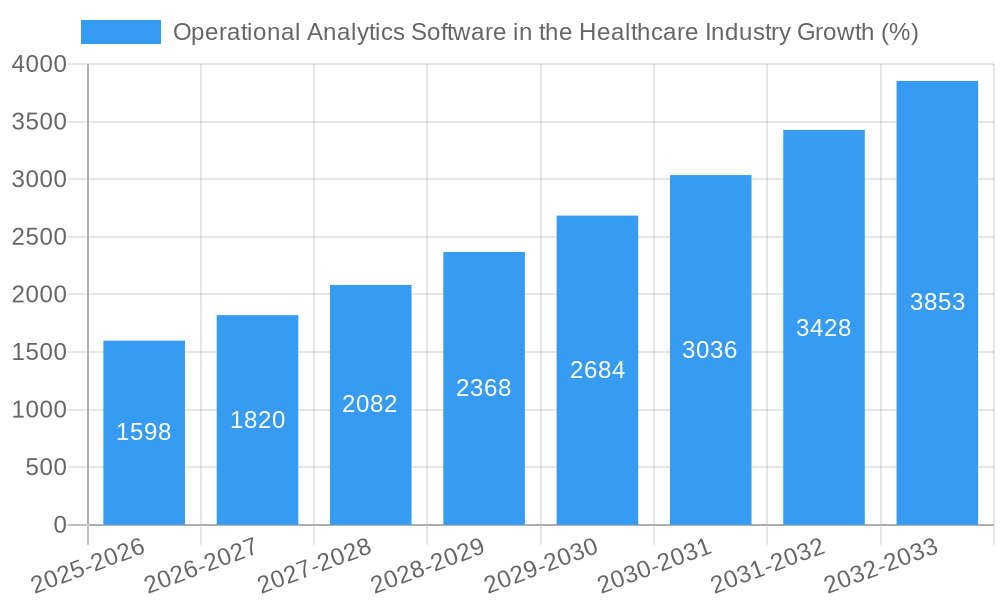
The healthcare operational analytics software market is experiencing robust growth, projected to reach $12.13 billion in 2025 and maintain a Compound Annual Growth Rate (CAGR) of 13.38% from 2025 to 2033. This expansion is driven by several key factors. Firstly, the increasing volume and complexity of healthcare data necessitate advanced analytics solutions for improved operational efficiency and cost reduction. Secondly, the rising adoption of electronic health records (EHRs) and other digital health technologies provides a rich data source for operational analytics. Thirdly, regulatory pressures and the need for improved patient outcomes incentivize healthcare providers to leverage data-driven insights for better decision-making. The market is segmented by type (Supply Chain Analytics, Human Resource Analytics, Strategic Analytics), component (Software, Hardware, Services), deployment (On-Premise, Cloud), and end-user (Hospitals and Clinics, Pharmaceutical and Biotechnology Companies, Other End Users). North America currently holds a significant market share due to early adoption of advanced technologies and strong regulatory support, but the Asia-Pacific region is projected to witness the fastest growth in the coming years, driven by increasing healthcare expenditure and digital transformation initiatives. Competition is intense, with major players like MedeAnalytics, Cotiviti, MERATIVE (IBM Watson), Oracle (Cerner), Wipro, Vizient, Inovalon, Veradigm, Health Catalyst, CVS Health, Optum, and McKesson vying for market dominance through innovation and strategic partnerships.
The strategic focus of leading companies centers around developing comprehensive and integrated solutions that cater to the diverse needs of healthcare organizations. This includes enhancing the user experience, integrating with existing EHR systems, and offering tailored analytics dashboards that provide actionable insights. Future growth will be significantly influenced by advancements in artificial intelligence (AI) and machine learning (ML), which will enable more sophisticated predictive analytics and automated decision-support tools. The increasing adoption of cloud-based solutions will also play a crucial role, offering scalability, cost-effectiveness, and improved data accessibility. However, challenges such as data security concerns, interoperability issues, and the need for skilled professionals to interpret and utilize the analytical insights may impede the market's growth trajectory to some extent.
Operational Analytics Software in the Healthcare Industry: A Comprehensive Market Report (2019-2033)
This in-depth report provides a comprehensive analysis of the Operational Analytics Software market in the healthcare industry, encompassing market dynamics, growth trends, regional analysis, competitive landscape, and future outlook. The study period covers 2019-2033, with 2025 as the base and estimated year. The forecast period spans 2025-2033, and the historical period encompasses 2019-2024. The report serves as an invaluable resource for healthcare providers, technology vendors, investors, and industry professionals seeking to understand and navigate this rapidly evolving market. The market is segmented by Type (Supply Chain Analytics, Human Resource Analytics, Strategic Analytics), Component (Software, Hardware, Services), Deployment (On-Premise), and End-User (Hospitals and Clinics, Pharmaceutical and Biotechnology Companies, Other End Users).
Operational Analytics Software in the Healthcare Industry Market Dynamics & Structure
The healthcare operational analytics software market is experiencing robust growth driven by increasing data volumes, the need for improved efficiency, and the rising adoption of advanced analytics techniques. Market concentration is moderate, with several key players vying for market share. Technological innovation, particularly in AI and machine learning, is a significant driver, enabling more sophisticated analysis and predictive capabilities. Regulatory frameworks, such as HIPAA compliance, significantly influence software development and deployment. Competitive substitutes include legacy systems and manual processes, but the advantages of operational analytics software in terms of efficiency and insights are driving market adoption. The end-user demographic is broad, encompassing hospitals, clinics, pharmaceutical companies, and other healthcare organizations. M&A activity has been moderate, reflecting consolidation within the industry.
- Market Size (2024): xx Million
- Market Concentration: Moderate (Top 5 players hold approximately xx% market share)
- Key M&A Trends: Strategic acquisitions to expand capabilities and market reach. Deal volume in 2022: xx
- Innovation Barriers: High initial investment costs, data integration complexities, and a shortage of skilled professionals.
Operational Analytics Software in the Healthcare Industry Growth Trends & Insights
The global healthcare operational analytics software market is witnessing significant growth, driven by factors such as increasing demand for improved operational efficiency, better patient care, and data-driven decision-making. The market size is projected to expand at a Compound Annual Growth Rate (CAGR) of xx% during the forecast period (2025-2033), reaching xx Million by 2033. Adoption rates are increasing across various healthcare segments, fueled by the rising adoption of cloud-based solutions and the growing awareness of the value of data analytics. Technological advancements, such as the integration of artificial intelligence (AI) and machine learning (ML), are further driving market growth, enabling more accurate predictions and personalized interventions. Consumer behavior shifts, particularly towards personalized and value-based care, are creating new opportunities for the adoption of operational analytics software in improving patient outcomes and cost efficiencies. Market penetration is expected to increase from xx% in 2024 to xx% by 2033.
Dominant Regions, Countries, or Segments in Operational Analytics Software in the Healthcare Industry
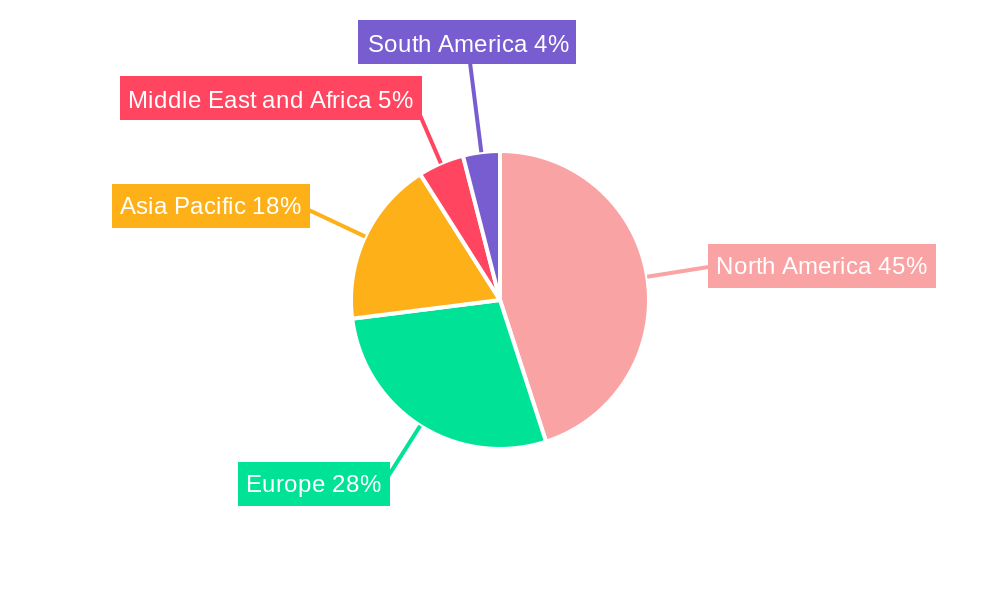
North America currently dominates the global operational analytics software market in healthcare, driven by factors such as high technological adoption, well-established healthcare infrastructure, and significant investments in healthcare IT. However, regions such as Europe and Asia-Pacific are experiencing significant growth, particularly in countries with expanding healthcare systems and increasing government investments in digital health initiatives.
- Leading Region: North America (Market share: xx%)
- Fastest-Growing Region: Asia-Pacific (CAGR: xx%)
- Dominant Segment (Type): Strategic Analytics (Market share: xx%)
- Dominant Segment (Component): Software (Market share: xx%)
- Dominant Segment (Deployment): Cloud (Market share: xx%)
- Dominant Segment (End-User): Hospitals and Clinics (Market share: xx%)
Key growth drivers in North America include favorable regulatory policies, the presence of major technology vendors, and a high concentration of hospitals and clinics. The growth in the Asia-Pacific region is driven by rising healthcare expenditure, an increasing number of technology startups, and increasing government support for digital health initiatives.
Operational Analytics Software in the Healthcare Industry Product Landscape
The healthcare operational analytics software market offers a diverse range of products, including cloud-based and on-premise solutions, catering to various healthcare settings and operational needs. These solutions leverage advanced analytics techniques such as predictive modeling, machine learning, and business intelligence to deliver actionable insights. Key product innovations include improved data visualization tools, enhanced integration capabilities with Electronic Health Records (EHR) systems, and the incorporation of AI-powered features to automate tasks and improve decision-making.
Key Drivers, Barriers & Challenges in Operational Analytics Software in the Healthcare Industry
Key Drivers:
- Increasing demand for improved operational efficiency and cost reduction.
- Growing need for data-driven decision-making in healthcare.
- Rising adoption of cloud-based solutions and mobile technologies.
- Advancements in artificial intelligence and machine learning.
Key Challenges:
- High initial investment costs and complex implementation processes.
- Data security and privacy concerns, particularly with HIPAA compliance.
- Shortage of skilled professionals with expertise in data analytics and healthcare.
- Integration challenges with existing legacy systems.
Emerging Opportunities in Operational Analytics Software in the Healthcare Industry
Emerging opportunities include the expansion of telemedicine, the use of predictive analytics for population health management, and the application of AI in personalized medicine. Untapped markets exist in developing countries with limited access to advanced healthcare technologies. The increasing adoption of value-based care models is also presenting opportunities for operational analytics software to optimize resource allocation and improve patient outcomes.
Growth Accelerators in the Operational Analytics Software in the Healthcare Industry Industry
Technological advancements, particularly in AI and machine learning, are significantly accelerating market growth. Strategic partnerships between technology vendors and healthcare providers are fostering innovation and wider adoption. The expansion of cloud-based solutions is improving accessibility and affordability, while regulatory initiatives promoting interoperability are facilitating data sharing and analytics.
Key Players Shaping the Operational Analytics Software in the Healthcare Industry Market
- MedeAnalytics Inc
- Cotiviti Inc
- MERATIVE (IBM Watson)
- Oracle Corporation (Cerner Corporation)
- Wipro limited
- Vizient Inc
- Inovalon Inc
- Veradigm LLC (Allscripts Healthcare Solutions Inc)
- Health Catalyst Inc
- CVS Health Corporation
- Optum Inc
- McKesson Corporation
Notable Milestones in Operational Analytics Software in the Healthcare Industry Sector
- August 2023: M3, Inc. acquired Frogwell Corporation, expanding its Salesforce consulting capabilities and strengthening its position in the Japanese healthcare market. This acquisition demonstrates the growing importance of data analytics and digital transformation in the healthcare industry.
- June 2023: Moody's Corporation and Microsoft's partnership to leverage AI and cloud computing for enhanced financial services risk assessment indicates broader industry trends toward advanced analytics solutions and collaborative data-driven models. This partnership's impact on healthcare could include more sophisticated risk analysis in healthcare investments and financial modeling.
In-Depth Operational Analytics Software in the Healthcare Industry Market Outlook
The future of the operational analytics software market in healthcare is bright, driven by several key factors, including the continued advancement of technology, increasing data volumes, and growing demand for improved efficiency and patient outcomes. Strategic partnerships, investments in R&D, and expansion into new markets will play crucial roles in shaping the future landscape. The market is poised for sustained growth, offering significant opportunities for technology vendors and healthcare providers alike.
Operational Analytics Software in the Healthcare Industry Segmentation
-
1. Type
- 1.1. Supply Chain Analytics
- 1.2. Human Resource Analytics
- 1.3. Strategic Analytics
-
2. Component
- 2.1. Software
- 2.2. Hardware
- 2.3. Services
-
3. Deployment
- 3.1. On-Premise
-
4. En User
- 4.1. Hospitals and Clinics
- 4.2. Pharmaceutical and Biotechnology Companies
- 4.3. Other End Users
Operational Analytics Software in the Healthcare Industry Segmentation By Geography
-
1. North America
- 1.1. United States
- 1.2. Canada
- 1.3. Mexico
-
2. Europe
- 2.1. Germany
- 2.2. United Kingdom
- 2.3. France
- 2.4. Italy
- 2.5. Spain
- 2.6. Rest of Europe
-
3. Asia Pacific
- 3.1. China
- 3.2. Japan
- 3.3. India
- 3.4. Australia
- 3.5. South Korea
- 3.6. Rest of Asia Pacific
-
4. Middle East and Africa
- 4.1. GCC
- 4.2. South Africa
- 4.3. Rest of Middle East and Africa
-
5. South America
- 5.1. Brazil
- 5.2. Argentina
- 5.3. Rest of South America
Operational Analytics Software in the Healthcare Industry REPORT HIGHLIGHTS
| Aspects | Details |
|---|---|
| Study Period | 2019-2033 |
| Base Year | 2024 |
| Estimated Year | 2025 |
| Forecast Period | 2025-2033 |
| Historical Period | 2019-2024 |
| Growth Rate | CAGR of 13.38% from 2019-2033 |
| Segmentation |
|
Table of Contents
- 1. Introduction
- 1.1. Research Scope
- 1.2. Market Segmentation
- 1.3. Research Methodology
- 1.4. Definitions and Assumptions
- 2. Executive Summary
- 2.1. Introduction
- 3. Market Dynamics
- 3.1. Introduction
- 3.2. Market Drivers
- 3.2.1. Increasing Demand for Value-Based Care (VBC); Rising Need to Analyze the Collected Healthcare Data; Rising Awareness regarding Healthcare Standards and Improving Technologies
- 3.3. Market Restrains
- 3.3.1. Concerns regarding Data Privacy and Security; Lack of Trained IT Professionals in Healthcare
- 3.4. Market Trends
- 3.4.1. Software Component is Expected to Witness Significant Growth Over a Forecast Period.
- 4. Market Factor Analysis
- 4.1. Porters Five Forces
- 4.2. Supply/Value Chain
- 4.3. PESTEL analysis
- 4.4. Market Entropy
- 4.5. Patent/Trademark Analysis
- 5. Global Operational Analytics Software in the Healthcare Industry Analysis, Insights and Forecast, 2019-2031
- 5.1. Market Analysis, Insights and Forecast - by Type
- 5.1.1. Supply Chain Analytics
- 5.1.2. Human Resource Analytics
- 5.1.3. Strategic Analytics
- 5.2. Market Analysis, Insights and Forecast - by Component
- 5.2.1. Software
- 5.2.2. Hardware
- 5.2.3. Services
- 5.3. Market Analysis, Insights and Forecast - by Deployment
- 5.3.1. On-Premise
- 5.4. Market Analysis, Insights and Forecast - by En User
- 5.4.1. Hospitals and Clinics
- 5.4.2. Pharmaceutical and Biotechnology Companies
- 5.4.3. Other End Users
- 5.5. Market Analysis, Insights and Forecast - by Region
- 5.5.1. North America
- 5.5.2. Europe
- 5.5.3. Asia Pacific
- 5.5.4. Middle East and Africa
- 5.5.5. South America
- 5.1. Market Analysis, Insights and Forecast - by Type
- 6. North America Operational Analytics Software in the Healthcare Industry Analysis, Insights and Forecast, 2019-2031
- 6.1. Market Analysis, Insights and Forecast - by Type
- 6.1.1. Supply Chain Analytics
- 6.1.2. Human Resource Analytics
- 6.1.3. Strategic Analytics
- 6.2. Market Analysis, Insights and Forecast - by Component
- 6.2.1. Software
- 6.2.2. Hardware
- 6.2.3. Services
- 6.3. Market Analysis, Insights and Forecast - by Deployment
- 6.3.1. On-Premise
- 6.4. Market Analysis, Insights and Forecast - by En User
- 6.4.1. Hospitals and Clinics
- 6.4.2. Pharmaceutical and Biotechnology Companies
- 6.4.3. Other End Users
- 6.1. Market Analysis, Insights and Forecast - by Type
- 7. Europe Operational Analytics Software in the Healthcare Industry Analysis, Insights and Forecast, 2019-2031
- 7.1. Market Analysis, Insights and Forecast - by Type
- 7.1.1. Supply Chain Analytics
- 7.1.2. Human Resource Analytics
- 7.1.3. Strategic Analytics
- 7.2. Market Analysis, Insights and Forecast - by Component
- 7.2.1. Software
- 7.2.2. Hardware
- 7.2.3. Services
- 7.3. Market Analysis, Insights and Forecast - by Deployment
- 7.3.1. On-Premise
- 7.4. Market Analysis, Insights and Forecast - by En User
- 7.4.1. Hospitals and Clinics
- 7.4.2. Pharmaceutical and Biotechnology Companies
- 7.4.3. Other End Users
- 7.1. Market Analysis, Insights and Forecast - by Type
- 8. Asia Pacific Operational Analytics Software in the Healthcare Industry Analysis, Insights and Forecast, 2019-2031
- 8.1. Market Analysis, Insights and Forecast - by Type
- 8.1.1. Supply Chain Analytics
- 8.1.2. Human Resource Analytics
- 8.1.3. Strategic Analytics
- 8.2. Market Analysis, Insights and Forecast - by Component
- 8.2.1. Software
- 8.2.2. Hardware
- 8.2.3. Services
- 8.3. Market Analysis, Insights and Forecast - by Deployment
- 8.3.1. On-Premise
- 8.4. Market Analysis, Insights and Forecast - by En User
- 8.4.1. Hospitals and Clinics
- 8.4.2. Pharmaceutical and Biotechnology Companies
- 8.4.3. Other End Users
- 8.1. Market Analysis, Insights and Forecast - by Type
- 9. Middle East and Africa Operational Analytics Software in the Healthcare Industry Analysis, Insights and Forecast, 2019-2031
- 9.1. Market Analysis, Insights and Forecast - by Type
- 9.1.1. Supply Chain Analytics
- 9.1.2. Human Resource Analytics
- 9.1.3. Strategic Analytics
- 9.2. Market Analysis, Insights and Forecast - by Component
- 9.2.1. Software
- 9.2.2. Hardware
- 9.2.3. Services
- 9.3. Market Analysis, Insights and Forecast - by Deployment
- 9.3.1. On-Premise
- 9.4. Market Analysis, Insights and Forecast - by En User
- 9.4.1. Hospitals and Clinics
- 9.4.2. Pharmaceutical and Biotechnology Companies
- 9.4.3. Other End Users
- 9.1. Market Analysis, Insights and Forecast - by Type
- 10. South America Operational Analytics Software in the Healthcare Industry Analysis, Insights and Forecast, 2019-2031
- 10.1. Market Analysis, Insights and Forecast - by Type
- 10.1.1. Supply Chain Analytics
- 10.1.2. Human Resource Analytics
- 10.1.3. Strategic Analytics
- 10.2. Market Analysis, Insights and Forecast - by Component
- 10.2.1. Software
- 10.2.2. Hardware
- 10.2.3. Services
- 10.3. Market Analysis, Insights and Forecast - by Deployment
- 10.3.1. On-Premise
- 10.4. Market Analysis, Insights and Forecast - by En User
- 10.4.1. Hospitals and Clinics
- 10.4.2. Pharmaceutical and Biotechnology Companies
- 10.4.3. Other End Users
- 10.1. Market Analysis, Insights and Forecast - by Type
- 11. North America Operational Analytics Software in the Healthcare Industry Analysis, Insights and Forecast, 2019-2031
- 11.1. Market Analysis, Insights and Forecast - By Country/Sub-region
- 11.1.1. undefined
- 12. Europe Operational Analytics Software in the Healthcare Industry Analysis, Insights and Forecast, 2019-2031
- 12.1. Market Analysis, Insights and Forecast - By Country/Sub-region
- 12.1.1. undefined
- 13. Asia Pacific Operational Analytics Software in the Healthcare Industry Analysis, Insights and Forecast, 2019-2031
- 13.1. Market Analysis, Insights and Forecast - By Country/Sub-region
- 13.1.1. undefined
- 14. Middle East and Africa Operational Analytics Software in the Healthcare Industry Analysis, Insights and Forecast, 2019-2031
- 14.1. Market Analysis, Insights and Forecast - By Country/Sub-region
- 14.1.1. undefined
- 15. South America Operational Analytics Software in the Healthcare Industry Analysis, Insights and Forecast, 2019-2031
- 15.1. Market Analysis, Insights and Forecast - By Country/Sub-region
- 15.1.1. undefined
- 16. Competitive Analysis
- 16.1. Global Market Share Analysis 2024
- 16.2. Company Profiles
- 16.2.1 MedeAnalytics Inc
- 16.2.1.1. Overview
- 16.2.1.2. Products
- 16.2.1.3. SWOT Analysis
- 16.2.1.4. Recent Developments
- 16.2.1.5. Financials (Based on Availability)
- 16.2.2 Cotiviti Inc
- 16.2.2.1. Overview
- 16.2.2.2. Products
- 16.2.2.3. SWOT Analysis
- 16.2.2.4. Recent Developments
- 16.2.2.5. Financials (Based on Availability)
- 16.2.3 MERATIVE (IBM Watson)
- 16.2.3.1. Overview
- 16.2.3.2. Products
- 16.2.3.3. SWOT Analysis
- 16.2.3.4. Recent Developments
- 16.2.3.5. Financials (Based on Availability)
- 16.2.4 Oracle Corporation (Cerner Corporation)
- 16.2.4.1. Overview
- 16.2.4.2. Products
- 16.2.4.3. SWOT Analysis
- 16.2.4.4. Recent Developments
- 16.2.4.5. Financials (Based on Availability)
- 16.2.5 Wipro limited
- 16.2.5.1. Overview
- 16.2.5.2. Products
- 16.2.5.3. SWOT Analysis
- 16.2.5.4. Recent Developments
- 16.2.5.5. Financials (Based on Availability)
- 16.2.6 Vizient Inc
- 16.2.6.1. Overview
- 16.2.6.2. Products
- 16.2.6.3. SWOT Analysis
- 16.2.6.4. Recent Developments
- 16.2.6.5. Financials (Based on Availability)
- 16.2.7 Inovalon Inc
- 16.2.7.1. Overview
- 16.2.7.2. Products
- 16.2.7.3. SWOT Analysis
- 16.2.7.4. Recent Developments
- 16.2.7.5. Financials (Based on Availability)
- 16.2.8 Veradigm LLC (Allscripts Healthcare Solutions Inc )
- 16.2.8.1. Overview
- 16.2.8.2. Products
- 16.2.8.3. SWOT Analysis
- 16.2.8.4. Recent Developments
- 16.2.8.5. Financials (Based on Availability)
- 16.2.9 Health Catalyst Inc
- 16.2.9.1. Overview
- 16.2.9.2. Products
- 16.2.9.3. SWOT Analysis
- 16.2.9.4. Recent Developments
- 16.2.9.5. Financials (Based on Availability)
- 16.2.10 CVS Health Corporation
- 16.2.10.1. Overview
- 16.2.10.2. Products
- 16.2.10.3. SWOT Analysis
- 16.2.10.4. Recent Developments
- 16.2.10.5. Financials (Based on Availability)
- 16.2.11 Optum Inc
- 16.2.11.1. Overview
- 16.2.11.2. Products
- 16.2.11.3. SWOT Analysis
- 16.2.11.4. Recent Developments
- 16.2.11.5. Financials (Based on Availability)
- 16.2.12 McKesson Corporation
- 16.2.12.1. Overview
- 16.2.12.2. Products
- 16.2.12.3. SWOT Analysis
- 16.2.12.4. Recent Developments
- 16.2.12.5. Financials (Based on Availability)
- 16.2.1 MedeAnalytics Inc
List of Figures
- Figure 1: Global Operational Analytics Software in the Healthcare Industry Revenue Breakdown (Million, %) by Region 2024 & 2032
- Figure 2: Global Operational Analytics Software in the Healthcare Industry Volume Breakdown (K Unit, %) by Region 2024 & 2032
- Figure 3: North America Operational Analytics Software in the Healthcare Industry Revenue (Million), by Country 2024 & 2032
- Figure 4: North America Operational Analytics Software in the Healthcare Industry Volume (K Unit), by Country 2024 & 2032
- Figure 5: North America Operational Analytics Software in the Healthcare Industry Revenue Share (%), by Country 2024 & 2032
- Figure 6: North America Operational Analytics Software in the Healthcare Industry Volume Share (%), by Country 2024 & 2032
- Figure 7: Europe Operational Analytics Software in the Healthcare Industry Revenue (Million), by Country 2024 & 2032
- Figure 8: Europe Operational Analytics Software in the Healthcare Industry Volume (K Unit), by Country 2024 & 2032
- Figure 9: Europe Operational Analytics Software in the Healthcare Industry Revenue Share (%), by Country 2024 & 2032
- Figure 10: Europe Operational Analytics Software in the Healthcare Industry Volume Share (%), by Country 2024 & 2032
- Figure 11: Asia Pacific Operational Analytics Software in the Healthcare Industry Revenue (Million), by Country 2024 & 2032
- Figure 12: Asia Pacific Operational Analytics Software in the Healthcare Industry Volume (K Unit), by Country 2024 & 2032
- Figure 13: Asia Pacific Operational Analytics Software in the Healthcare Industry Revenue Share (%), by Country 2024 & 2032
- Figure 14: Asia Pacific Operational Analytics Software in the Healthcare Industry Volume Share (%), by Country 2024 & 2032
- Figure 15: Middle East and Africa Operational Analytics Software in the Healthcare Industry Revenue (Million), by Country 2024 & 2032
- Figure 16: Middle East and Africa Operational Analytics Software in the Healthcare Industry Volume (K Unit), by Country 2024 & 2032
- Figure 17: Middle East and Africa Operational Analytics Software in the Healthcare Industry Revenue Share (%), by Country 2024 & 2032
- Figure 18: Middle East and Africa Operational Analytics Software in the Healthcare Industry Volume Share (%), by Country 2024 & 2032
- Figure 19: South America Operational Analytics Software in the Healthcare Industry Revenue (Million), by Country 2024 & 2032
- Figure 20: South America Operational Analytics Software in the Healthcare Industry Volume (K Unit), by Country 2024 & 2032
- Figure 21: South America Operational Analytics Software in the Healthcare Industry Revenue Share (%), by Country 2024 & 2032
- Figure 22: South America Operational Analytics Software in the Healthcare Industry Volume Share (%), by Country 2024 & 2032
- Figure 23: North America Operational Analytics Software in the Healthcare Industry Revenue (Million), by Type 2024 & 2032
- Figure 24: North America Operational Analytics Software in the Healthcare Industry Volume (K Unit), by Type 2024 & 2032
- Figure 25: North America Operational Analytics Software in the Healthcare Industry Revenue Share (%), by Type 2024 & 2032
- Figure 26: North America Operational Analytics Software in the Healthcare Industry Volume Share (%), by Type 2024 & 2032
- Figure 27: North America Operational Analytics Software in the Healthcare Industry Revenue (Million), by Component 2024 & 2032
- Figure 28: North America Operational Analytics Software in the Healthcare Industry Volume (K Unit), by Component 2024 & 2032
- Figure 29: North America Operational Analytics Software in the Healthcare Industry Revenue Share (%), by Component 2024 & 2032
- Figure 30: North America Operational Analytics Software in the Healthcare Industry Volume Share (%), by Component 2024 & 2032
- Figure 31: North America Operational Analytics Software in the Healthcare Industry Revenue (Million), by Deployment 2024 & 2032
- Figure 32: North America Operational Analytics Software in the Healthcare Industry Volume (K Unit), by Deployment 2024 & 2032
- Figure 33: North America Operational Analytics Software in the Healthcare Industry Revenue Share (%), by Deployment 2024 & 2032
- Figure 34: North America Operational Analytics Software in the Healthcare Industry Volume Share (%), by Deployment 2024 & 2032
- Figure 35: North America Operational Analytics Software in the Healthcare Industry Revenue (Million), by En User 2024 & 2032
- Figure 36: North America Operational Analytics Software in the Healthcare Industry Volume (K Unit), by En User 2024 & 2032
- Figure 37: North America Operational Analytics Software in the Healthcare Industry Revenue Share (%), by En User 2024 & 2032
- Figure 38: North America Operational Analytics Software in the Healthcare Industry Volume Share (%), by En User 2024 & 2032
- Figure 39: North America Operational Analytics Software in the Healthcare Industry Revenue (Million), by Country 2024 & 2032
- Figure 40: North America Operational Analytics Software in the Healthcare Industry Volume (K Unit), by Country 2024 & 2032
- Figure 41: North America Operational Analytics Software in the Healthcare Industry Revenue Share (%), by Country 2024 & 2032
- Figure 42: North America Operational Analytics Software in the Healthcare Industry Volume Share (%), by Country 2024 & 2032
- Figure 43: Europe Operational Analytics Software in the Healthcare Industry Revenue (Million), by Type 2024 & 2032
- Figure 44: Europe Operational Analytics Software in the Healthcare Industry Volume (K Unit), by Type 2024 & 2032
- Figure 45: Europe Operational Analytics Software in the Healthcare Industry Revenue Share (%), by Type 2024 & 2032
- Figure 46: Europe Operational Analytics Software in the Healthcare Industry Volume Share (%), by Type 2024 & 2032
- Figure 47: Europe Operational Analytics Software in the Healthcare Industry Revenue (Million), by Component 2024 & 2032
- Figure 48: Europe Operational Analytics Software in the Healthcare Industry Volume (K Unit), by Component 2024 & 2032
- Figure 49: Europe Operational Analytics Software in the Healthcare Industry Revenue Share (%), by Component 2024 & 2032
- Figure 50: Europe Operational Analytics Software in the Healthcare Industry Volume Share (%), by Component 2024 & 2032
- Figure 51: Europe Operational Analytics Software in the Healthcare Industry Revenue (Million), by Deployment 2024 & 2032
- Figure 52: Europe Operational Analytics Software in the Healthcare Industry Volume (K Unit), by Deployment 2024 & 2032
- Figure 53: Europe Operational Analytics Software in the Healthcare Industry Revenue Share (%), by Deployment 2024 & 2032
- Figure 54: Europe Operational Analytics Software in the Healthcare Industry Volume Share (%), by Deployment 2024 & 2032
- Figure 55: Europe Operational Analytics Software in the Healthcare Industry Revenue (Million), by En User 2024 & 2032
- Figure 56: Europe Operational Analytics Software in the Healthcare Industry Volume (K Unit), by En User 2024 & 2032
- Figure 57: Europe Operational Analytics Software in the Healthcare Industry Revenue Share (%), by En User 2024 & 2032
- Figure 58: Europe Operational Analytics Software in the Healthcare Industry Volume Share (%), by En User 2024 & 2032
- Figure 59: Europe Operational Analytics Software in the Healthcare Industry Revenue (Million), by Country 2024 & 2032
- Figure 60: Europe Operational Analytics Software in the Healthcare Industry Volume (K Unit), by Country 2024 & 2032
- Figure 61: Europe Operational Analytics Software in the Healthcare Industry Revenue Share (%), by Country 2024 & 2032
- Figure 62: Europe Operational Analytics Software in the Healthcare Industry Volume Share (%), by Country 2024 & 2032
- Figure 63: Asia Pacific Operational Analytics Software in the Healthcare Industry Revenue (Million), by Type 2024 & 2032
- Figure 64: Asia Pacific Operational Analytics Software in the Healthcare Industry Volume (K Unit), by Type 2024 & 2032
- Figure 65: Asia Pacific Operational Analytics Software in the Healthcare Industry Revenue Share (%), by Type 2024 & 2032
- Figure 66: Asia Pacific Operational Analytics Software in the Healthcare Industry Volume Share (%), by Type 2024 & 2032
- Figure 67: Asia Pacific Operational Analytics Software in the Healthcare Industry Revenue (Million), by Component 2024 & 2032
- Figure 68: Asia Pacific Operational Analytics Software in the Healthcare Industry Volume (K Unit), by Component 2024 & 2032
- Figure 69: Asia Pacific Operational Analytics Software in the Healthcare Industry Revenue Share (%), by Component 2024 & 2032
- Figure 70: Asia Pacific Operational Analytics Software in the Healthcare Industry Volume Share (%), by Component 2024 & 2032
- Figure 71: Asia Pacific Operational Analytics Software in the Healthcare Industry Revenue (Million), by Deployment 2024 & 2032
- Figure 72: Asia Pacific Operational Analytics Software in the Healthcare Industry Volume (K Unit), by Deployment 2024 & 2032
- Figure 73: Asia Pacific Operational Analytics Software in the Healthcare Industry Revenue Share (%), by Deployment 2024 & 2032
- Figure 74: Asia Pacific Operational Analytics Software in the Healthcare Industry Volume Share (%), by Deployment 2024 & 2032
- Figure 75: Asia Pacific Operational Analytics Software in the Healthcare Industry Revenue (Million), by En User 2024 & 2032
- Figure 76: Asia Pacific Operational Analytics Software in the Healthcare Industry Volume (K Unit), by En User 2024 & 2032
- Figure 77: Asia Pacific Operational Analytics Software in the Healthcare Industry Revenue Share (%), by En User 2024 & 2032
- Figure 78: Asia Pacific Operational Analytics Software in the Healthcare Industry Volume Share (%), by En User 2024 & 2032
- Figure 79: Asia Pacific Operational Analytics Software in the Healthcare Industry Revenue (Million), by Country 2024 & 2032
- Figure 80: Asia Pacific Operational Analytics Software in the Healthcare Industry Volume (K Unit), by Country 2024 & 2032
- Figure 81: Asia Pacific Operational Analytics Software in the Healthcare Industry Revenue Share (%), by Country 2024 & 2032
- Figure 82: Asia Pacific Operational Analytics Software in the Healthcare Industry Volume Share (%), by Country 2024 & 2032
- Figure 83: Middle East and Africa Operational Analytics Software in the Healthcare Industry Revenue (Million), by Type 2024 & 2032
- Figure 84: Middle East and Africa Operational Analytics Software in the Healthcare Industry Volume (K Unit), by Type 2024 & 2032
- Figure 85: Middle East and Africa Operational Analytics Software in the Healthcare Industry Revenue Share (%), by Type 2024 & 2032
- Figure 86: Middle East and Africa Operational Analytics Software in the Healthcare Industry Volume Share (%), by Type 2024 & 2032
- Figure 87: Middle East and Africa Operational Analytics Software in the Healthcare Industry Revenue (Million), by Component 2024 & 2032
- Figure 88: Middle East and Africa Operational Analytics Software in the Healthcare Industry Volume (K Unit), by Component 2024 & 2032
- Figure 89: Middle East and Africa Operational Analytics Software in the Healthcare Industry Revenue Share (%), by Component 2024 & 2032
- Figure 90: Middle East and Africa Operational Analytics Software in the Healthcare Industry Volume Share (%), by Component 2024 & 2032
- Figure 91: Middle East and Africa Operational Analytics Software in the Healthcare Industry Revenue (Million), by Deployment 2024 & 2032
- Figure 92: Middle East and Africa Operational Analytics Software in the Healthcare Industry Volume (K Unit), by Deployment 2024 & 2032
- Figure 93: Middle East and Africa Operational Analytics Software in the Healthcare Industry Revenue Share (%), by Deployment 2024 & 2032
- Figure 94: Middle East and Africa Operational Analytics Software in the Healthcare Industry Volume Share (%), by Deployment 2024 & 2032
- Figure 95: Middle East and Africa Operational Analytics Software in the Healthcare Industry Revenue (Million), by En User 2024 & 2032
- Figure 96: Middle East and Africa Operational Analytics Software in the Healthcare Industry Volume (K Unit), by En User 2024 & 2032
- Figure 97: Middle East and Africa Operational Analytics Software in the Healthcare Industry Revenue Share (%), by En User 2024 & 2032
- Figure 98: Middle East and Africa Operational Analytics Software in the Healthcare Industry Volume Share (%), by En User 2024 & 2032
- Figure 99: Middle East and Africa Operational Analytics Software in the Healthcare Industry Revenue (Million), by Country 2024 & 2032
- Figure 100: Middle East and Africa Operational Analytics Software in the Healthcare Industry Volume (K Unit), by Country 2024 & 2032
- Figure 101: Middle East and Africa Operational Analytics Software in the Healthcare Industry Revenue Share (%), by Country 2024 & 2032
- Figure 102: Middle East and Africa Operational Analytics Software in the Healthcare Industry Volume Share (%), by Country 2024 & 2032
- Figure 103: South America Operational Analytics Software in the Healthcare Industry Revenue (Million), by Type 2024 & 2032
- Figure 104: South America Operational Analytics Software in the Healthcare Industry Volume (K Unit), by Type 2024 & 2032
- Figure 105: South America Operational Analytics Software in the Healthcare Industry Revenue Share (%), by Type 2024 & 2032
- Figure 106: South America Operational Analytics Software in the Healthcare Industry Volume Share (%), by Type 2024 & 2032
- Figure 107: South America Operational Analytics Software in the Healthcare Industry Revenue (Million), by Component 2024 & 2032
- Figure 108: South America Operational Analytics Software in the Healthcare Industry Volume (K Unit), by Component 2024 & 2032
- Figure 109: South America Operational Analytics Software in the Healthcare Industry Revenue Share (%), by Component 2024 & 2032
- Figure 110: South America Operational Analytics Software in the Healthcare Industry Volume Share (%), by Component 2024 & 2032
- Figure 111: South America Operational Analytics Software in the Healthcare Industry Revenue (Million), by Deployment 2024 & 2032
- Figure 112: South America Operational Analytics Software in the Healthcare Industry Volume (K Unit), by Deployment 2024 & 2032
- Figure 113: South America Operational Analytics Software in the Healthcare Industry Revenue Share (%), by Deployment 2024 & 2032
- Figure 114: South America Operational Analytics Software in the Healthcare Industry Volume Share (%), by Deployment 2024 & 2032
- Figure 115: South America Operational Analytics Software in the Healthcare Industry Revenue (Million), by En User 2024 & 2032
- Figure 116: South America Operational Analytics Software in the Healthcare Industry Volume (K Unit), by En User 2024 & 2032
- Figure 117: South America Operational Analytics Software in the Healthcare Industry Revenue Share (%), by En User 2024 & 2032
- Figure 118: South America Operational Analytics Software in the Healthcare Industry Volume Share (%), by En User 2024 & 2032
- Figure 119: South America Operational Analytics Software in the Healthcare Industry Revenue (Million), by Country 2024 & 2032
- Figure 120: South America Operational Analytics Software in the Healthcare Industry Volume (K Unit), by Country 2024 & 2032
- Figure 121: South America Operational Analytics Software in the Healthcare Industry Revenue Share (%), by Country 2024 & 2032
- Figure 122: South America Operational Analytics Software in the Healthcare Industry Volume Share (%), by Country 2024 & 2032
List of Tables
- Table 1: Global Operational Analytics Software in the Healthcare Industry Revenue Million Forecast, by Region 2019 & 2032
- Table 2: Global Operational Analytics Software in the Healthcare Industry Volume K Unit Forecast, by Region 2019 & 2032
- Table 3: Global Operational Analytics Software in the Healthcare Industry Revenue Million Forecast, by Type 2019 & 2032
- Table 4: Global Operational Analytics Software in the Healthcare Industry Volume K Unit Forecast, by Type 2019 & 2032
- Table 5: Global Operational Analytics Software in the Healthcare Industry Revenue Million Forecast, by Component 2019 & 2032
- Table 6: Global Operational Analytics Software in the Healthcare Industry Volume K Unit Forecast, by Component 2019 & 2032
- Table 7: Global Operational Analytics Software in the Healthcare Industry Revenue Million Forecast, by Deployment 2019 & 2032
- Table 8: Global Operational Analytics Software in the Healthcare Industry Volume K Unit Forecast, by Deployment 2019 & 2032
- Table 9: Global Operational Analytics Software in the Healthcare Industry Revenue Million Forecast, by En User 2019 & 2032
- Table 10: Global Operational Analytics Software in the Healthcare Industry Volume K Unit Forecast, by En User 2019 & 2032
- Table 11: Global Operational Analytics Software in the Healthcare Industry Revenue Million Forecast, by Region 2019 & 2032
- Table 12: Global Operational Analytics Software in the Healthcare Industry Volume K Unit Forecast, by Region 2019 & 2032
- Table 13: Global Operational Analytics Software in the Healthcare Industry Revenue Million Forecast, by Country 2019 & 2032
- Table 14: Global Operational Analytics Software in the Healthcare Industry Volume K Unit Forecast, by Country 2019 & 2032
- Table 15: Global Operational Analytics Software in the Healthcare Industry Revenue Million Forecast, by Country 2019 & 2032
- Table 16: Global Operational Analytics Software in the Healthcare Industry Volume K Unit Forecast, by Country 2019 & 2032
- Table 17: Global Operational Analytics Software in the Healthcare Industry Revenue Million Forecast, by Country 2019 & 2032
- Table 18: Global Operational Analytics Software in the Healthcare Industry Volume K Unit Forecast, by Country 2019 & 2032
- Table 19: Global Operational Analytics Software in the Healthcare Industry Revenue Million Forecast, by Country 2019 & 2032
- Table 20: Global Operational Analytics Software in the Healthcare Industry Volume K Unit Forecast, by Country 2019 & 2032
- Table 21: Global Operational Analytics Software in the Healthcare Industry Revenue Million Forecast, by Country 2019 & 2032
- Table 22: Global Operational Analytics Software in the Healthcare Industry Volume K Unit Forecast, by Country 2019 & 2032
- Table 23: Global Operational Analytics Software in the Healthcare Industry Revenue Million Forecast, by Type 2019 & 2032
- Table 24: Global Operational Analytics Software in the Healthcare Industry Volume K Unit Forecast, by Type 2019 & 2032
- Table 25: Global Operational Analytics Software in the Healthcare Industry Revenue Million Forecast, by Component 2019 & 2032
- Table 26: Global Operational Analytics Software in the Healthcare Industry Volume K Unit Forecast, by Component 2019 & 2032
- Table 27: Global Operational Analytics Software in the Healthcare Industry Revenue Million Forecast, by Deployment 2019 & 2032
- Table 28: Global Operational Analytics Software in the Healthcare Industry Volume K Unit Forecast, by Deployment 2019 & 2032
- Table 29: Global Operational Analytics Software in the Healthcare Industry Revenue Million Forecast, by En User 2019 & 2032
- Table 30: Global Operational Analytics Software in the Healthcare Industry Volume K Unit Forecast, by En User 2019 & 2032
- Table 31: Global Operational Analytics Software in the Healthcare Industry Revenue Million Forecast, by Country 2019 & 2032
- Table 32: Global Operational Analytics Software in the Healthcare Industry Volume K Unit Forecast, by Country 2019 & 2032
- Table 33: United States Operational Analytics Software in the Healthcare Industry Revenue (Million) Forecast, by Application 2019 & 2032
- Table 34: United States Operational Analytics Software in the Healthcare Industry Volume (K Unit) Forecast, by Application 2019 & 2032
- Table 35: Canada Operational Analytics Software in the Healthcare Industry Revenue (Million) Forecast, by Application 2019 & 2032
- Table 36: Canada Operational Analytics Software in the Healthcare Industry Volume (K Unit) Forecast, by Application 2019 & 2032
- Table 37: Mexico Operational Analytics Software in the Healthcare Industry Revenue (Million) Forecast, by Application 2019 & 2032
- Table 38: Mexico Operational Analytics Software in the Healthcare Industry Volume (K Unit) Forecast, by Application 2019 & 2032
- Table 39: Global Operational Analytics Software in the Healthcare Industry Revenue Million Forecast, by Type 2019 & 2032
- Table 40: Global Operational Analytics Software in the Healthcare Industry Volume K Unit Forecast, by Type 2019 & 2032
- Table 41: Global Operational Analytics Software in the Healthcare Industry Revenue Million Forecast, by Component 2019 & 2032
- Table 42: Global Operational Analytics Software in the Healthcare Industry Volume K Unit Forecast, by Component 2019 & 2032
- Table 43: Global Operational Analytics Software in the Healthcare Industry Revenue Million Forecast, by Deployment 2019 & 2032
- Table 44: Global Operational Analytics Software in the Healthcare Industry Volume K Unit Forecast, by Deployment 2019 & 2032
- Table 45: Global Operational Analytics Software in the Healthcare Industry Revenue Million Forecast, by En User 2019 & 2032
- Table 46: Global Operational Analytics Software in the Healthcare Industry Volume K Unit Forecast, by En User 2019 & 2032
- Table 47: Global Operational Analytics Software in the Healthcare Industry Revenue Million Forecast, by Country 2019 & 2032
- Table 48: Global Operational Analytics Software in the Healthcare Industry Volume K Unit Forecast, by Country 2019 & 2032
- Table 49: Germany Operational Analytics Software in the Healthcare Industry Revenue (Million) Forecast, by Application 2019 & 2032
- Table 50: Germany Operational Analytics Software in the Healthcare Industry Volume (K Unit) Forecast, by Application 2019 & 2032
- Table 51: United Kingdom Operational Analytics Software in the Healthcare Industry Revenue (Million) Forecast, by Application 2019 & 2032
- Table 52: United Kingdom Operational Analytics Software in the Healthcare Industry Volume (K Unit) Forecast, by Application 2019 & 2032
- Table 53: France Operational Analytics Software in the Healthcare Industry Revenue (Million) Forecast, by Application 2019 & 2032
- Table 54: France Operational Analytics Software in the Healthcare Industry Volume (K Unit) Forecast, by Application 2019 & 2032
- Table 55: Italy Operational Analytics Software in the Healthcare Industry Revenue (Million) Forecast, by Application 2019 & 2032
- Table 56: Italy Operational Analytics Software in the Healthcare Industry Volume (K Unit) Forecast, by Application 2019 & 2032
- Table 57: Spain Operational Analytics Software in the Healthcare Industry Revenue (Million) Forecast, by Application 2019 & 2032
- Table 58: Spain Operational Analytics Software in the Healthcare Industry Volume (K Unit) Forecast, by Application 2019 & 2032
- Table 59: Rest of Europe Operational Analytics Software in the Healthcare Industry Revenue (Million) Forecast, by Application 2019 & 2032
- Table 60: Rest of Europe Operational Analytics Software in the Healthcare Industry Volume (K Unit) Forecast, by Application 2019 & 2032
- Table 61: Global Operational Analytics Software in the Healthcare Industry Revenue Million Forecast, by Type 2019 & 2032
- Table 62: Global Operational Analytics Software in the Healthcare Industry Volume K Unit Forecast, by Type 2019 & 2032
- Table 63: Global Operational Analytics Software in the Healthcare Industry Revenue Million Forecast, by Component 2019 & 2032
- Table 64: Global Operational Analytics Software in the Healthcare Industry Volume K Unit Forecast, by Component 2019 & 2032
- Table 65: Global Operational Analytics Software in the Healthcare Industry Revenue Million Forecast, by Deployment 2019 & 2032
- Table 66: Global Operational Analytics Software in the Healthcare Industry Volume K Unit Forecast, by Deployment 2019 & 2032
- Table 67: Global Operational Analytics Software in the Healthcare Industry Revenue Million Forecast, by En User 2019 & 2032
- Table 68: Global Operational Analytics Software in the Healthcare Industry Volume K Unit Forecast, by En User 2019 & 2032
- Table 69: Global Operational Analytics Software in the Healthcare Industry Revenue Million Forecast, by Country 2019 & 2032
- Table 70: Global Operational Analytics Software in the Healthcare Industry Volume K Unit Forecast, by Country 2019 & 2032
- Table 71: China Operational Analytics Software in the Healthcare Industry Revenue (Million) Forecast, by Application 2019 & 2032
- Table 72: China Operational Analytics Software in the Healthcare Industry Volume (K Unit) Forecast, by Application 2019 & 2032
- Table 73: Japan Operational Analytics Software in the Healthcare Industry Revenue (Million) Forecast, by Application 2019 & 2032
- Table 74: Japan Operational Analytics Software in the Healthcare Industry Volume (K Unit) Forecast, by Application 2019 & 2032
- Table 75: India Operational Analytics Software in the Healthcare Industry Revenue (Million) Forecast, by Application 2019 & 2032
- Table 76: India Operational Analytics Software in the Healthcare Industry Volume (K Unit) Forecast, by Application 2019 & 2032
- Table 77: Australia Operational Analytics Software in the Healthcare Industry Revenue (Million) Forecast, by Application 2019 & 2032
- Table 78: Australia Operational Analytics Software in the Healthcare Industry Volume (K Unit) Forecast, by Application 2019 & 2032
- Table 79: South Korea Operational Analytics Software in the Healthcare Industry Revenue (Million) Forecast, by Application 2019 & 2032
- Table 80: South Korea Operational Analytics Software in the Healthcare Industry Volume (K Unit) Forecast, by Application 2019 & 2032
- Table 81: Rest of Asia Pacific Operational Analytics Software in the Healthcare Industry Revenue (Million) Forecast, by Application 2019 & 2032
- Table 82: Rest of Asia Pacific Operational Analytics Software in the Healthcare Industry Volume (K Unit) Forecast, by Application 2019 & 2032
- Table 83: Global Operational Analytics Software in the Healthcare Industry Revenue Million Forecast, by Type 2019 & 2032
- Table 84: Global Operational Analytics Software in the Healthcare Industry Volume K Unit Forecast, by Type 2019 & 2032
- Table 85: Global Operational Analytics Software in the Healthcare Industry Revenue Million Forecast, by Component 2019 & 2032
- Table 86: Global Operational Analytics Software in the Healthcare Industry Volume K Unit Forecast, by Component 2019 & 2032
- Table 87: Global Operational Analytics Software in the Healthcare Industry Revenue Million Forecast, by Deployment 2019 & 2032
- Table 88: Global Operational Analytics Software in the Healthcare Industry Volume K Unit Forecast, by Deployment 2019 & 2032
- Table 89: Global Operational Analytics Software in the Healthcare Industry Revenue Million Forecast, by En User 2019 & 2032
- Table 90: Global Operational Analytics Software in the Healthcare Industry Volume K Unit Forecast, by En User 2019 & 2032
- Table 91: Global Operational Analytics Software in the Healthcare Industry Revenue Million Forecast, by Country 2019 & 2032
- Table 92: Global Operational Analytics Software in the Healthcare Industry Volume K Unit Forecast, by Country 2019 & 2032
- Table 93: GCC Operational Analytics Software in the Healthcare Industry Revenue (Million) Forecast, by Application 2019 & 2032
- Table 94: GCC Operational Analytics Software in the Healthcare Industry Volume (K Unit) Forecast, by Application 2019 & 2032
- Table 95: South Africa Operational Analytics Software in the Healthcare Industry Revenue (Million) Forecast, by Application 2019 & 2032
- Table 96: South Africa Operational Analytics Software in the Healthcare Industry Volume (K Unit) Forecast, by Application 2019 & 2032
- Table 97: Rest of Middle East and Africa Operational Analytics Software in the Healthcare Industry Revenue (Million) Forecast, by Application 2019 & 2032
- Table 98: Rest of Middle East and Africa Operational Analytics Software in the Healthcare Industry Volume (K Unit) Forecast, by Application 2019 & 2032
- Table 99: Global Operational Analytics Software in the Healthcare Industry Revenue Million Forecast, by Type 2019 & 2032
- Table 100: Global Operational Analytics Software in the Healthcare Industry Volume K Unit Forecast, by Type 2019 & 2032
- Table 101: Global Operational Analytics Software in the Healthcare Industry Revenue Million Forecast, by Component 2019 & 2032
- Table 102: Global Operational Analytics Software in the Healthcare Industry Volume K Unit Forecast, by Component 2019 & 2032
- Table 103: Global Operational Analytics Software in the Healthcare Industry Revenue Million Forecast, by Deployment 2019 & 2032
- Table 104: Global Operational Analytics Software in the Healthcare Industry Volume K Unit Forecast, by Deployment 2019 & 2032
- Table 105: Global Operational Analytics Software in the Healthcare Industry Revenue Million Forecast, by En User 2019 & 2032
- Table 106: Global Operational Analytics Software in the Healthcare Industry Volume K Unit Forecast, by En User 2019 & 2032
- Table 107: Global Operational Analytics Software in the Healthcare Industry Revenue Million Forecast, by Country 2019 & 2032
- Table 108: Global Operational Analytics Software in the Healthcare Industry Volume K Unit Forecast, by Country 2019 & 2032
- Table 109: Brazil Operational Analytics Software in the Healthcare Industry Revenue (Million) Forecast, by Application 2019 & 2032
- Table 110: Brazil Operational Analytics Software in the Healthcare Industry Volume (K Unit) Forecast, by Application 2019 & 2032
- Table 111: Argentina Operational Analytics Software in the Healthcare Industry Revenue (Million) Forecast, by Application 2019 & 2032
- Table 112: Argentina Operational Analytics Software in the Healthcare Industry Volume (K Unit) Forecast, by Application 2019 & 2032
- Table 113: Rest of South America Operational Analytics Software in the Healthcare Industry Revenue (Million) Forecast, by Application 2019 & 2032
- Table 114: Rest of South America Operational Analytics Software in the Healthcare Industry Volume (K Unit) Forecast, by Application 2019 & 2032
Frequently Asked Questions
1. What is the projected Compound Annual Growth Rate (CAGR) of the Operational Analytics Software in the Healthcare Industry?
The projected CAGR is approximately 13.38%.
2. Which companies are prominent players in the Operational Analytics Software in the Healthcare Industry?
Key companies in the market include MedeAnalytics Inc, Cotiviti Inc, MERATIVE (IBM Watson), Oracle Corporation (Cerner Corporation), Wipro limited, Vizient Inc, Inovalon Inc , Veradigm LLC (Allscripts Healthcare Solutions Inc ), Health Catalyst Inc, CVS Health Corporation, Optum Inc, McKesson Corporation.
3. What are the main segments of the Operational Analytics Software in the Healthcare Industry?
The market segments include Type, Component, Deployment, En User.
4. Can you provide details about the market size?
The market size is estimated to be USD 12.13 Million as of 2022.
5. What are some drivers contributing to market growth?
Increasing Demand for Value-Based Care (VBC); Rising Need to Analyze the Collected Healthcare Data; Rising Awareness regarding Healthcare Standards and Improving Technologies.
6. What are the notable trends driving market growth?
Software Component is Expected to Witness Significant Growth Over a Forecast Period..
7. Are there any restraints impacting market growth?
Concerns regarding Data Privacy and Security; Lack of Trained IT Professionals in Healthcare.
8. Can you provide examples of recent developments in the market?
August 2023: M3, Inc. acquired FrogwellCorporation, which is a Salesforce consulting service provider. M3 is a specialized web portal for medical professionals that delivers healthcare-related information to its 320,000+ physician members in Japan.
9. What pricing options are available for accessing the report?
Pricing options include single-user, multi-user, and enterprise licenses priced at USD 4750, USD 5250, and USD 8750 respectively.
10. Is the market size provided in terms of value or volume?
The market size is provided in terms of value, measured in Million and volume, measured in K Unit.
11. Are there any specific market keywords associated with the report?
Yes, the market keyword associated with the report is "Operational Analytics Software in the Healthcare Industry," which aids in identifying and referencing the specific market segment covered.
12. How do I determine which pricing option suits my needs best?
The pricing options vary based on user requirements and access needs. Individual users may opt for single-user licenses, while businesses requiring broader access may choose multi-user or enterprise licenses for cost-effective access to the report.
13. Are there any additional resources or data provided in the Operational Analytics Software in the Healthcare Industry report?
While the report offers comprehensive insights, it's advisable to review the specific contents or supplementary materials provided to ascertain if additional resources or data are available.
14. How can I stay updated on further developments or reports in the Operational Analytics Software in the Healthcare Industry?
To stay informed about further developments, trends, and reports in the Operational Analytics Software in the Healthcare Industry, consider subscribing to industry newsletters, following relevant companies and organizations, or regularly checking reputable industry news sources and publications.
Methodology
Step 1 - Identification of Relevant Samples Size from Population Database


Step 2 - Approaches for Defining Global Market Size (Value, Volume* & Price*)

Note*: In applicable scenarios
Step 3 - Data Sources
Primary Research
- Web Analytics
- Survey Reports
- Research Institute
- Latest Research Reports
- Opinion Leaders
Secondary Research
- Annual Reports
- White Paper
- Latest Press Release
- Industry Association
- Paid Database
- Investor Presentations

Step 4 - Data Triangulation
Involves using different sources of information in order to increase the validity of a study
These sources are likely to be stakeholders in a program - participants, other researchers, program staff, other community members, and so on.
Then we put all data in single framework & apply various statistical tools to find out the dynamic on the market.
During the analysis stage, feedback from the stakeholder groups would be compared to determine areas of agreement as well as areas of divergence


