
Key Insights
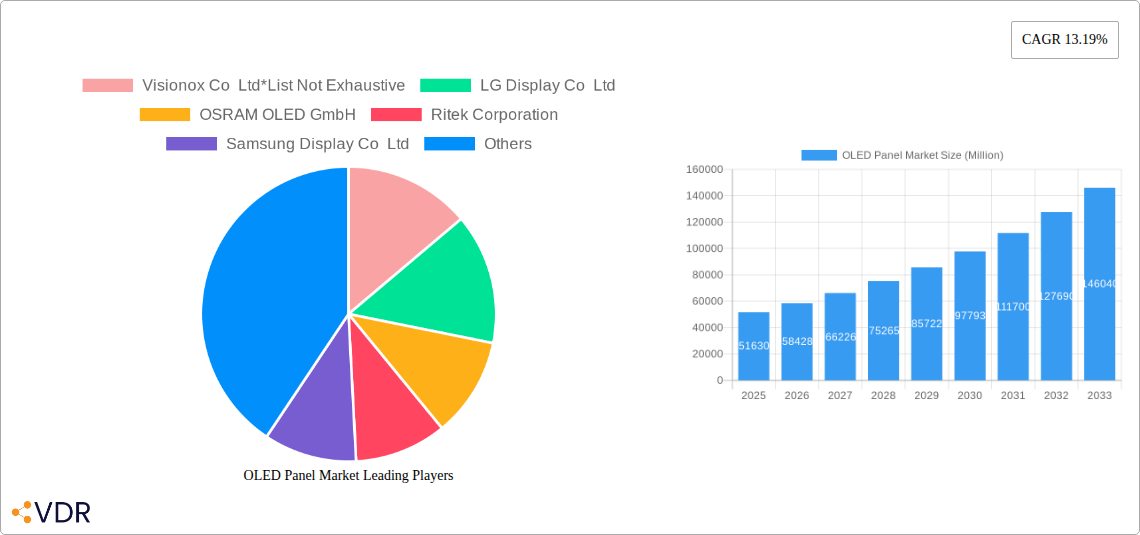
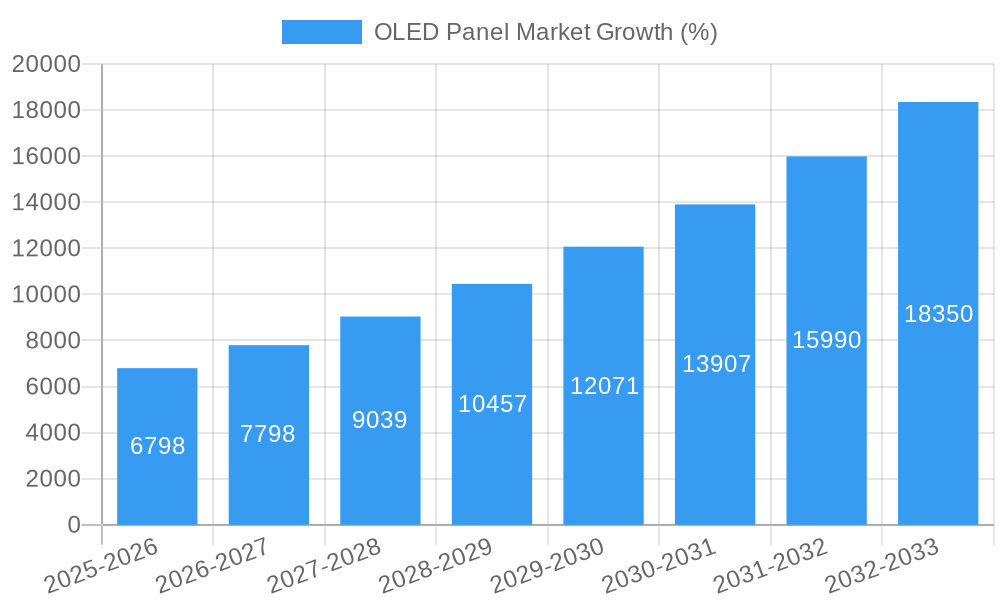
The OLED panel market is experiencing robust growth, projected to reach a market size of $51.63 billion in 2025 and exhibiting a Compound Annual Growth Rate (CAGR) of 13.19% from 2025 to 2033. This expansion is driven by several key factors. The increasing demand for high-resolution, energy-efficient displays in smartphones, tablets, and televisions is a primary driver. Furthermore, the automotive industry's adoption of OLED technology for instrument panels and infotainment systems is significantly contributing to market growth. The rising popularity of wearable devices and the emergence of innovative applications in healthcare and home appliances are also fueling market expansion. Technological advancements, such as the development of flexible and transparent OLED panels, are further enhancing the market appeal. Competition among key players like Samsung Display, LG Display, and Visionox is fostering innovation and driving down costs, making OLED technology more accessible to a wider range of applications.
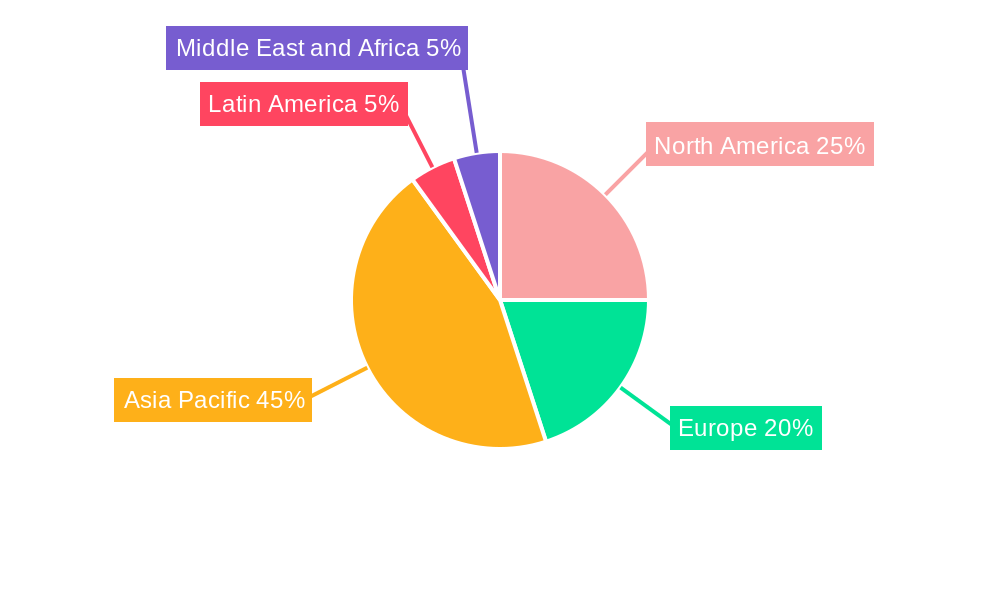
Segment-wise analysis reveals that large-sized OLED panels dominate the market, primarily due to their adoption in premium televisions. However, the medium and small-sized segments are also witnessing considerable growth, driven by the booming smartphone and wearable markets. AMOLED technology holds a significant market share compared to PMOLED, owing to its superior performance characteristics. Geographically, the Asia-Pacific region is currently the largest market, with China and South Korea as major manufacturing hubs and consumption centers. However, North America and Europe are expected to experience strong growth in the coming years due to increasing consumer demand and technological advancements in these regions. While the market faces restraints such as the relatively higher production costs compared to LCDs, ongoing technological improvements and economies of scale are expected to mitigate these challenges in the long term.
OLED Panel Market: A Comprehensive Market Report (2019-2033)
This in-depth report provides a comprehensive analysis of the OLED Panel market, encompassing market dynamics, growth trends, regional dominance, product landscape, key players, and future outlook. The study period covers 2019-2033, with a base year of 2025 and a forecast period of 2025-2033. The report segments the market by size (small, medium, large), product (mobile & tablet, television, automotive, wearable, other), type (flexible, rigid, transparent), and display address scheme (PMOLED, AMOLED). Expect detailed analysis of market size in Million units.
OLED Panel Market Market Dynamics & Structure
The OLED Panel market exhibits a moderately concentrated structure, with key players like LG Display, Samsung Display, and Visionox commanding significant market share. Technological innovation, particularly in areas like flexible displays and improved brightness, is a primary growth driver. Stringent regulatory frameworks related to energy efficiency and material sourcing impact the industry. Competitive pressure from alternative display technologies like QLED and MicroLED necessitates continuous innovation. Mergers and acquisitions (M&A) activity has been moderate, reflecting strategic moves to consolidate market position and expand product portfolios.
- Market Concentration: Top 5 players hold approximately xx% of the market share (2024).
- Technological Innovation: Focus on higher brightness, improved color accuracy, and flexible/foldable designs.
- Regulatory Frameworks: Emphasis on energy efficiency and sustainable manufacturing practices.
- Competitive Substitutes: QLED, MicroLED, and LCD technologies present competitive challenges.
- M&A Activity: xx major deals observed in the past five years, with a total value of approximately $xx billion.
OLED Panel Market Growth Trends & Insights
The OLED Panel market has witnessed robust growth in recent years, driven by increasing demand for high-resolution displays across various applications. The market size reached xx million units in 2024 and is projected to reach xx million units by 2033, exhibiting a CAGR of xx% during the forecast period. Technological advancements, such as the introduction of META technology by LG Display, are accelerating market penetration. Shifting consumer preferences toward premium displays, coupled with the expansion of high-resolution content consumption, are further fueling growth. The adoption rate of OLED panels in the television segment has increased significantly, while the automotive and wearable segments are emerging as significant growth opportunities.
Dominant Regions, Countries, or Segments in OLED Panel Market
The Asia-Pacific region, particularly South Korea and China, dominates the OLED Panel market, driven by robust manufacturing capabilities and high demand from domestic electronics manufacturers. Within the product segments, Televisions and Mobile & Tablet displays constitute the largest share of the market, followed by Automotive and Wearables which show high growth potential. Large-sized OLED panels are experiencing accelerated growth, fueled by the rising popularity of large-screen televisions and public displays.
- Asia-Pacific: Largest market share due to strong manufacturing base and high consumer demand.
- North America & Europe: Significant markets, driven by the adoption of premium displays in consumer electronics.
- Dominant Segments: Televisions and Mobile & Tablet remain dominant, while Automotive and Wearables show strong growth potential.
- Size Segment Dominance: Large-sized panels are experiencing the fastest growth.
OLED Panel Market Product Landscape
OLED panels are characterized by superior image quality, offering deep blacks, wide color gamuts, and high contrast ratios. Continuous innovation focuses on enhancing brightness, reducing costs, and expanding form factors. Flexible and foldable OLEDs are gaining popularity, particularly in smartphones and wearable devices, while transparent OLEDs are finding niche applications in advanced displays.
Key Drivers, Barriers & Challenges in OLED Panel Market
Key Drivers:
- High demand for premium displays in consumer electronics.
- Technological advancements leading to improved performance and lower costs.
- Expansion into new applications, such as automotive and wearable devices.
Challenges:
- High manufacturing costs compared to alternative display technologies.
- Supply chain disruptions and material shortages.
- Intense competition from established and emerging players.
Emerging Opportunities in OLED Panel Market
Untapped markets in developing economies, coupled with rising disposable incomes, present significant opportunities. Innovation in flexible and transparent OLEDs is opening new avenues in applications like foldable smartphones, augmented reality devices, and smart home appliances. Furthermore, advancements in materials and manufacturing processes are driving cost reduction, making OLED technology more accessible to a broader customer base.
Growth Accelerators in the OLED Panel Market Industry
Technological breakthroughs, such as the development of next-generation materials and efficient manufacturing processes, are accelerating market growth. Strategic partnerships between panel manufacturers and device makers, such as that between Samsung Display and Sony, ensure a consistent supply chain. Market expansion strategies focusing on emerging markets and diverse applications further drive industry progress.
Key Players Shaping the OLED Panel Market Market
- Visionox Co Ltd
- LG Display Co Ltd
- OSRAM OLED GmbH
- Ritek Corporation
- Samsung Display Co Ltd
- Raystar Optronics Inc
- Winstar Display Co Ltd
- Pioneer Corporation
- WiseChip Semiconductor Inc
- Sony Corporation
Notable Milestones in OLED Panel Market Sector
- January 2023: LG Display unveils its third-generation OLED TV panel with META Technology, boasting 60% brighter images and 30% wider viewing angles.
- January 2023: Samsung Display announces production of a 77-inch Quantum Dot OLED panel for Samsung Electronics, Sony, and other potential clients.
- June 2022: LG Electronics launches the CineBeam Projector and UltraFine Display OLED in India, showcasing cutting-edge features and design.
In-Depth OLED Panel Market Market Outlook
The OLED Panel market is poised for significant growth in the coming years, driven by continuous technological advancements, expanding applications, and increasing consumer demand for high-quality displays. Strategic partnerships and investments in research and development will further fuel market expansion. The emergence of innovative applications and the penetration into new markets will unlock substantial growth opportunities for players in the industry.
OLED Panel Market Segmentation
-
1. Type
- 1.1. Flexible
- 1.2. Rigid
- 1.3. Transparent
-
2. Display Address Scheme
- 2.1. PMOLED Display
- 2.2. AMOLED Display
-
3. Size
- 3.1. Small-sized OLED Panel
- 3.2. Medium-sized OLED Panel
- 3.3. Large-sized OLED Panel
-
4. Product
- 4.1. Mobile and Tablet
- 4.2. Television
- 4.3. Automotive
- 4.4. Wearable
- 4.5. Other Pr
OLED Panel Market Segmentation By Geography
-
1. North America
- 1.1. United States
- 1.2. Canada
-
2. Europe
- 2.1. United Kingdom
- 2.2. Germany
- 2.3. Italy
- 2.4. France
-
3. Asia
- 3.1. China
- 3.2. India
- 3.3. Japan
- 3.4. South Korea
- 4. Australia and New Zealand
-
5. Latin America
- 5.1. Brazil
- 5.2. Mexico
- 6. Middle East and Africa
OLED Panel Market REPORT HIGHLIGHTS
| Aspects | Details |
|---|---|
| Study Period | 2019-2033 |
| Base Year | 2024 |
| Estimated Year | 2025 |
| Forecast Period | 2025-2033 |
| Historical Period | 2019-2024 |
| Growth Rate | CAGR of 13.19% from 2019-2033 |
| Segmentation |
|
Table of Contents
- 1. Introduction
- 1.1. Research Scope
- 1.2. Market Segmentation
- 1.3. Research Methodology
- 1.4. Definitions and Assumptions
- 2. Executive Summary
- 2.1. Introduction
- 3. Market Dynamics
- 3.1. Introduction
- 3.2. Market Drivers
- 3.2.1. Increasing Adoption of OLEDs in Smartphones; Government Support for the Development of OLED Technology in Various Countries
- 3.3. Market Restrains
- 3.3.1. ; High Cost of Implementation and Maintenance
- 3.4. Market Trends
- 3.4.1. AMOLED Display in Smartphone is Expected to Witness High Growth
- 4. Market Factor Analysis
- 4.1. Porters Five Forces
- 4.2. Supply/Value Chain
- 4.3. PESTEL analysis
- 4.4. Market Entropy
- 4.5. Patent/Trademark Analysis
- 5. Global OLED Panel Market Analysis, Insights and Forecast, 2019-2031
- 5.1. Market Analysis, Insights and Forecast - by Type
- 5.1.1. Flexible
- 5.1.2. Rigid
- 5.1.3. Transparent
- 5.2. Market Analysis, Insights and Forecast - by Display Address Scheme
- 5.2.1. PMOLED Display
- 5.2.2. AMOLED Display
- 5.3. Market Analysis, Insights and Forecast - by Size
- 5.3.1. Small-sized OLED Panel
- 5.3.2. Medium-sized OLED Panel
- 5.3.3. Large-sized OLED Panel
- 5.4. Market Analysis, Insights and Forecast - by Product
- 5.4.1. Mobile and Tablet
- 5.4.2. Television
- 5.4.3. Automotive
- 5.4.4. Wearable
- 5.4.5. Other Pr
- 5.5. Market Analysis, Insights and Forecast - by Region
- 5.5.1. North America
- 5.5.2. Europe
- 5.5.3. Asia
- 5.5.4. Australia and New Zealand
- 5.5.5. Latin America
- 5.5.6. Middle East and Africa
- 5.1. Market Analysis, Insights and Forecast - by Type
- 6. North America OLED Panel Market Analysis, Insights and Forecast, 2019-2031
- 6.1. Market Analysis, Insights and Forecast - by Type
- 6.1.1. Flexible
- 6.1.2. Rigid
- 6.1.3. Transparent
- 6.2. Market Analysis, Insights and Forecast - by Display Address Scheme
- 6.2.1. PMOLED Display
- 6.2.2. AMOLED Display
- 6.3. Market Analysis, Insights and Forecast - by Size
- 6.3.1. Small-sized OLED Panel
- 6.3.2. Medium-sized OLED Panel
- 6.3.3. Large-sized OLED Panel
- 6.4. Market Analysis, Insights and Forecast - by Product
- 6.4.1. Mobile and Tablet
- 6.4.2. Television
- 6.4.3. Automotive
- 6.4.4. Wearable
- 6.4.5. Other Pr
- 6.1. Market Analysis, Insights and Forecast - by Type
- 7. Europe OLED Panel Market Analysis, Insights and Forecast, 2019-2031
- 7.1. Market Analysis, Insights and Forecast - by Type
- 7.1.1. Flexible
- 7.1.2. Rigid
- 7.1.3. Transparent
- 7.2. Market Analysis, Insights and Forecast - by Display Address Scheme
- 7.2.1. PMOLED Display
- 7.2.2. AMOLED Display
- 7.3. Market Analysis, Insights and Forecast - by Size
- 7.3.1. Small-sized OLED Panel
- 7.3.2. Medium-sized OLED Panel
- 7.3.3. Large-sized OLED Panel
- 7.4. Market Analysis, Insights and Forecast - by Product
- 7.4.1. Mobile and Tablet
- 7.4.2. Television
- 7.4.3. Automotive
- 7.4.4. Wearable
- 7.4.5. Other Pr
- 7.1. Market Analysis, Insights and Forecast - by Type
- 8. Asia OLED Panel Market Analysis, Insights and Forecast, 2019-2031
- 8.1. Market Analysis, Insights and Forecast - by Type
- 8.1.1. Flexible
- 8.1.2. Rigid
- 8.1.3. Transparent
- 8.2. Market Analysis, Insights and Forecast - by Display Address Scheme
- 8.2.1. PMOLED Display
- 8.2.2. AMOLED Display
- 8.3. Market Analysis, Insights and Forecast - by Size
- 8.3.1. Small-sized OLED Panel
- 8.3.2. Medium-sized OLED Panel
- 8.3.3. Large-sized OLED Panel
- 8.4. Market Analysis, Insights and Forecast - by Product
- 8.4.1. Mobile and Tablet
- 8.4.2. Television
- 8.4.3. Automotive
- 8.4.4. Wearable
- 8.4.5. Other Pr
- 8.1. Market Analysis, Insights and Forecast - by Type
- 9. Australia and New Zealand OLED Panel Market Analysis, Insights and Forecast, 2019-2031
- 9.1. Market Analysis, Insights and Forecast - by Type
- 9.1.1. Flexible
- 9.1.2. Rigid
- 9.1.3. Transparent
- 9.2. Market Analysis, Insights and Forecast - by Display Address Scheme
- 9.2.1. PMOLED Display
- 9.2.2. AMOLED Display
- 9.3. Market Analysis, Insights and Forecast - by Size
- 9.3.1. Small-sized OLED Panel
- 9.3.2. Medium-sized OLED Panel
- 9.3.3. Large-sized OLED Panel
- 9.4. Market Analysis, Insights and Forecast - by Product
- 9.4.1. Mobile and Tablet
- 9.4.2. Television
- 9.4.3. Automotive
- 9.4.4. Wearable
- 9.4.5. Other Pr
- 9.1. Market Analysis, Insights and Forecast - by Type
- 10. Latin America OLED Panel Market Analysis, Insights and Forecast, 2019-2031
- 10.1. Market Analysis, Insights and Forecast - by Type
- 10.1.1. Flexible
- 10.1.2. Rigid
- 10.1.3. Transparent
- 10.2. Market Analysis, Insights and Forecast - by Display Address Scheme
- 10.2.1. PMOLED Display
- 10.2.2. AMOLED Display
- 10.3. Market Analysis, Insights and Forecast - by Size
- 10.3.1. Small-sized OLED Panel
- 10.3.2. Medium-sized OLED Panel
- 10.3.3. Large-sized OLED Panel
- 10.4. Market Analysis, Insights and Forecast - by Product
- 10.4.1. Mobile and Tablet
- 10.4.2. Television
- 10.4.3. Automotive
- 10.4.4. Wearable
- 10.4.5. Other Pr
- 10.1. Market Analysis, Insights and Forecast - by Type
- 11. Middle East and Africa OLED Panel Market Analysis, Insights and Forecast, 2019-2031
- 11.1. Market Analysis, Insights and Forecast - by Type
- 11.1.1. Flexible
- 11.1.2. Rigid
- 11.1.3. Transparent
- 11.2. Market Analysis, Insights and Forecast - by Display Address Scheme
- 11.2.1. PMOLED Display
- 11.2.2. AMOLED Display
- 11.3. Market Analysis, Insights and Forecast - by Size
- 11.3.1. Small-sized OLED Panel
- 11.3.2. Medium-sized OLED Panel
- 11.3.3. Large-sized OLED Panel
- 11.4. Market Analysis, Insights and Forecast - by Product
- 11.4.1. Mobile and Tablet
- 11.4.2. Television
- 11.4.3. Automotive
- 11.4.4. Wearable
- 11.4.5. Other Pr
- 11.1. Market Analysis, Insights and Forecast - by Type
- 12. North America OLED Panel Market Analysis, Insights and Forecast, 2019-2031
- 12.1. Market Analysis, Insights and Forecast - By Country/Sub-region
- 12.1.1 United States
- 12.1.2 Canada
- 13. Europe OLED Panel Market Analysis, Insights and Forecast, 2019-2031
- 13.1. Market Analysis, Insights and Forecast - By Country/Sub-region
- 13.1.1 United Kingdom
- 13.1.2 Germany
- 13.1.3 Italy
- 13.1.4 France
- 13.1.5 Rest of Europe
- 14. Asia Pacific OLED Panel Market Analysis, Insights and Forecast, 2019-2031
- 14.1. Market Analysis, Insights and Forecast - By Country/Sub-region
- 14.1.1 China
- 14.1.2 India
- 14.1.3 Japan
- 14.1.4 South Korea
- 14.1.5 Australia and New Zealand
- 14.1.6 Rest of Asia Pacific
- 15. Latin America OLED Panel Market Analysis, Insights and Forecast, 2019-2031
- 15.1. Market Analysis, Insights and Forecast - By Country/Sub-region
- 15.1.1 Brazil
- 15.1.2 Mexico
- 15.1.3 Rest of Latin America
- 16. Middle East and Africa OLED Panel Market Analysis, Insights and Forecast, 2019-2031
- 16.1. Market Analysis, Insights and Forecast - By Country/Sub-region
- 16.1.1.
- 17. Competitive Analysis
- 17.1. Global Market Share Analysis 2024
- 17.2. Company Profiles
- 17.2.1 Visionox Co Ltd*List Not Exhaustive
- 17.2.1.1. Overview
- 17.2.1.2. Products
- 17.2.1.3. SWOT Analysis
- 17.2.1.4. Recent Developments
- 17.2.1.5. Financials (Based on Availability)
- 17.2.2 LG Display Co Ltd
- 17.2.2.1. Overview
- 17.2.2.2. Products
- 17.2.2.3. SWOT Analysis
- 17.2.2.4. Recent Developments
- 17.2.2.5. Financials (Based on Availability)
- 17.2.3 OSRAM OLED GmbH
- 17.2.3.1. Overview
- 17.2.3.2. Products
- 17.2.3.3. SWOT Analysis
- 17.2.3.4. Recent Developments
- 17.2.3.5. Financials (Based on Availability)
- 17.2.4 Ritek Corporation
- 17.2.4.1. Overview
- 17.2.4.2. Products
- 17.2.4.3. SWOT Analysis
- 17.2.4.4. Recent Developments
- 17.2.4.5. Financials (Based on Availability)
- 17.2.5 Samsung Display Co Ltd
- 17.2.5.1. Overview
- 17.2.5.2. Products
- 17.2.5.3. SWOT Analysis
- 17.2.5.4. Recent Developments
- 17.2.5.5. Financials (Based on Availability)
- 17.2.6 Raystar Optronics Inc
- 17.2.6.1. Overview
- 17.2.6.2. Products
- 17.2.6.3. SWOT Analysis
- 17.2.6.4. Recent Developments
- 17.2.6.5. Financials (Based on Availability)
- 17.2.7 Winstar Display Co Ltd
- 17.2.7.1. Overview
- 17.2.7.2. Products
- 17.2.7.3. SWOT Analysis
- 17.2.7.4. Recent Developments
- 17.2.7.5. Financials (Based on Availability)
- 17.2.8 Pioneer Corporation
- 17.2.8.1. Overview
- 17.2.8.2. Products
- 17.2.8.3. SWOT Analysis
- 17.2.8.4. Recent Developments
- 17.2.8.5. Financials (Based on Availability)
- 17.2.9 WiseChip Semiconductor Inc
- 17.2.9.1. Overview
- 17.2.9.2. Products
- 17.2.9.3. SWOT Analysis
- 17.2.9.4. Recent Developments
- 17.2.9.5. Financials (Based on Availability)
- 17.2.10 Sony Corporation
- 17.2.10.1. Overview
- 17.2.10.2. Products
- 17.2.10.3. SWOT Analysis
- 17.2.10.4. Recent Developments
- 17.2.10.5. Financials (Based on Availability)
- 17.2.1 Visionox Co Ltd*List Not Exhaustive
List of Figures
- Figure 1: Global OLED Panel Market Revenue Breakdown (Million, %) by Region 2024 & 2032
- Figure 2: North America OLED Panel Market Revenue (Million), by Country 2024 & 2032
- Figure 3: North America OLED Panel Market Revenue Share (%), by Country 2024 & 2032
- Figure 4: Europe OLED Panel Market Revenue (Million), by Country 2024 & 2032
- Figure 5: Europe OLED Panel Market Revenue Share (%), by Country 2024 & 2032
- Figure 6: Asia Pacific OLED Panel Market Revenue (Million), by Country 2024 & 2032
- Figure 7: Asia Pacific OLED Panel Market Revenue Share (%), by Country 2024 & 2032
- Figure 8: Latin America OLED Panel Market Revenue (Million), by Country 2024 & 2032
- Figure 9: Latin America OLED Panel Market Revenue Share (%), by Country 2024 & 2032
- Figure 10: Middle East and Africa OLED Panel Market Revenue (Million), by Country 2024 & 2032
- Figure 11: Middle East and Africa OLED Panel Market Revenue Share (%), by Country 2024 & 2032
- Figure 12: North America OLED Panel Market Revenue (Million), by Type 2024 & 2032
- Figure 13: North America OLED Panel Market Revenue Share (%), by Type 2024 & 2032
- Figure 14: North America OLED Panel Market Revenue (Million), by Display Address Scheme 2024 & 2032
- Figure 15: North America OLED Panel Market Revenue Share (%), by Display Address Scheme 2024 & 2032
- Figure 16: North America OLED Panel Market Revenue (Million), by Size 2024 & 2032
- Figure 17: North America OLED Panel Market Revenue Share (%), by Size 2024 & 2032
- Figure 18: North America OLED Panel Market Revenue (Million), by Product 2024 & 2032
- Figure 19: North America OLED Panel Market Revenue Share (%), by Product 2024 & 2032
- Figure 20: North America OLED Panel Market Revenue (Million), by Country 2024 & 2032
- Figure 21: North America OLED Panel Market Revenue Share (%), by Country 2024 & 2032
- Figure 22: Europe OLED Panel Market Revenue (Million), by Type 2024 & 2032
- Figure 23: Europe OLED Panel Market Revenue Share (%), by Type 2024 & 2032
- Figure 24: Europe OLED Panel Market Revenue (Million), by Display Address Scheme 2024 & 2032
- Figure 25: Europe OLED Panel Market Revenue Share (%), by Display Address Scheme 2024 & 2032
- Figure 26: Europe OLED Panel Market Revenue (Million), by Size 2024 & 2032
- Figure 27: Europe OLED Panel Market Revenue Share (%), by Size 2024 & 2032
- Figure 28: Europe OLED Panel Market Revenue (Million), by Product 2024 & 2032
- Figure 29: Europe OLED Panel Market Revenue Share (%), by Product 2024 & 2032
- Figure 30: Europe OLED Panel Market Revenue (Million), by Country 2024 & 2032
- Figure 31: Europe OLED Panel Market Revenue Share (%), by Country 2024 & 2032
- Figure 32: Asia OLED Panel Market Revenue (Million), by Type 2024 & 2032
- Figure 33: Asia OLED Panel Market Revenue Share (%), by Type 2024 & 2032
- Figure 34: Asia OLED Panel Market Revenue (Million), by Display Address Scheme 2024 & 2032
- Figure 35: Asia OLED Panel Market Revenue Share (%), by Display Address Scheme 2024 & 2032
- Figure 36: Asia OLED Panel Market Revenue (Million), by Size 2024 & 2032
- Figure 37: Asia OLED Panel Market Revenue Share (%), by Size 2024 & 2032
- Figure 38: Asia OLED Panel Market Revenue (Million), by Product 2024 & 2032
- Figure 39: Asia OLED Panel Market Revenue Share (%), by Product 2024 & 2032
- Figure 40: Asia OLED Panel Market Revenue (Million), by Country 2024 & 2032
- Figure 41: Asia OLED Panel Market Revenue Share (%), by Country 2024 & 2032
- Figure 42: Australia and New Zealand OLED Panel Market Revenue (Million), by Type 2024 & 2032
- Figure 43: Australia and New Zealand OLED Panel Market Revenue Share (%), by Type 2024 & 2032
- Figure 44: Australia and New Zealand OLED Panel Market Revenue (Million), by Display Address Scheme 2024 & 2032
- Figure 45: Australia and New Zealand OLED Panel Market Revenue Share (%), by Display Address Scheme 2024 & 2032
- Figure 46: Australia and New Zealand OLED Panel Market Revenue (Million), by Size 2024 & 2032
- Figure 47: Australia and New Zealand OLED Panel Market Revenue Share (%), by Size 2024 & 2032
- Figure 48: Australia and New Zealand OLED Panel Market Revenue (Million), by Product 2024 & 2032
- Figure 49: Australia and New Zealand OLED Panel Market Revenue Share (%), by Product 2024 & 2032
- Figure 50: Australia and New Zealand OLED Panel Market Revenue (Million), by Country 2024 & 2032
- Figure 51: Australia and New Zealand OLED Panel Market Revenue Share (%), by Country 2024 & 2032
- Figure 52: Latin America OLED Panel Market Revenue (Million), by Type 2024 & 2032
- Figure 53: Latin America OLED Panel Market Revenue Share (%), by Type 2024 & 2032
- Figure 54: Latin America OLED Panel Market Revenue (Million), by Display Address Scheme 2024 & 2032
- Figure 55: Latin America OLED Panel Market Revenue Share (%), by Display Address Scheme 2024 & 2032
- Figure 56: Latin America OLED Panel Market Revenue (Million), by Size 2024 & 2032
- Figure 57: Latin America OLED Panel Market Revenue Share (%), by Size 2024 & 2032
- Figure 58: Latin America OLED Panel Market Revenue (Million), by Product 2024 & 2032
- Figure 59: Latin America OLED Panel Market Revenue Share (%), by Product 2024 & 2032
- Figure 60: Latin America OLED Panel Market Revenue (Million), by Country 2024 & 2032
- Figure 61: Latin America OLED Panel Market Revenue Share (%), by Country 2024 & 2032
- Figure 62: Middle East and Africa OLED Panel Market Revenue (Million), by Type 2024 & 2032
- Figure 63: Middle East and Africa OLED Panel Market Revenue Share (%), by Type 2024 & 2032
- Figure 64: Middle East and Africa OLED Panel Market Revenue (Million), by Display Address Scheme 2024 & 2032
- Figure 65: Middle East and Africa OLED Panel Market Revenue Share (%), by Display Address Scheme 2024 & 2032
- Figure 66: Middle East and Africa OLED Panel Market Revenue (Million), by Size 2024 & 2032
- Figure 67: Middle East and Africa OLED Panel Market Revenue Share (%), by Size 2024 & 2032
- Figure 68: Middle East and Africa OLED Panel Market Revenue (Million), by Product 2024 & 2032
- Figure 69: Middle East and Africa OLED Panel Market Revenue Share (%), by Product 2024 & 2032
- Figure 70: Middle East and Africa OLED Panel Market Revenue (Million), by Country 2024 & 2032
- Figure 71: Middle East and Africa OLED Panel Market Revenue Share (%), by Country 2024 & 2032
List of Tables
- Table 1: Global OLED Panel Market Revenue Million Forecast, by Region 2019 & 2032
- Table 2: Global OLED Panel Market Revenue Million Forecast, by Type 2019 & 2032
- Table 3: Global OLED Panel Market Revenue Million Forecast, by Display Address Scheme 2019 & 2032
- Table 4: Global OLED Panel Market Revenue Million Forecast, by Size 2019 & 2032
- Table 5: Global OLED Panel Market Revenue Million Forecast, by Product 2019 & 2032
- Table 6: Global OLED Panel Market Revenue Million Forecast, by Region 2019 & 2032
- Table 7: Global OLED Panel Market Revenue Million Forecast, by Country 2019 & 2032
- Table 8: United States OLED Panel Market Revenue (Million) Forecast, by Application 2019 & 2032
- Table 9: Canada OLED Panel Market Revenue (Million) Forecast, by Application 2019 & 2032
- Table 10: Global OLED Panel Market Revenue Million Forecast, by Country 2019 & 2032
- Table 11: United Kingdom OLED Panel Market Revenue (Million) Forecast, by Application 2019 & 2032
- Table 12: Germany OLED Panel Market Revenue (Million) Forecast, by Application 2019 & 2032
- Table 13: Italy OLED Panel Market Revenue (Million) Forecast, by Application 2019 & 2032
- Table 14: France OLED Panel Market Revenue (Million) Forecast, by Application 2019 & 2032
- Table 15: Rest of Europe OLED Panel Market Revenue (Million) Forecast, by Application 2019 & 2032
- Table 16: Global OLED Panel Market Revenue Million Forecast, by Country 2019 & 2032
- Table 17: China OLED Panel Market Revenue (Million) Forecast, by Application 2019 & 2032
- Table 18: India OLED Panel Market Revenue (Million) Forecast, by Application 2019 & 2032
- Table 19: Japan OLED Panel Market Revenue (Million) Forecast, by Application 2019 & 2032
- Table 20: South Korea OLED Panel Market Revenue (Million) Forecast, by Application 2019 & 2032
- Table 21: Australia and New Zealand OLED Panel Market Revenue (Million) Forecast, by Application 2019 & 2032
- Table 22: Rest of Asia Pacific OLED Panel Market Revenue (Million) Forecast, by Application 2019 & 2032
- Table 23: Global OLED Panel Market Revenue Million Forecast, by Country 2019 & 2032
- Table 24: Brazil OLED Panel Market Revenue (Million) Forecast, by Application 2019 & 2032
- Table 25: Mexico OLED Panel Market Revenue (Million) Forecast, by Application 2019 & 2032
- Table 26: Rest of Latin America OLED Panel Market Revenue (Million) Forecast, by Application 2019 & 2032
- Table 27: Global OLED Panel Market Revenue Million Forecast, by Country 2019 & 2032
- Table 28: OLED Panel Market Revenue (Million) Forecast, by Application 2019 & 2032
- Table 29: Global OLED Panel Market Revenue Million Forecast, by Type 2019 & 2032
- Table 30: Global OLED Panel Market Revenue Million Forecast, by Display Address Scheme 2019 & 2032
- Table 31: Global OLED Panel Market Revenue Million Forecast, by Size 2019 & 2032
- Table 32: Global OLED Panel Market Revenue Million Forecast, by Product 2019 & 2032
- Table 33: Global OLED Panel Market Revenue Million Forecast, by Country 2019 & 2032
- Table 34: United States OLED Panel Market Revenue (Million) Forecast, by Application 2019 & 2032
- Table 35: Canada OLED Panel Market Revenue (Million) Forecast, by Application 2019 & 2032
- Table 36: Global OLED Panel Market Revenue Million Forecast, by Type 2019 & 2032
- Table 37: Global OLED Panel Market Revenue Million Forecast, by Display Address Scheme 2019 & 2032
- Table 38: Global OLED Panel Market Revenue Million Forecast, by Size 2019 & 2032
- Table 39: Global OLED Panel Market Revenue Million Forecast, by Product 2019 & 2032
- Table 40: Global OLED Panel Market Revenue Million Forecast, by Country 2019 & 2032
- Table 41: United Kingdom OLED Panel Market Revenue (Million) Forecast, by Application 2019 & 2032
- Table 42: Germany OLED Panel Market Revenue (Million) Forecast, by Application 2019 & 2032
- Table 43: Italy OLED Panel Market Revenue (Million) Forecast, by Application 2019 & 2032
- Table 44: France OLED Panel Market Revenue (Million) Forecast, by Application 2019 & 2032
- Table 45: Global OLED Panel Market Revenue Million Forecast, by Type 2019 & 2032
- Table 46: Global OLED Panel Market Revenue Million Forecast, by Display Address Scheme 2019 & 2032
- Table 47: Global OLED Panel Market Revenue Million Forecast, by Size 2019 & 2032
- Table 48: Global OLED Panel Market Revenue Million Forecast, by Product 2019 & 2032
- Table 49: Global OLED Panel Market Revenue Million Forecast, by Country 2019 & 2032
- Table 50: China OLED Panel Market Revenue (Million) Forecast, by Application 2019 & 2032
- Table 51: India OLED Panel Market Revenue (Million) Forecast, by Application 2019 & 2032
- Table 52: Japan OLED Panel Market Revenue (Million) Forecast, by Application 2019 & 2032
- Table 53: South Korea OLED Panel Market Revenue (Million) Forecast, by Application 2019 & 2032
- Table 54: Global OLED Panel Market Revenue Million Forecast, by Type 2019 & 2032
- Table 55: Global OLED Panel Market Revenue Million Forecast, by Display Address Scheme 2019 & 2032
- Table 56: Global OLED Panel Market Revenue Million Forecast, by Size 2019 & 2032
- Table 57: Global OLED Panel Market Revenue Million Forecast, by Product 2019 & 2032
- Table 58: Global OLED Panel Market Revenue Million Forecast, by Country 2019 & 2032
- Table 59: Global OLED Panel Market Revenue Million Forecast, by Type 2019 & 2032
- Table 60: Global OLED Panel Market Revenue Million Forecast, by Display Address Scheme 2019 & 2032
- Table 61: Global OLED Panel Market Revenue Million Forecast, by Size 2019 & 2032
- Table 62: Global OLED Panel Market Revenue Million Forecast, by Product 2019 & 2032
- Table 63: Global OLED Panel Market Revenue Million Forecast, by Country 2019 & 2032
- Table 64: Brazil OLED Panel Market Revenue (Million) Forecast, by Application 2019 & 2032
- Table 65: Mexico OLED Panel Market Revenue (Million) Forecast, by Application 2019 & 2032
- Table 66: Global OLED Panel Market Revenue Million Forecast, by Type 2019 & 2032
- Table 67: Global OLED Panel Market Revenue Million Forecast, by Display Address Scheme 2019 & 2032
- Table 68: Global OLED Panel Market Revenue Million Forecast, by Size 2019 & 2032
- Table 69: Global OLED Panel Market Revenue Million Forecast, by Product 2019 & 2032
- Table 70: Global OLED Panel Market Revenue Million Forecast, by Country 2019 & 2032
Frequently Asked Questions
1. What is the projected Compound Annual Growth Rate (CAGR) of the OLED Panel Market?
The projected CAGR is approximately 13.19%.
2. Which companies are prominent players in the OLED Panel Market?
Key companies in the market include Visionox Co Ltd*List Not Exhaustive, LG Display Co Ltd, OSRAM OLED GmbH, Ritek Corporation, Samsung Display Co Ltd, Raystar Optronics Inc, Winstar Display Co Ltd, Pioneer Corporation, WiseChip Semiconductor Inc, Sony Corporation.
3. What are the main segments of the OLED Panel Market?
The market segments include Type, Display Address Scheme, Size, Product.
4. Can you provide details about the market size?
The market size is estimated to be USD 51.63 Million as of 2022.
5. What are some drivers contributing to market growth?
Increasing Adoption of OLEDs in Smartphones; Government Support for the Development of OLED Technology in Various Countries.
6. What are the notable trends driving market growth?
AMOLED Display in Smartphone is Expected to Witness High Growth.
7. Are there any restraints impacting market growth?
; High Cost of Implementation and Maintenance.
8. Can you provide examples of recent developments in the market?
January 2023: At CES 2023, LG Display, a pioneer in display technology, unveiled the third-generation OLED TV panel. The latest OLED TV panel from the manufacturer, based on "META Technology," offers the best possible image quality. The company's most recent OLED displays utilize META Technology to produce pictures that are 60% brighter than those produced by standard OLED productions and with viewing angles that are 30% broader.
9. What pricing options are available for accessing the report?
Pricing options include single-user, multi-user, and enterprise licenses priced at USD 4750, USD 5250, and USD 8750 respectively.
10. Is the market size provided in terms of value or volume?
The market size is provided in terms of value, measured in Million.
11. Are there any specific market keywords associated with the report?
Yes, the market keyword associated with the report is "OLED Panel Market," which aids in identifying and referencing the specific market segment covered.
12. How do I determine which pricing option suits my needs best?
The pricing options vary based on user requirements and access needs. Individual users may opt for single-user licenses, while businesses requiring broader access may choose multi-user or enterprise licenses for cost-effective access to the report.
13. Are there any additional resources or data provided in the OLED Panel Market report?
While the report offers comprehensive insights, it's advisable to review the specific contents or supplementary materials provided to ascertain if additional resources or data are available.
14. How can I stay updated on further developments or reports in the OLED Panel Market?
To stay informed about further developments, trends, and reports in the OLED Panel Market, consider subscribing to industry newsletters, following relevant companies and organizations, or regularly checking reputable industry news sources and publications.
Methodology
Step 1 - Identification of Relevant Samples Size from Population Database


Step 2 - Approaches for Defining Global Market Size (Value, Volume* & Price*)

Note*: In applicable scenarios
Step 3 - Data Sources
Primary Research
- Web Analytics
- Survey Reports
- Research Institute
- Latest Research Reports
- Opinion Leaders
Secondary Research
- Annual Reports
- White Paper
- Latest Press Release
- Industry Association
- Paid Database
- Investor Presentations

Step 4 - Data Triangulation
Involves using different sources of information in order to increase the validity of a study
These sources are likely to be stakeholders in a program - participants, other researchers, program staff, other community members, and so on.
Then we put all data in single framework & apply various statistical tools to find out the dynamic on the market.
During the analysis stage, feedback from the stakeholder groups would be compared to determine areas of agreement as well as areas of divergence


