
Key Insights
The Thai oil and gas upstream market, while smaller than global giants, exhibits significant growth potential driven by increasing energy demand and government initiatives promoting energy security. The market is segmented by product (crude oil and natural gas), operation (exploration and production), and technology (conventional and unconventional). While precise market size data for Thailand is unavailable, considering a global CAGR of >3% and regional trends in Southeast Asia, a reasonable estimate for the 2025 market size in Thailand could be placed between $500 million and $1 billion USD, depending on specific exploration and production levels. This estimate considers the influence of factors like increasing domestic consumption, limitations in readily available conventional reserves necessitating investment in unconventional methods, and the ongoing exploration activities by both domestic and international companies. Key drivers include government support for domestic energy production to reduce reliance on imports, increasing industrialization and urbanization boosting energy consumption, and ongoing exploration efforts revealing potentially valuable reserves. However, challenges remain. These include the relatively small size of Thailand's proven reserves compared to regional counterparts, regulatory hurdles, and potential environmental concerns associated with extraction activities. The focus on unconventional resources, such as shale gas, alongside technological advancements in exploration and extraction, will be critical in shaping the market's future trajectory. The presence of established international players like Chevron and TotalEnergies alongside domestic companies like PTT and Bangchak Corporation underscores the market's attractiveness and the ongoing competition.
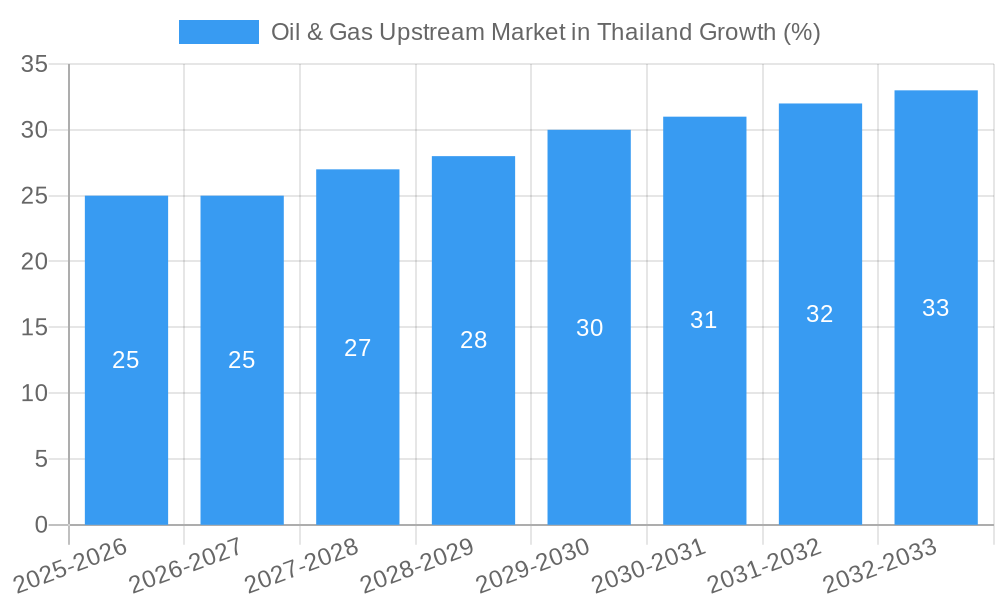
The forecast period (2025-2033) projects moderate but steady growth for the Thai oil and gas upstream market, heavily influenced by successful exploration ventures, technological innovations improving extraction efficiency from existing fields, and government policies. The market is likely to witness increased investment in unconventional resources as conventional reserves deplete. Competition amongst operators will remain intense, with companies vying for exploration licenses and investing in technological improvements to maintain profitability. The Asia-Pacific region's growing energy needs present significant opportunities for growth, but effective risk management, environmental sustainability initiatives and careful regulatory navigation will be crucial for companies operating in this dynamic market. A deeper analysis of specific government policies regarding exploration and production concessions, combined with a more granular understanding of specific reserve estimations, will provide a more accurate market sizing for future projections.
Oil & Gas Upstream Market in Thailand: A Comprehensive Report (2019-2033)
This comprehensive report provides an in-depth analysis of the Oil & Gas Upstream Market in Thailand, covering the period from 2019 to 2033. It examines market dynamics, growth trends, key players, and future opportunities within the Thai oil and gas sector, offering invaluable insights for industry professionals, investors, and policymakers. The report segments the market by product (crude oil, natural gas), operation (exploration, production), and technology (conventional, unconventional), providing a granular understanding of this dynamic market.
Oil & Gas Upstream Market in Thailand Market Dynamics & Structure
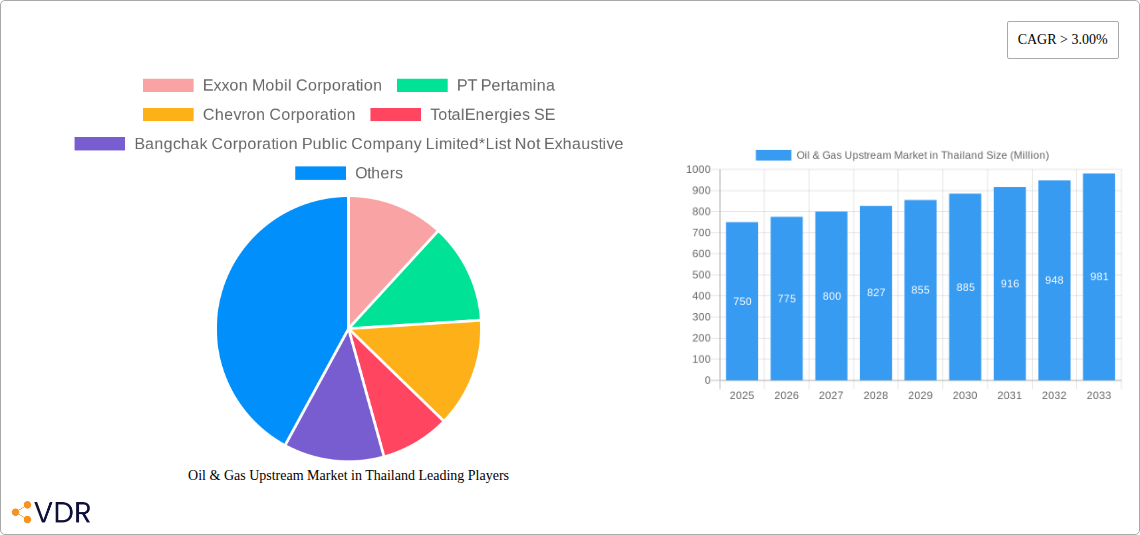
This section analyzes the competitive landscape, regulatory environment, and technological advancements shaping the Thai upstream oil and gas market. We delve into market concentration, highlighting the significant roles of major players like PTT Public Company Limited, Chevron Corporation, and Exxon Mobil Corporation, while also acknowledging the presence of numerous smaller operators. The report examines the influence of governmental policies, including licensing procedures and environmental regulations, on market activity. Technological innovation, particularly in unconventional resource extraction, is explored, along with its impact on market growth. We assess the roles of mergers and acquisitions (M&A) in shaping market structure, providing an overview of recent transactions and their implications.
- Market Concentration: High, with a few dominant players controlling significant market share (PTT holding a xx% share in 2025, for example).
- Technological Innovation: Driven by the need to enhance efficiency and access unconventional resources; however, high initial investment costs present a barrier.
- Regulatory Framework: Stringent environmental regulations and licensing procedures impact exploration and production activities.
- Competitive Product Substitutes: Growing adoption of renewable energy sources presents a long-term challenge.
- End-User Demographics: Primarily industrial and power generation sectors, with limited direct consumer usage.
- M&A Trends: Moderate activity observed in recent years, largely driven by consolidation among smaller players and strategic acquisitions by larger companies; xx M&A deals recorded between 2019-2024, resulting in a xx% increase in market concentration.
Oil & Gas Upstream Market in Thailand Growth Trends & Insights
The Thai oil and gas upstream market experienced a xx% CAGR during the historical period (2019-2024). The report projects continued growth, albeit at a moderated pace, forecasting a xx% CAGR during the forecast period (2025-2033). This growth trajectory is influenced by several factors, including increasing domestic energy demand, investments in exploration and production activities, and the government's emphasis on energy security. However, global trends towards renewable energy and potential price volatility in the oil and gas market present challenges. The analysis incorporates detailed assessments of market penetration by various technologies and segments, exploring market size evolution, and highlighting the impact of technological disruptions and consumer behavior shifts. Specific metrics, including market size in million units and detailed CAGR analysis, are presented to facilitate a deeper understanding of this complex market. The report also considers the impact of geopolitical events on the market.
Dominant Regions, Countries, or Segments in Oil & Gas Upstream Market in Thailand
The Gulf of Thailand remains the dominant region for oil and gas upstream activities, owing to its established infrastructure and proven reserves. The production of natural gas holds a larger market share than crude oil, driven by the government’s focus on developing natural gas resources and its role in power generation. Conventional technologies currently dominate exploration and production, although there’s increasing interest in unconventional resources as technology develops.
- Key Drivers:
- Government policies focused on energy security and infrastructure development.
- Significant reserves of natural gas in the Gulf of Thailand.
- Existing infrastructure in the Gulf of Thailand.
- Dominance Factors: Established infrastructure, large reserves, and favorable government policies.
- Growth Potential: High for natural gas, moderate for crude oil, with significant opportunities in unconventional resources in the long-term.
Oil & Gas Upstream Market in Thailand Product Landscape
The product landscape is characterized by a focus on crude oil and natural gas extraction. Technological advancements primarily revolve around improving drilling efficiency, enhancing reservoir management techniques, and exploring unconventional resources. Innovation in exploration technologies, such as advanced seismic imaging and data analytics, continues to play a vital role. The focus is largely on enhancing operational efficiency and reducing environmental impact.
Key Drivers, Barriers & Challenges in Oil & Gas Upstream Market in Thailand
Key Drivers:
- Growing domestic energy demand.
- Government investments in infrastructure development.
- Strategic focus on natural gas production.
Key Challenges:
- Declining crude oil reserves and reliance on imports.
- High initial investments needed for unconventional resource development.
- Stringent environmental regulations impacting exploration and production.
- Fluctuating global oil and gas prices.
Emerging Opportunities in Oil & Gas Upstream Market in Thailand
Emerging opportunities lie in the exploration and development of unconventional resources and the integration of renewable energy sources into the energy mix. Potential exists in improving efficiency through advanced technologies, such as data analytics and AI-driven optimization. This also includes the potential for offshore wind power, linking offshore oil and gas platforms.
Growth Accelerators in the Oil & Gas Upstream Market in Thailand Industry
Long-term growth will be driven by strategic investments in exploration and production, particularly in the natural gas sector, coupled with technological innovations that enhance efficiency and reduce environmental impact. Strategic partnerships between international and local companies could also unlock new opportunities and accelerate the development of Thailand's oil and gas resources.
Key Players Shaping the Oil & Gas Upstream Market in Thailand Market
- Exxon Mobil Corporation
- PT Pertamina
- Chevron Corporation
- TotalEnergies SE
- Bangchak Corporation Public Company Limited
- Schlumberger Limited
- PTT Public Company Limited
Notable Milestones in Oil & Gas Upstream Market in Thailand Sector
- February 2021: PTT announces USD 28.3 billion investment plan for 2021-2025, focusing on natural gas.
- May 2021: Valaris Limited secures a 240-day contract extension with Mubadala Petroleum Thailand.
- December 2021: Shelf Drilling secures contract extensions with Chevron Thailand for two jack-up rigs (39 and 36 months).
In-Depth Oil & Gas Upstream Market in Thailand Market Outlook
The Thai oil and gas upstream market is poised for continued growth, albeit at a potentially slower pace due to global energy transition trends. Strategic investments, technological advancements, and partnerships will be crucial for unlocking the full potential of Thailand's oil and gas resources while mitigating environmental impacts. The continued focus on natural gas development, coupled with exploration of unconventional resources, will shape the market's future trajectory. Opportunities for strategic partnerships and technological innovation are abundant.
Oil & Gas Upstream Market in Thailand Segmentation
- 1. Onshore
- 2. Offshore
Oil & Gas Upstream Market in Thailand Segmentation By Geography
-
1. North America
- 1.1. United States
- 1.2. Canada
- 1.3. Mexico
-
2. South America
- 2.1. Brazil
- 2.2. Argentina
- 2.3. Rest of South America
-
3. Europe
- 3.1. United Kingdom
- 3.2. Germany
- 3.3. France
- 3.4. Italy
- 3.5. Spain
- 3.6. Russia
- 3.7. Benelux
- 3.8. Nordics
- 3.9. Rest of Europe
-
4. Middle East & Africa
- 4.1. Turkey
- 4.2. Israel
- 4.3. GCC
- 4.4. North Africa
- 4.5. South Africa
- 4.6. Rest of Middle East & Africa
-
5. Asia Pacific
- 5.1. China
- 5.2. India
- 5.3. Japan
- 5.4. South Korea
- 5.5. ASEAN
- 5.6. Oceania
- 5.7. Rest of Asia Pacific
Oil & Gas Upstream Market in Thailand REPORT HIGHLIGHTS
| Aspects | Details |
|---|---|
| Study Period | 2019-2033 |
| Base Year | 2024 |
| Estimated Year | 2025 |
| Forecast Period | 2025-2033 |
| Historical Period | 2019-2024 |
| Growth Rate | CAGR of > 3.00% from 2019-2033 |
| Segmentation |
|
Table of Contents
- 1. Introduction
- 1.1. Research Scope
- 1.2. Market Segmentation
- 1.3. Research Methodology
- 1.4. Definitions and Assumptions
- 2. Executive Summary
- 2.1. Introduction
- 3. Market Dynamics
- 3.1. Introduction
- 3.2. Market Drivers
- 3.2.1. 4.; Increasing Demand from Industrial Applications4.; Growing Infrastructure Across the World
- 3.3. Market Restrains
- 3.3.1. 4.; A Rise In Concerns Related To Carbon Emissions And A Shift Towards Electric Vehicles And Renewable Sources Of Energy
- 3.4. Market Trends
- 3.4.1. Offshore Sector to Dominate the Market
- 4. Market Factor Analysis
- 4.1. Porters Five Forces
- 4.2. Supply/Value Chain
- 4.3. PESTEL analysis
- 4.4. Market Entropy
- 4.5. Patent/Trademark Analysis
- 5. Global Oil & Gas Upstream Market in Thailand Analysis, Insights and Forecast, 2019-2031
- 5.1. Market Analysis, Insights and Forecast - by Onshore
- 5.2. Market Analysis, Insights and Forecast - by Offshore
- 5.3. Market Analysis, Insights and Forecast - by Region
- 5.3.1. North America
- 5.3.2. South America
- 5.3.3. Europe
- 5.3.4. Middle East & Africa
- 5.3.5. Asia Pacific
- 5.1. Market Analysis, Insights and Forecast - by Onshore
- 6. North America Oil & Gas Upstream Market in Thailand Analysis, Insights and Forecast, 2019-2031
- 6.1. Market Analysis, Insights and Forecast - by Onshore
- 6.2. Market Analysis, Insights and Forecast - by Offshore
- 6.1. Market Analysis, Insights and Forecast - by Onshore
- 7. South America Oil & Gas Upstream Market in Thailand Analysis, Insights and Forecast, 2019-2031
- 7.1. Market Analysis, Insights and Forecast - by Onshore
- 7.2. Market Analysis, Insights and Forecast - by Offshore
- 7.1. Market Analysis, Insights and Forecast - by Onshore
- 8. Europe Oil & Gas Upstream Market in Thailand Analysis, Insights and Forecast, 2019-2031
- 8.1. Market Analysis, Insights and Forecast - by Onshore
- 8.2. Market Analysis, Insights and Forecast - by Offshore
- 8.1. Market Analysis, Insights and Forecast - by Onshore
- 9. Middle East & Africa Oil & Gas Upstream Market in Thailand Analysis, Insights and Forecast, 2019-2031
- 9.1. Market Analysis, Insights and Forecast - by Onshore
- 9.2. Market Analysis, Insights and Forecast - by Offshore
- 9.1. Market Analysis, Insights and Forecast - by Onshore
- 10. Asia Pacific Oil & Gas Upstream Market in Thailand Analysis, Insights and Forecast, 2019-2031
- 10.1. Market Analysis, Insights and Forecast - by Onshore
- 10.2. Market Analysis, Insights and Forecast - by Offshore
- 10.1. Market Analysis, Insights and Forecast - by Onshore
- 11. China Oil & Gas Upstream Market in Thailand Analysis, Insights and Forecast, 2019-2031
- 12. Japan Oil & Gas Upstream Market in Thailand Analysis, Insights and Forecast, 2019-2031
- 13. India Oil & Gas Upstream Market in Thailand Analysis, Insights and Forecast, 2019-2031
- 14. South Korea Oil & Gas Upstream Market in Thailand Analysis, Insights and Forecast, 2019-2031
- 15. Taiwan Oil & Gas Upstream Market in Thailand Analysis, Insights and Forecast, 2019-2031
- 16. Australia Oil & Gas Upstream Market in Thailand Analysis, Insights and Forecast, 2019-2031
- 17. Rest of Asia-Pacific Oil & Gas Upstream Market in Thailand Analysis, Insights and Forecast, 2019-2031
- 18. Competitive Analysis
- 18.1. Global Market Share Analysis 2024
- 18.2. Company Profiles
- 18.2.1 Exxon Mobil Corporation
- 18.2.1.1. Overview
- 18.2.1.2. Products
- 18.2.1.3. SWOT Analysis
- 18.2.1.4. Recent Developments
- 18.2.1.5. Financials (Based on Availability)
- 18.2.2 PT Pertamina
- 18.2.2.1. Overview
- 18.2.2.2. Products
- 18.2.2.3. SWOT Analysis
- 18.2.2.4. Recent Developments
- 18.2.2.5. Financials (Based on Availability)
- 18.2.3 Chevron Corporation
- 18.2.3.1. Overview
- 18.2.3.2. Products
- 18.2.3.3. SWOT Analysis
- 18.2.3.4. Recent Developments
- 18.2.3.5. Financials (Based on Availability)
- 18.2.4 TotalEnergies SE
- 18.2.4.1. Overview
- 18.2.4.2. Products
- 18.2.4.3. SWOT Analysis
- 18.2.4.4. Recent Developments
- 18.2.4.5. Financials (Based on Availability)
- 18.2.5 Bangchak Corporation Public Company Limited*List Not Exhaustive
- 18.2.5.1. Overview
- 18.2.5.2. Products
- 18.2.5.3. SWOT Analysis
- 18.2.5.4. Recent Developments
- 18.2.5.5. Financials (Based on Availability)
- 18.2.6 Schlumberger Limited
- 18.2.6.1. Overview
- 18.2.6.2. Products
- 18.2.6.3. SWOT Analysis
- 18.2.6.4. Recent Developments
- 18.2.6.5. Financials (Based on Availability)
- 18.2.7 PTT Public Company Limited
- 18.2.7.1. Overview
- 18.2.7.2. Products
- 18.2.7.3. SWOT Analysis
- 18.2.7.4. Recent Developments
- 18.2.7.5. Financials (Based on Availability)
- 18.2.1 Exxon Mobil Corporation
List of Figures
- Figure 1: Global Oil & Gas Upstream Market in Thailand Revenue Breakdown (Million, %) by Region 2024 & 2032
- Figure 2: Global Oil & Gas Upstream Market in Thailand Volume Breakdown (Tonnes, %) by Region 2024 & 2032
- Figure 3: Asia Pacific Oil & Gas Upstream Market in Thailand Revenue (Million), by Country 2024 & 2032
- Figure 4: Asia Pacific Oil & Gas Upstream Market in Thailand Volume (Tonnes), by Country 2024 & 2032
- Figure 5: Asia Pacific Oil & Gas Upstream Market in Thailand Revenue Share (%), by Country 2024 & 2032
- Figure 6: Asia Pacific Oil & Gas Upstream Market in Thailand Volume Share (%), by Country 2024 & 2032
- Figure 7: North America Oil & Gas Upstream Market in Thailand Revenue (Million), by Onshore 2024 & 2032
- Figure 8: North America Oil & Gas Upstream Market in Thailand Volume (Tonnes), by Onshore 2024 & 2032
- Figure 9: North America Oil & Gas Upstream Market in Thailand Revenue Share (%), by Onshore 2024 & 2032
- Figure 10: North America Oil & Gas Upstream Market in Thailand Volume Share (%), by Onshore 2024 & 2032
- Figure 11: North America Oil & Gas Upstream Market in Thailand Revenue (Million), by Offshore 2024 & 2032
- Figure 12: North America Oil & Gas Upstream Market in Thailand Volume (Tonnes), by Offshore 2024 & 2032
- Figure 13: North America Oil & Gas Upstream Market in Thailand Revenue Share (%), by Offshore 2024 & 2032
- Figure 14: North America Oil & Gas Upstream Market in Thailand Volume Share (%), by Offshore 2024 & 2032
- Figure 15: North America Oil & Gas Upstream Market in Thailand Revenue (Million), by Country 2024 & 2032
- Figure 16: North America Oil & Gas Upstream Market in Thailand Volume (Tonnes), by Country 2024 & 2032
- Figure 17: North America Oil & Gas Upstream Market in Thailand Revenue Share (%), by Country 2024 & 2032
- Figure 18: North America Oil & Gas Upstream Market in Thailand Volume Share (%), by Country 2024 & 2032
- Figure 19: South America Oil & Gas Upstream Market in Thailand Revenue (Million), by Onshore 2024 & 2032
- Figure 20: South America Oil & Gas Upstream Market in Thailand Volume (Tonnes), by Onshore 2024 & 2032
- Figure 21: South America Oil & Gas Upstream Market in Thailand Revenue Share (%), by Onshore 2024 & 2032
- Figure 22: South America Oil & Gas Upstream Market in Thailand Volume Share (%), by Onshore 2024 & 2032
- Figure 23: South America Oil & Gas Upstream Market in Thailand Revenue (Million), by Offshore 2024 & 2032
- Figure 24: South America Oil & Gas Upstream Market in Thailand Volume (Tonnes), by Offshore 2024 & 2032
- Figure 25: South America Oil & Gas Upstream Market in Thailand Revenue Share (%), by Offshore 2024 & 2032
- Figure 26: South America Oil & Gas Upstream Market in Thailand Volume Share (%), by Offshore 2024 & 2032
- Figure 27: South America Oil & Gas Upstream Market in Thailand Revenue (Million), by Country 2024 & 2032
- Figure 28: South America Oil & Gas Upstream Market in Thailand Volume (Tonnes), by Country 2024 & 2032
- Figure 29: South America Oil & Gas Upstream Market in Thailand Revenue Share (%), by Country 2024 & 2032
- Figure 30: South America Oil & Gas Upstream Market in Thailand Volume Share (%), by Country 2024 & 2032
- Figure 31: Europe Oil & Gas Upstream Market in Thailand Revenue (Million), by Onshore 2024 & 2032
- Figure 32: Europe Oil & Gas Upstream Market in Thailand Volume (Tonnes), by Onshore 2024 & 2032
- Figure 33: Europe Oil & Gas Upstream Market in Thailand Revenue Share (%), by Onshore 2024 & 2032
- Figure 34: Europe Oil & Gas Upstream Market in Thailand Volume Share (%), by Onshore 2024 & 2032
- Figure 35: Europe Oil & Gas Upstream Market in Thailand Revenue (Million), by Offshore 2024 & 2032
- Figure 36: Europe Oil & Gas Upstream Market in Thailand Volume (Tonnes), by Offshore 2024 & 2032
- Figure 37: Europe Oil & Gas Upstream Market in Thailand Revenue Share (%), by Offshore 2024 & 2032
- Figure 38: Europe Oil & Gas Upstream Market in Thailand Volume Share (%), by Offshore 2024 & 2032
- Figure 39: Europe Oil & Gas Upstream Market in Thailand Revenue (Million), by Country 2024 & 2032
- Figure 40: Europe Oil & Gas Upstream Market in Thailand Volume (Tonnes), by Country 2024 & 2032
- Figure 41: Europe Oil & Gas Upstream Market in Thailand Revenue Share (%), by Country 2024 & 2032
- Figure 42: Europe Oil & Gas Upstream Market in Thailand Volume Share (%), by Country 2024 & 2032
- Figure 43: Middle East & Africa Oil & Gas Upstream Market in Thailand Revenue (Million), by Onshore 2024 & 2032
- Figure 44: Middle East & Africa Oil & Gas Upstream Market in Thailand Volume (Tonnes), by Onshore 2024 & 2032
- Figure 45: Middle East & Africa Oil & Gas Upstream Market in Thailand Revenue Share (%), by Onshore 2024 & 2032
- Figure 46: Middle East & Africa Oil & Gas Upstream Market in Thailand Volume Share (%), by Onshore 2024 & 2032
- Figure 47: Middle East & Africa Oil & Gas Upstream Market in Thailand Revenue (Million), by Offshore 2024 & 2032
- Figure 48: Middle East & Africa Oil & Gas Upstream Market in Thailand Volume (Tonnes), by Offshore 2024 & 2032
- Figure 49: Middle East & Africa Oil & Gas Upstream Market in Thailand Revenue Share (%), by Offshore 2024 & 2032
- Figure 50: Middle East & Africa Oil & Gas Upstream Market in Thailand Volume Share (%), by Offshore 2024 & 2032
- Figure 51: Middle East & Africa Oil & Gas Upstream Market in Thailand Revenue (Million), by Country 2024 & 2032
- Figure 52: Middle East & Africa Oil & Gas Upstream Market in Thailand Volume (Tonnes), by Country 2024 & 2032
- Figure 53: Middle East & Africa Oil & Gas Upstream Market in Thailand Revenue Share (%), by Country 2024 & 2032
- Figure 54: Middle East & Africa Oil & Gas Upstream Market in Thailand Volume Share (%), by Country 2024 & 2032
- Figure 55: Asia Pacific Oil & Gas Upstream Market in Thailand Revenue (Million), by Onshore 2024 & 2032
- Figure 56: Asia Pacific Oil & Gas Upstream Market in Thailand Volume (Tonnes), by Onshore 2024 & 2032
- Figure 57: Asia Pacific Oil & Gas Upstream Market in Thailand Revenue Share (%), by Onshore 2024 & 2032
- Figure 58: Asia Pacific Oil & Gas Upstream Market in Thailand Volume Share (%), by Onshore 2024 & 2032
- Figure 59: Asia Pacific Oil & Gas Upstream Market in Thailand Revenue (Million), by Offshore 2024 & 2032
- Figure 60: Asia Pacific Oil & Gas Upstream Market in Thailand Volume (Tonnes), by Offshore 2024 & 2032
- Figure 61: Asia Pacific Oil & Gas Upstream Market in Thailand Revenue Share (%), by Offshore 2024 & 2032
- Figure 62: Asia Pacific Oil & Gas Upstream Market in Thailand Volume Share (%), by Offshore 2024 & 2032
- Figure 63: Asia Pacific Oil & Gas Upstream Market in Thailand Revenue (Million), by Country 2024 & 2032
- Figure 64: Asia Pacific Oil & Gas Upstream Market in Thailand Volume (Tonnes), by Country 2024 & 2032
- Figure 65: Asia Pacific Oil & Gas Upstream Market in Thailand Revenue Share (%), by Country 2024 & 2032
- Figure 66: Asia Pacific Oil & Gas Upstream Market in Thailand Volume Share (%), by Country 2024 & 2032
List of Tables
- Table 1: Global Oil & Gas Upstream Market in Thailand Revenue Million Forecast, by Region 2019 & 2032
- Table 2: Global Oil & Gas Upstream Market in Thailand Volume Tonnes Forecast, by Region 2019 & 2032
- Table 3: Global Oil & Gas Upstream Market in Thailand Revenue Million Forecast, by Onshore 2019 & 2032
- Table 4: Global Oil & Gas Upstream Market in Thailand Volume Tonnes Forecast, by Onshore 2019 & 2032
- Table 5: Global Oil & Gas Upstream Market in Thailand Revenue Million Forecast, by Offshore 2019 & 2032
- Table 6: Global Oil & Gas Upstream Market in Thailand Volume Tonnes Forecast, by Offshore 2019 & 2032
- Table 7: Global Oil & Gas Upstream Market in Thailand Revenue Million Forecast, by Region 2019 & 2032
- Table 8: Global Oil & Gas Upstream Market in Thailand Volume Tonnes Forecast, by Region 2019 & 2032
- Table 9: Global Oil & Gas Upstream Market in Thailand Revenue Million Forecast, by Country 2019 & 2032
- Table 10: Global Oil & Gas Upstream Market in Thailand Volume Tonnes Forecast, by Country 2019 & 2032
- Table 11: China Oil & Gas Upstream Market in Thailand Revenue (Million) Forecast, by Application 2019 & 2032
- Table 12: China Oil & Gas Upstream Market in Thailand Volume (Tonnes) Forecast, by Application 2019 & 2032
- Table 13: Japan Oil & Gas Upstream Market in Thailand Revenue (Million) Forecast, by Application 2019 & 2032
- Table 14: Japan Oil & Gas Upstream Market in Thailand Volume (Tonnes) Forecast, by Application 2019 & 2032
- Table 15: India Oil & Gas Upstream Market in Thailand Revenue (Million) Forecast, by Application 2019 & 2032
- Table 16: India Oil & Gas Upstream Market in Thailand Volume (Tonnes) Forecast, by Application 2019 & 2032
- Table 17: South Korea Oil & Gas Upstream Market in Thailand Revenue (Million) Forecast, by Application 2019 & 2032
- Table 18: South Korea Oil & Gas Upstream Market in Thailand Volume (Tonnes) Forecast, by Application 2019 & 2032
- Table 19: Taiwan Oil & Gas Upstream Market in Thailand Revenue (Million) Forecast, by Application 2019 & 2032
- Table 20: Taiwan Oil & Gas Upstream Market in Thailand Volume (Tonnes) Forecast, by Application 2019 & 2032
- Table 21: Australia Oil & Gas Upstream Market in Thailand Revenue (Million) Forecast, by Application 2019 & 2032
- Table 22: Australia Oil & Gas Upstream Market in Thailand Volume (Tonnes) Forecast, by Application 2019 & 2032
- Table 23: Rest of Asia-Pacific Oil & Gas Upstream Market in Thailand Revenue (Million) Forecast, by Application 2019 & 2032
- Table 24: Rest of Asia-Pacific Oil & Gas Upstream Market in Thailand Volume (Tonnes) Forecast, by Application 2019 & 2032
- Table 25: Global Oil & Gas Upstream Market in Thailand Revenue Million Forecast, by Onshore 2019 & 2032
- Table 26: Global Oil & Gas Upstream Market in Thailand Volume Tonnes Forecast, by Onshore 2019 & 2032
- Table 27: Global Oil & Gas Upstream Market in Thailand Revenue Million Forecast, by Offshore 2019 & 2032
- Table 28: Global Oil & Gas Upstream Market in Thailand Volume Tonnes Forecast, by Offshore 2019 & 2032
- Table 29: Global Oil & Gas Upstream Market in Thailand Revenue Million Forecast, by Country 2019 & 2032
- Table 30: Global Oil & Gas Upstream Market in Thailand Volume Tonnes Forecast, by Country 2019 & 2032
- Table 31: United States Oil & Gas Upstream Market in Thailand Revenue (Million) Forecast, by Application 2019 & 2032
- Table 32: United States Oil & Gas Upstream Market in Thailand Volume (Tonnes) Forecast, by Application 2019 & 2032
- Table 33: Canada Oil & Gas Upstream Market in Thailand Revenue (Million) Forecast, by Application 2019 & 2032
- Table 34: Canada Oil & Gas Upstream Market in Thailand Volume (Tonnes) Forecast, by Application 2019 & 2032
- Table 35: Mexico Oil & Gas Upstream Market in Thailand Revenue (Million) Forecast, by Application 2019 & 2032
- Table 36: Mexico Oil & Gas Upstream Market in Thailand Volume (Tonnes) Forecast, by Application 2019 & 2032
- Table 37: Global Oil & Gas Upstream Market in Thailand Revenue Million Forecast, by Onshore 2019 & 2032
- Table 38: Global Oil & Gas Upstream Market in Thailand Volume Tonnes Forecast, by Onshore 2019 & 2032
- Table 39: Global Oil & Gas Upstream Market in Thailand Revenue Million Forecast, by Offshore 2019 & 2032
- Table 40: Global Oil & Gas Upstream Market in Thailand Volume Tonnes Forecast, by Offshore 2019 & 2032
- Table 41: Global Oil & Gas Upstream Market in Thailand Revenue Million Forecast, by Country 2019 & 2032
- Table 42: Global Oil & Gas Upstream Market in Thailand Volume Tonnes Forecast, by Country 2019 & 2032
- Table 43: Brazil Oil & Gas Upstream Market in Thailand Revenue (Million) Forecast, by Application 2019 & 2032
- Table 44: Brazil Oil & Gas Upstream Market in Thailand Volume (Tonnes) Forecast, by Application 2019 & 2032
- Table 45: Argentina Oil & Gas Upstream Market in Thailand Revenue (Million) Forecast, by Application 2019 & 2032
- Table 46: Argentina Oil & Gas Upstream Market in Thailand Volume (Tonnes) Forecast, by Application 2019 & 2032
- Table 47: Rest of South America Oil & Gas Upstream Market in Thailand Revenue (Million) Forecast, by Application 2019 & 2032
- Table 48: Rest of South America Oil & Gas Upstream Market in Thailand Volume (Tonnes) Forecast, by Application 2019 & 2032
- Table 49: Global Oil & Gas Upstream Market in Thailand Revenue Million Forecast, by Onshore 2019 & 2032
- Table 50: Global Oil & Gas Upstream Market in Thailand Volume Tonnes Forecast, by Onshore 2019 & 2032
- Table 51: Global Oil & Gas Upstream Market in Thailand Revenue Million Forecast, by Offshore 2019 & 2032
- Table 52: Global Oil & Gas Upstream Market in Thailand Volume Tonnes Forecast, by Offshore 2019 & 2032
- Table 53: Global Oil & Gas Upstream Market in Thailand Revenue Million Forecast, by Country 2019 & 2032
- Table 54: Global Oil & Gas Upstream Market in Thailand Volume Tonnes Forecast, by Country 2019 & 2032
- Table 55: United Kingdom Oil & Gas Upstream Market in Thailand Revenue (Million) Forecast, by Application 2019 & 2032
- Table 56: United Kingdom Oil & Gas Upstream Market in Thailand Volume (Tonnes) Forecast, by Application 2019 & 2032
- Table 57: Germany Oil & Gas Upstream Market in Thailand Revenue (Million) Forecast, by Application 2019 & 2032
- Table 58: Germany Oil & Gas Upstream Market in Thailand Volume (Tonnes) Forecast, by Application 2019 & 2032
- Table 59: France Oil & Gas Upstream Market in Thailand Revenue (Million) Forecast, by Application 2019 & 2032
- Table 60: France Oil & Gas Upstream Market in Thailand Volume (Tonnes) Forecast, by Application 2019 & 2032
- Table 61: Italy Oil & Gas Upstream Market in Thailand Revenue (Million) Forecast, by Application 2019 & 2032
- Table 62: Italy Oil & Gas Upstream Market in Thailand Volume (Tonnes) Forecast, by Application 2019 & 2032
- Table 63: Spain Oil & Gas Upstream Market in Thailand Revenue (Million) Forecast, by Application 2019 & 2032
- Table 64: Spain Oil & Gas Upstream Market in Thailand Volume (Tonnes) Forecast, by Application 2019 & 2032
- Table 65: Russia Oil & Gas Upstream Market in Thailand Revenue (Million) Forecast, by Application 2019 & 2032
- Table 66: Russia Oil & Gas Upstream Market in Thailand Volume (Tonnes) Forecast, by Application 2019 & 2032
- Table 67: Benelux Oil & Gas Upstream Market in Thailand Revenue (Million) Forecast, by Application 2019 & 2032
- Table 68: Benelux Oil & Gas Upstream Market in Thailand Volume (Tonnes) Forecast, by Application 2019 & 2032
- Table 69: Nordics Oil & Gas Upstream Market in Thailand Revenue (Million) Forecast, by Application 2019 & 2032
- Table 70: Nordics Oil & Gas Upstream Market in Thailand Volume (Tonnes) Forecast, by Application 2019 & 2032
- Table 71: Rest of Europe Oil & Gas Upstream Market in Thailand Revenue (Million) Forecast, by Application 2019 & 2032
- Table 72: Rest of Europe Oil & Gas Upstream Market in Thailand Volume (Tonnes) Forecast, by Application 2019 & 2032
- Table 73: Global Oil & Gas Upstream Market in Thailand Revenue Million Forecast, by Onshore 2019 & 2032
- Table 74: Global Oil & Gas Upstream Market in Thailand Volume Tonnes Forecast, by Onshore 2019 & 2032
- Table 75: Global Oil & Gas Upstream Market in Thailand Revenue Million Forecast, by Offshore 2019 & 2032
- Table 76: Global Oil & Gas Upstream Market in Thailand Volume Tonnes Forecast, by Offshore 2019 & 2032
- Table 77: Global Oil & Gas Upstream Market in Thailand Revenue Million Forecast, by Country 2019 & 2032
- Table 78: Global Oil & Gas Upstream Market in Thailand Volume Tonnes Forecast, by Country 2019 & 2032
- Table 79: Turkey Oil & Gas Upstream Market in Thailand Revenue (Million) Forecast, by Application 2019 & 2032
- Table 80: Turkey Oil & Gas Upstream Market in Thailand Volume (Tonnes) Forecast, by Application 2019 & 2032
- Table 81: Israel Oil & Gas Upstream Market in Thailand Revenue (Million) Forecast, by Application 2019 & 2032
- Table 82: Israel Oil & Gas Upstream Market in Thailand Volume (Tonnes) Forecast, by Application 2019 & 2032
- Table 83: GCC Oil & Gas Upstream Market in Thailand Revenue (Million) Forecast, by Application 2019 & 2032
- Table 84: GCC Oil & Gas Upstream Market in Thailand Volume (Tonnes) Forecast, by Application 2019 & 2032
- Table 85: North Africa Oil & Gas Upstream Market in Thailand Revenue (Million) Forecast, by Application 2019 & 2032
- Table 86: North Africa Oil & Gas Upstream Market in Thailand Volume (Tonnes) Forecast, by Application 2019 & 2032
- Table 87: South Africa Oil & Gas Upstream Market in Thailand Revenue (Million) Forecast, by Application 2019 & 2032
- Table 88: South Africa Oil & Gas Upstream Market in Thailand Volume (Tonnes) Forecast, by Application 2019 & 2032
- Table 89: Rest of Middle East & Africa Oil & Gas Upstream Market in Thailand Revenue (Million) Forecast, by Application 2019 & 2032
- Table 90: Rest of Middle East & Africa Oil & Gas Upstream Market in Thailand Volume (Tonnes) Forecast, by Application 2019 & 2032
- Table 91: Global Oil & Gas Upstream Market in Thailand Revenue Million Forecast, by Onshore 2019 & 2032
- Table 92: Global Oil & Gas Upstream Market in Thailand Volume Tonnes Forecast, by Onshore 2019 & 2032
- Table 93: Global Oil & Gas Upstream Market in Thailand Revenue Million Forecast, by Offshore 2019 & 2032
- Table 94: Global Oil & Gas Upstream Market in Thailand Volume Tonnes Forecast, by Offshore 2019 & 2032
- Table 95: Global Oil & Gas Upstream Market in Thailand Revenue Million Forecast, by Country 2019 & 2032
- Table 96: Global Oil & Gas Upstream Market in Thailand Volume Tonnes Forecast, by Country 2019 & 2032
- Table 97: China Oil & Gas Upstream Market in Thailand Revenue (Million) Forecast, by Application 2019 & 2032
- Table 98: China Oil & Gas Upstream Market in Thailand Volume (Tonnes) Forecast, by Application 2019 & 2032
- Table 99: India Oil & Gas Upstream Market in Thailand Revenue (Million) Forecast, by Application 2019 & 2032
- Table 100: India Oil & Gas Upstream Market in Thailand Volume (Tonnes) Forecast, by Application 2019 & 2032
- Table 101: Japan Oil & Gas Upstream Market in Thailand Revenue (Million) Forecast, by Application 2019 & 2032
- Table 102: Japan Oil & Gas Upstream Market in Thailand Volume (Tonnes) Forecast, by Application 2019 & 2032
- Table 103: South Korea Oil & Gas Upstream Market in Thailand Revenue (Million) Forecast, by Application 2019 & 2032
- Table 104: South Korea Oil & Gas Upstream Market in Thailand Volume (Tonnes) Forecast, by Application 2019 & 2032
- Table 105: ASEAN Oil & Gas Upstream Market in Thailand Revenue (Million) Forecast, by Application 2019 & 2032
- Table 106: ASEAN Oil & Gas Upstream Market in Thailand Volume (Tonnes) Forecast, by Application 2019 & 2032
- Table 107: Oceania Oil & Gas Upstream Market in Thailand Revenue (Million) Forecast, by Application 2019 & 2032
- Table 108: Oceania Oil & Gas Upstream Market in Thailand Volume (Tonnes) Forecast, by Application 2019 & 2032
- Table 109: Rest of Asia Pacific Oil & Gas Upstream Market in Thailand Revenue (Million) Forecast, by Application 2019 & 2032
- Table 110: Rest of Asia Pacific Oil & Gas Upstream Market in Thailand Volume (Tonnes) Forecast, by Application 2019 & 2032
Frequently Asked Questions
1. What is the projected Compound Annual Growth Rate (CAGR) of the Oil & Gas Upstream Market in Thailand?
The projected CAGR is approximately > 3.00%.
2. Which companies are prominent players in the Oil & Gas Upstream Market in Thailand?
Key companies in the market include Exxon Mobil Corporation, PT Pertamina, Chevron Corporation, TotalEnergies SE, Bangchak Corporation Public Company Limited*List Not Exhaustive, Schlumberger Limited, PTT Public Company Limited.
3. What are the main segments of the Oil & Gas Upstream Market in Thailand?
The market segments include Onshore, Offshore.
4. Can you provide details about the market size?
The market size is estimated to be USD XX Million as of 2022.
5. What are some drivers contributing to market growth?
4.; Increasing Demand from Industrial Applications4.; Growing Infrastructure Across the World.
6. What are the notable trends driving market growth?
Offshore Sector to Dominate the Market.
7. Are there any restraints impacting market growth?
4.; A Rise In Concerns Related To Carbon Emissions And A Shift Towards Electric Vehicles And Renewable Sources Of Energy.
8. Can you provide examples of recent developments in the market?
In February 2021, Thailand's state-controlled oil firm, PTT, announced that it was planning an investment of USD 28.3 billion across all its operations for 2021-2025. It focuses on developing the country's natural gas industry while seeking future energy opportunities.
9. What pricing options are available for accessing the report?
Pricing options include single-user, multi-user, and enterprise licenses priced at USD 3800, USD 4500, and USD 5800 respectively.
10. Is the market size provided in terms of value or volume?
The market size is provided in terms of value, measured in Million and volume, measured in Tonnes.
11. Are there any specific market keywords associated with the report?
Yes, the market keyword associated with the report is "Oil & Gas Upstream Market in Thailand," which aids in identifying and referencing the specific market segment covered.
12. How do I determine which pricing option suits my needs best?
The pricing options vary based on user requirements and access needs. Individual users may opt for single-user licenses, while businesses requiring broader access may choose multi-user or enterprise licenses for cost-effective access to the report.
13. Are there any additional resources or data provided in the Oil & Gas Upstream Market in Thailand report?
While the report offers comprehensive insights, it's advisable to review the specific contents or supplementary materials provided to ascertain if additional resources or data are available.
14. How can I stay updated on further developments or reports in the Oil & Gas Upstream Market in Thailand?
To stay informed about further developments, trends, and reports in the Oil & Gas Upstream Market in Thailand, consider subscribing to industry newsletters, following relevant companies and organizations, or regularly checking reputable industry news sources and publications.
Methodology
Step 1 - Identification of Relevant Samples Size from Population Database


Step 2 - Approaches for Defining Global Market Size (Value, Volume* & Price*)

Note*: In applicable scenarios
Step 3 - Data Sources
Primary Research
- Web Analytics
- Survey Reports
- Research Institute
- Latest Research Reports
- Opinion Leaders
Secondary Research
- Annual Reports
- White Paper
- Latest Press Release
- Industry Association
- Paid Database
- Investor Presentations

Step 4 - Data Triangulation
Involves using different sources of information in order to increase the validity of a study
These sources are likely to be stakeholders in a program - participants, other researchers, program staff, other community members, and so on.
Then we put all data in single framework & apply various statistical tools to find out the dynamic on the market.
During the analysis stage, feedback from the stakeholder groups would be compared to determine areas of agreement as well as areas of divergence


