
Key Insights
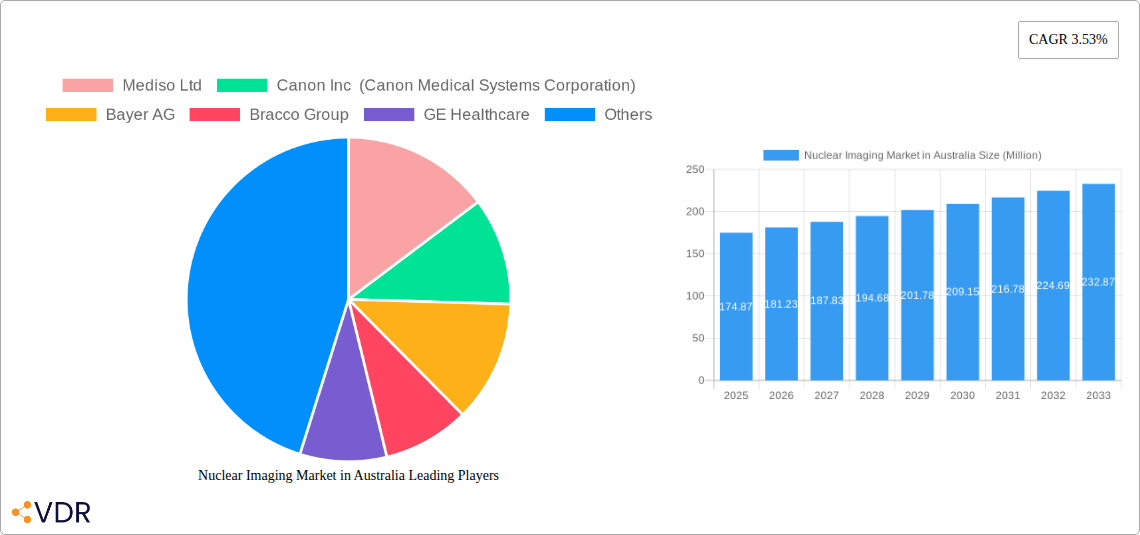
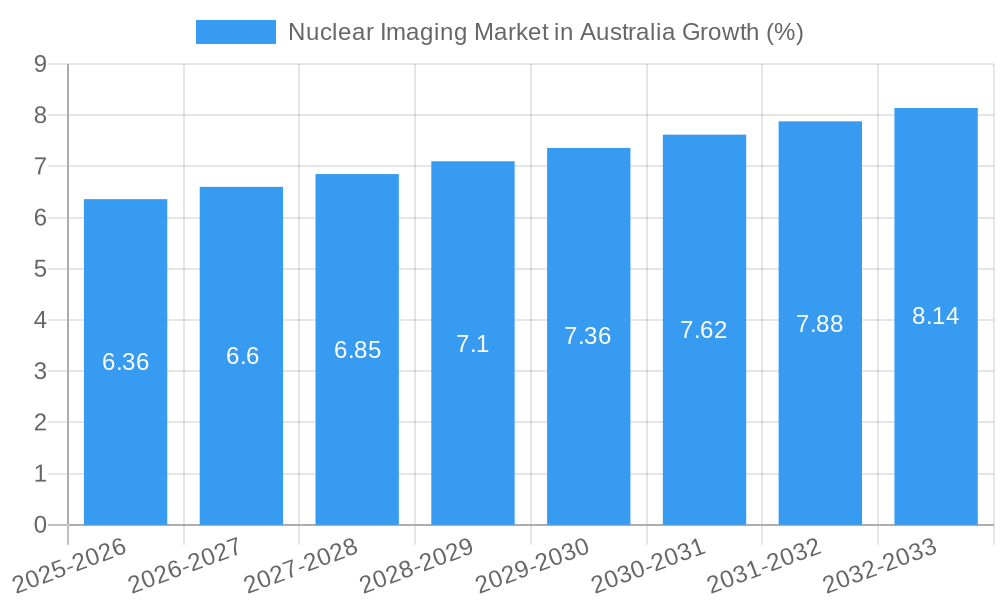
The Australian nuclear imaging market, valued at approximately $174.87 million in 2025, is projected to experience steady growth, exhibiting a Compound Annual Growth Rate (CAGR) of 3.53% from 2025 to 2033. This growth is driven by several factors. Firstly, an aging population necessitates increased diagnostic capabilities for conditions like cancer and cardiovascular diseases, significantly boosting demand for nuclear imaging services. Advancements in technology, such as the development of more sophisticated and sensitive imaging equipment like SPECT and PET scanners, are improving diagnostic accuracy and efficiency, further fueling market expansion. Increased government funding for healthcare infrastructure and initiatives promoting early disease detection also contribute positively. However, the market faces constraints including the high cost of equipment and radioisotopes, stringent regulatory approvals for new technologies, and the need for specialized trained personnel to operate and interpret scans. The market segmentation reveals significant demand across both equipment (including SPECT and PET scanners) and diagnostic radioisotopes, with applications spanning various specialties, including cardiology, oncology, and neurology. Leading companies like Mediso, Canon Medical Systems, Bayer, Bracco, GE Healthcare, Philips, Novartis, Siemens Healthineers, and Fujifilm are actively competing within this market, vying for market share through technological innovations, strategic partnerships, and expanded service offerings.
The Australian nuclear imaging market’s future trajectory hinges on successfully navigating regulatory challenges and mitigating the high costs associated with technology and skilled professionals. Further growth will depend on effective public health campaigns promoting early disease detection and prevention, coupled with continued investment in advanced imaging technologies and the training of a specialized workforce. The increasing prevalence of chronic diseases in Australia will remain a key driver for demand, and the ongoing development of more precise and less invasive imaging techniques will continue to attract both patients and healthcare providers, shaping the landscape of the market through 2033. This steady yet sustainable growth will see the market gradually expanding, driven by the interplay of technological innovation, demographic trends, and evolving healthcare priorities.
Nuclear Imaging Market in Australia: A Comprehensive Report (2019-2033)
This comprehensive report provides an in-depth analysis of the Australian nuclear imaging market, encompassing market dynamics, growth trends, key players, and future outlook. The report covers the parent market of medical imaging and the child market of nuclear imaging, specifically focusing on equipment, diagnostic radioisotopes, and applications like SPECT and PET. The study period spans 2019-2033, with a base year of 2025 and a forecast period of 2025-2033. Market values are presented in million Australian dollars (AUD).
Nuclear Imaging Market in Australia Market Dynamics & Structure
This section analyzes the competitive landscape, technological advancements, regulatory influences, and market trends within the Australian nuclear imaging sector. The market is characterized by a moderate level of concentration, with key players holding significant market shares (estimated at xx% collectively in 2025). Technological innovation, driven by advancements in PET/CT and SPECT/CT systems, is a key growth driver. Stringent regulatory frameworks governing the use of radioactive materials and diagnostic procedures shape market operations. Competitive substitutes, such as MRI and ultrasound, exert some pressure, although nuclear imaging retains a crucial role in specific diagnostic applications. The end-user demographics predominantly comprise hospitals, clinics, and specialized imaging centers. M&A activity in the Australian nuclear imaging market has been relatively moderate in recent years, with approximately xx deals recorded during the historical period (2019-2024).
- Market Concentration: Moderately concentrated, with top players holding xx% market share (2025).
- Technological Innovation: Significant advancements in PET/CT and SPECT/CT technologies driving growth.
- Regulatory Framework: Stringent regulations governing radioactive materials and diagnostic procedures.
- Competitive Substitutes: MRI and ultrasound present some competitive pressure.
- End-User Demographics: Hospitals, clinics, and specialized imaging centers.
- M&A Activity: Approximately xx deals recorded between 2019 and 2024.
- Innovation Barriers: High regulatory hurdles and significant investment requirements for new technologies.
Nuclear Imaging Market in Australia Growth Trends & Insights
The Australian nuclear imaging market experienced steady growth during the historical period (2019-2024), with a CAGR of xx%. This growth is attributed to increasing prevalence of chronic diseases requiring nuclear imaging for diagnosis and treatment monitoring, rising healthcare expenditure, and technological advancements leading to improved diagnostic accuracy and patient outcomes. Market penetration remains relatively high in urban areas compared to rural regions, driven by better access to advanced facilities and specialized healthcare professionals. Adoption rates of new technologies, such as hybrid PET/CT and SPECT/CT systems, are gradually increasing. Consumer behavior shifts towards greater awareness and demand for minimally invasive diagnostic procedures are also contributing to market growth. The market is projected to witness continued expansion during the forecast period (2025-2033), with a projected CAGR of xx%, driven by factors such as an aging population, increased cancer incidence, and expansion of healthcare infrastructure.
Dominant Regions, Countries, or Segments in Nuclear Imaging Market in Australia
The major metropolitan areas in Australia, particularly Sydney and Melbourne, dominate the nuclear imaging market, due to their concentration of specialized healthcare facilities, research institutions, and higher healthcare expenditure. Within the product segments, Equipment (PET/CT and SPECT/CT systems) holds the largest market share, followed by Diagnostic Radioisotopes. The Application segment is primarily driven by SPECT applications in cardiology and oncology, although PET applications are witnessing significant growth, particularly in oncology.
- Key Drivers for Metropolitan Dominance: High concentration of healthcare facilities, research institutions, and higher healthcare spending.
- Equipment Segment: Largest market share due to high demand for advanced imaging systems.
- Diagnostic Radioisotopes: Significant market share, driven by increasing demand for diagnostic procedures.
- SPECT Applications: Dominates applications segment, primarily in cardiology and oncology.
- PET Applications: Experiencing rapid growth, particularly in oncology.
Nuclear Imaging Market in Australia Product Landscape
The Australian nuclear imaging market features a diverse range of products, including advanced PET/CT and SPECT/CT systems, diagnostic radioisotopes tailored for specific applications, and related software and services. Recent product innovations focus on improved image resolution, faster scan times, and reduced radiation exposure. Key features such as advanced image reconstruction algorithms and integrated workflow solutions are major selling points. Technological advancements are pushing the boundaries of diagnostic capabilities, enabling earlier and more accurate disease detection.
Key Drivers, Barriers & Challenges in Nuclear Imaging Market in Australia
Key Drivers:
- Increasing prevalence of chronic diseases requiring nuclear imaging.
- Technological advancements leading to improved diagnostic accuracy.
- Rising healthcare expenditure and investment in healthcare infrastructure.
Key Challenges:
- High cost of equipment and radioisotopes.
- Stringent regulatory requirements for the use of radioactive materials.
- Limited access to nuclear imaging services in rural areas. This results in an estimated xx% unmet need for nuclear imaging services in rural regions (2025).
Emerging Opportunities in Nuclear Imaging Market in Australia
Emerging opportunities lie in the expansion of nuclear imaging services into underserved rural areas through telemedicine and mobile imaging units. The growing adoption of theranostics – combining diagnostics and therapeutics using radioisotopes – presents significant growth potential. Further research and development in new radiopharmaceuticals and imaging techniques will expand the application of nuclear imaging to a wider range of diseases.
Growth Accelerators in the Nuclear Imaging Market in Australia Industry
Technological innovation remains a key growth accelerator, with ongoing advancements in PET/CT and SPECT/CT systems enhancing diagnostic capabilities and workflow efficiency. Strategic partnerships between healthcare providers, technology companies, and research institutions are fostering innovation and market expansion. Government initiatives promoting healthcare access and infrastructure development are also accelerating market growth.
Key Players Shaping the Nuclear Imaging Market in Australia Market
- Mediso Ltd
- Canon Inc (Canon Medical Systems Corporation)
- Bayer AG
- Bracco Group
- GE Healthcare
- Koninklijke Philips N V
- Novartis AG (Advanced Accelerator Applications)
- Siemens Healthineers AG
- Fujifilm Holdings Corporation
Notable Milestones in Nuclear Imaging Market in Australia Sector
- May 2021: Mediso's reference laboratory at ANSTO installed nanoScan PET/CT and SPECT/CT preclinical molecular imaging systems, enhancing research capabilities and potentially driving adoption of related clinical systems.
- April 2021: Telix Pharmaceuticals partnered with the Oncidium Foundation to establish the NOBLE Registry for SPECT imaging in prostate cancer, potentially increasing awareness and use of SPECT imaging.
In-Depth Nuclear Imaging Market in Australia Market Outlook
The Australian nuclear imaging market is poised for sustained growth over the forecast period, driven by technological advancements, expanding healthcare infrastructure, and an aging population. Strategic opportunities exist for companies investing in innovative products and services, expanding into underserved regions, and leveraging strategic partnerships to capture market share and drive further growth. The market's future success is intrinsically linked to continued technological innovation, regulatory support, and effective healthcare policies that ensure accessible and affordable nuclear imaging services for the Australian population.
Nuclear Imaging Market in Australia Segmentation
-
1. Product
- 1.1. Equipment
-
1.2. Diagnostic Radioisotope
- 1.2.1. SPECT Radioisotopes
- 1.2.2. PET Radioisotopes
-
2. Application
-
2.1. SPECT Application
- 2.1.1. Cardiology
- 2.1.2. Neurology
- 2.1.3. Thyroid
- 2.1.4. Other SPECT Applications
-
2.2. PET Application
- 2.2.1. Oncology
- 2.2.2. Other PET Applications
-
2.1. SPECT Application
Nuclear Imaging Market in Australia Segmentation By Geography
-
1. North America
- 1.1. United States
- 1.2. Canada
- 1.3. Mexico
-
2. South America
- 2.1. Brazil
- 2.2. Argentina
- 2.3. Rest of South America
-
3. Europe
- 3.1. United Kingdom
- 3.2. Germany
- 3.3. France
- 3.4. Italy
- 3.5. Spain
- 3.6. Russia
- 3.7. Benelux
- 3.8. Nordics
- 3.9. Rest of Europe
-
4. Middle East & Africa
- 4.1. Turkey
- 4.2. Israel
- 4.3. GCC
- 4.4. North Africa
- 4.5. South Africa
- 4.6. Rest of Middle East & Africa
-
5. Asia Pacific
- 5.1. China
- 5.2. India
- 5.3. Japan
- 5.4. South Korea
- 5.5. ASEAN
- 5.6. Oceania
- 5.7. Rest of Asia Pacific
Nuclear Imaging Market in Australia REPORT HIGHLIGHTS
| Aspects | Details |
|---|---|
| Study Period | 2019-2033 |
| Base Year | 2024 |
| Estimated Year | 2025 |
| Forecast Period | 2025-2033 |
| Historical Period | 2019-2024 |
| Growth Rate | CAGR of 3.53% from 2019-2033 |
| Segmentation |
|
Table of Contents
- 1. Introduction
- 1.1. Research Scope
- 1.2. Market Segmentation
- 1.3. Research Methodology
- 1.4. Definitions and Assumptions
- 2. Executive Summary
- 2.1. Introduction
- 3. Market Dynamics
- 3.1. Introduction
- 3.2. Market Drivers
- 3.2.1. Increasing Prevalence of Chronic Diseases; Rising Geriatric Population; Increasing Technological Advancements
- 3.3. Market Restrains
- 3.3.1. Lack Of Proper Reimbursement And Stringent Regulatory Approval Procedures; High Cost of Equipment
- 3.4. Market Trends
- 3.4.1. Equipment Segment is Expected to Hold a Significant Market Share Over the Forecast Period
- 4. Market Factor Analysis
- 4.1. Porters Five Forces
- 4.2. Supply/Value Chain
- 4.3. PESTEL analysis
- 4.4. Market Entropy
- 4.5. Patent/Trademark Analysis
- 5. Global Nuclear Imaging Market in Australia Analysis, Insights and Forecast, 2019-2031
- 5.1. Market Analysis, Insights and Forecast - by Product
- 5.1.1. Equipment
- 5.1.2. Diagnostic Radioisotope
- 5.1.2.1. SPECT Radioisotopes
- 5.1.2.2. PET Radioisotopes
- 5.2. Market Analysis, Insights and Forecast - by Application
- 5.2.1. SPECT Application
- 5.2.1.1. Cardiology
- 5.2.1.2. Neurology
- 5.2.1.3. Thyroid
- 5.2.1.4. Other SPECT Applications
- 5.2.2. PET Application
- 5.2.2.1. Oncology
- 5.2.2.2. Other PET Applications
- 5.2.1. SPECT Application
- 5.3. Market Analysis, Insights and Forecast - by Region
- 5.3.1. North America
- 5.3.2. South America
- 5.3.3. Europe
- 5.3.4. Middle East & Africa
- 5.3.5. Asia Pacific
- 5.1. Market Analysis, Insights and Forecast - by Product
- 6. North America Nuclear Imaging Market in Australia Analysis, Insights and Forecast, 2019-2031
- 6.1. Market Analysis, Insights and Forecast - by Product
- 6.1.1. Equipment
- 6.1.2. Diagnostic Radioisotope
- 6.1.2.1. SPECT Radioisotopes
- 6.1.2.2. PET Radioisotopes
- 6.2. Market Analysis, Insights and Forecast - by Application
- 6.2.1. SPECT Application
- 6.2.1.1. Cardiology
- 6.2.1.2. Neurology
- 6.2.1.3. Thyroid
- 6.2.1.4. Other SPECT Applications
- 6.2.2. PET Application
- 6.2.2.1. Oncology
- 6.2.2.2. Other PET Applications
- 6.2.1. SPECT Application
- 6.1. Market Analysis, Insights and Forecast - by Product
- 7. South America Nuclear Imaging Market in Australia Analysis, Insights and Forecast, 2019-2031
- 7.1. Market Analysis, Insights and Forecast - by Product
- 7.1.1. Equipment
- 7.1.2. Diagnostic Radioisotope
- 7.1.2.1. SPECT Radioisotopes
- 7.1.2.2. PET Radioisotopes
- 7.2. Market Analysis, Insights and Forecast - by Application
- 7.2.1. SPECT Application
- 7.2.1.1. Cardiology
- 7.2.1.2. Neurology
- 7.2.1.3. Thyroid
- 7.2.1.4. Other SPECT Applications
- 7.2.2. PET Application
- 7.2.2.1. Oncology
- 7.2.2.2. Other PET Applications
- 7.2.1. SPECT Application
- 7.1. Market Analysis, Insights and Forecast - by Product
- 8. Europe Nuclear Imaging Market in Australia Analysis, Insights and Forecast, 2019-2031
- 8.1. Market Analysis, Insights and Forecast - by Product
- 8.1.1. Equipment
- 8.1.2. Diagnostic Radioisotope
- 8.1.2.1. SPECT Radioisotopes
- 8.1.2.2. PET Radioisotopes
- 8.2. Market Analysis, Insights and Forecast - by Application
- 8.2.1. SPECT Application
- 8.2.1.1. Cardiology
- 8.2.1.2. Neurology
- 8.2.1.3. Thyroid
- 8.2.1.4. Other SPECT Applications
- 8.2.2. PET Application
- 8.2.2.1. Oncology
- 8.2.2.2. Other PET Applications
- 8.2.1. SPECT Application
- 8.1. Market Analysis, Insights and Forecast - by Product
- 9. Middle East & Africa Nuclear Imaging Market in Australia Analysis, Insights and Forecast, 2019-2031
- 9.1. Market Analysis, Insights and Forecast - by Product
- 9.1.1. Equipment
- 9.1.2. Diagnostic Radioisotope
- 9.1.2.1. SPECT Radioisotopes
- 9.1.2.2. PET Radioisotopes
- 9.2. Market Analysis, Insights and Forecast - by Application
- 9.2.1. SPECT Application
- 9.2.1.1. Cardiology
- 9.2.1.2. Neurology
- 9.2.1.3. Thyroid
- 9.2.1.4. Other SPECT Applications
- 9.2.2. PET Application
- 9.2.2.1. Oncology
- 9.2.2.2. Other PET Applications
- 9.2.1. SPECT Application
- 9.1. Market Analysis, Insights and Forecast - by Product
- 10. Asia Pacific Nuclear Imaging Market in Australia Analysis, Insights and Forecast, 2019-2031
- 10.1. Market Analysis, Insights and Forecast - by Product
- 10.1.1. Equipment
- 10.1.2. Diagnostic Radioisotope
- 10.1.2.1. SPECT Radioisotopes
- 10.1.2.2. PET Radioisotopes
- 10.2. Market Analysis, Insights and Forecast - by Application
- 10.2.1. SPECT Application
- 10.2.1.1. Cardiology
- 10.2.1.2. Neurology
- 10.2.1.3. Thyroid
- 10.2.1.4. Other SPECT Applications
- 10.2.2. PET Application
- 10.2.2.1. Oncology
- 10.2.2.2. Other PET Applications
- 10.2.1. SPECT Application
- 10.1. Market Analysis, Insights and Forecast - by Product
- 11. Competitive Analysis
- 11.1. Global Market Share Analysis 2024
- 11.2. Company Profiles
- 11.2.1 Mediso Ltd
- 11.2.1.1. Overview
- 11.2.1.2. Products
- 11.2.1.3. SWOT Analysis
- 11.2.1.4. Recent Developments
- 11.2.1.5. Financials (Based on Availability)
- 11.2.2 Canon Inc (Canon Medical Systems Corporation)
- 11.2.2.1. Overview
- 11.2.2.2. Products
- 11.2.2.3. SWOT Analysis
- 11.2.2.4. Recent Developments
- 11.2.2.5. Financials (Based on Availability)
- 11.2.3 Bayer AG
- 11.2.3.1. Overview
- 11.2.3.2. Products
- 11.2.3.3. SWOT Analysis
- 11.2.3.4. Recent Developments
- 11.2.3.5. Financials (Based on Availability)
- 11.2.4 Bracco Group
- 11.2.4.1. Overview
- 11.2.4.2. Products
- 11.2.4.3. SWOT Analysis
- 11.2.4.4. Recent Developments
- 11.2.4.5. Financials (Based on Availability)
- 11.2.5 GE Healthcare
- 11.2.5.1. Overview
- 11.2.5.2. Products
- 11.2.5.3. SWOT Analysis
- 11.2.5.4. Recent Developments
- 11.2.5.5. Financials (Based on Availability)
- 11.2.6 Koninklijke Philips N V
- 11.2.6.1. Overview
- 11.2.6.2. Products
- 11.2.6.3. SWOT Analysis
- 11.2.6.4. Recent Developments
- 11.2.6.5. Financials (Based on Availability)
- 11.2.7 Novartis AG (Advanced Accelerator Applications)
- 11.2.7.1. Overview
- 11.2.7.2. Products
- 11.2.7.3. SWOT Analysis
- 11.2.7.4. Recent Developments
- 11.2.7.5. Financials (Based on Availability)
- 11.2.8 Siemens Healthineers AG
- 11.2.8.1. Overview
- 11.2.8.2. Products
- 11.2.8.3. SWOT Analysis
- 11.2.8.4. Recent Developments
- 11.2.8.5. Financials (Based on Availability)
- 11.2.9 Fujifilm Holdings Corporation
- 11.2.9.1. Overview
- 11.2.9.2. Products
- 11.2.9.3. SWOT Analysis
- 11.2.9.4. Recent Developments
- 11.2.9.5. Financials (Based on Availability)
- 11.2.1 Mediso Ltd
List of Figures
- Figure 1: Global Nuclear Imaging Market in Australia Revenue Breakdown (Million, %) by Region 2024 & 2032
- Figure 2: Australia Nuclear Imaging Market in Australia Revenue (Million), by Country 2024 & 2032
- Figure 3: Australia Nuclear Imaging Market in Australia Revenue Share (%), by Country 2024 & 2032
- Figure 4: North America Nuclear Imaging Market in Australia Revenue (Million), by Product 2024 & 2032
- Figure 5: North America Nuclear Imaging Market in Australia Revenue Share (%), by Product 2024 & 2032
- Figure 6: North America Nuclear Imaging Market in Australia Revenue (Million), by Application 2024 & 2032
- Figure 7: North America Nuclear Imaging Market in Australia Revenue Share (%), by Application 2024 & 2032
- Figure 8: North America Nuclear Imaging Market in Australia Revenue (Million), by Country 2024 & 2032
- Figure 9: North America Nuclear Imaging Market in Australia Revenue Share (%), by Country 2024 & 2032
- Figure 10: South America Nuclear Imaging Market in Australia Revenue (Million), by Product 2024 & 2032
- Figure 11: South America Nuclear Imaging Market in Australia Revenue Share (%), by Product 2024 & 2032
- Figure 12: South America Nuclear Imaging Market in Australia Revenue (Million), by Application 2024 & 2032
- Figure 13: South America Nuclear Imaging Market in Australia Revenue Share (%), by Application 2024 & 2032
- Figure 14: South America Nuclear Imaging Market in Australia Revenue (Million), by Country 2024 & 2032
- Figure 15: South America Nuclear Imaging Market in Australia Revenue Share (%), by Country 2024 & 2032
- Figure 16: Europe Nuclear Imaging Market in Australia Revenue (Million), by Product 2024 & 2032
- Figure 17: Europe Nuclear Imaging Market in Australia Revenue Share (%), by Product 2024 & 2032
- Figure 18: Europe Nuclear Imaging Market in Australia Revenue (Million), by Application 2024 & 2032
- Figure 19: Europe Nuclear Imaging Market in Australia Revenue Share (%), by Application 2024 & 2032
- Figure 20: Europe Nuclear Imaging Market in Australia Revenue (Million), by Country 2024 & 2032
- Figure 21: Europe Nuclear Imaging Market in Australia Revenue Share (%), by Country 2024 & 2032
- Figure 22: Middle East & Africa Nuclear Imaging Market in Australia Revenue (Million), by Product 2024 & 2032
- Figure 23: Middle East & Africa Nuclear Imaging Market in Australia Revenue Share (%), by Product 2024 & 2032
- Figure 24: Middle East & Africa Nuclear Imaging Market in Australia Revenue (Million), by Application 2024 & 2032
- Figure 25: Middle East & Africa Nuclear Imaging Market in Australia Revenue Share (%), by Application 2024 & 2032
- Figure 26: Middle East & Africa Nuclear Imaging Market in Australia Revenue (Million), by Country 2024 & 2032
- Figure 27: Middle East & Africa Nuclear Imaging Market in Australia Revenue Share (%), by Country 2024 & 2032
- Figure 28: Asia Pacific Nuclear Imaging Market in Australia Revenue (Million), by Product 2024 & 2032
- Figure 29: Asia Pacific Nuclear Imaging Market in Australia Revenue Share (%), by Product 2024 & 2032
- Figure 30: Asia Pacific Nuclear Imaging Market in Australia Revenue (Million), by Application 2024 & 2032
- Figure 31: Asia Pacific Nuclear Imaging Market in Australia Revenue Share (%), by Application 2024 & 2032
- Figure 32: Asia Pacific Nuclear Imaging Market in Australia Revenue (Million), by Country 2024 & 2032
- Figure 33: Asia Pacific Nuclear Imaging Market in Australia Revenue Share (%), by Country 2024 & 2032
List of Tables
- Table 1: Global Nuclear Imaging Market in Australia Revenue Million Forecast, by Region 2019 & 2032
- Table 2: Global Nuclear Imaging Market in Australia Revenue Million Forecast, by Product 2019 & 2032
- Table 3: Global Nuclear Imaging Market in Australia Revenue Million Forecast, by Application 2019 & 2032
- Table 4: Global Nuclear Imaging Market in Australia Revenue Million Forecast, by Region 2019 & 2032
- Table 5: Global Nuclear Imaging Market in Australia Revenue Million Forecast, by Country 2019 & 2032
- Table 6: Global Nuclear Imaging Market in Australia Revenue Million Forecast, by Product 2019 & 2032
- Table 7: Global Nuclear Imaging Market in Australia Revenue Million Forecast, by Application 2019 & 2032
- Table 8: Global Nuclear Imaging Market in Australia Revenue Million Forecast, by Country 2019 & 2032
- Table 9: United States Nuclear Imaging Market in Australia Revenue (Million) Forecast, by Application 2019 & 2032
- Table 10: Canada Nuclear Imaging Market in Australia Revenue (Million) Forecast, by Application 2019 & 2032
- Table 11: Mexico Nuclear Imaging Market in Australia Revenue (Million) Forecast, by Application 2019 & 2032
- Table 12: Global Nuclear Imaging Market in Australia Revenue Million Forecast, by Product 2019 & 2032
- Table 13: Global Nuclear Imaging Market in Australia Revenue Million Forecast, by Application 2019 & 2032
- Table 14: Global Nuclear Imaging Market in Australia Revenue Million Forecast, by Country 2019 & 2032
- Table 15: Brazil Nuclear Imaging Market in Australia Revenue (Million) Forecast, by Application 2019 & 2032
- Table 16: Argentina Nuclear Imaging Market in Australia Revenue (Million) Forecast, by Application 2019 & 2032
- Table 17: Rest of South America Nuclear Imaging Market in Australia Revenue (Million) Forecast, by Application 2019 & 2032
- Table 18: Global Nuclear Imaging Market in Australia Revenue Million Forecast, by Product 2019 & 2032
- Table 19: Global Nuclear Imaging Market in Australia Revenue Million Forecast, by Application 2019 & 2032
- Table 20: Global Nuclear Imaging Market in Australia Revenue Million Forecast, by Country 2019 & 2032
- Table 21: United Kingdom Nuclear Imaging Market in Australia Revenue (Million) Forecast, by Application 2019 & 2032
- Table 22: Germany Nuclear Imaging Market in Australia Revenue (Million) Forecast, by Application 2019 & 2032
- Table 23: France Nuclear Imaging Market in Australia Revenue (Million) Forecast, by Application 2019 & 2032
- Table 24: Italy Nuclear Imaging Market in Australia Revenue (Million) Forecast, by Application 2019 & 2032
- Table 25: Spain Nuclear Imaging Market in Australia Revenue (Million) Forecast, by Application 2019 & 2032
- Table 26: Russia Nuclear Imaging Market in Australia Revenue (Million) Forecast, by Application 2019 & 2032
- Table 27: Benelux Nuclear Imaging Market in Australia Revenue (Million) Forecast, by Application 2019 & 2032
- Table 28: Nordics Nuclear Imaging Market in Australia Revenue (Million) Forecast, by Application 2019 & 2032
- Table 29: Rest of Europe Nuclear Imaging Market in Australia Revenue (Million) Forecast, by Application 2019 & 2032
- Table 30: Global Nuclear Imaging Market in Australia Revenue Million Forecast, by Product 2019 & 2032
- Table 31: Global Nuclear Imaging Market in Australia Revenue Million Forecast, by Application 2019 & 2032
- Table 32: Global Nuclear Imaging Market in Australia Revenue Million Forecast, by Country 2019 & 2032
- Table 33: Turkey Nuclear Imaging Market in Australia Revenue (Million) Forecast, by Application 2019 & 2032
- Table 34: Israel Nuclear Imaging Market in Australia Revenue (Million) Forecast, by Application 2019 & 2032
- Table 35: GCC Nuclear Imaging Market in Australia Revenue (Million) Forecast, by Application 2019 & 2032
- Table 36: North Africa Nuclear Imaging Market in Australia Revenue (Million) Forecast, by Application 2019 & 2032
- Table 37: South Africa Nuclear Imaging Market in Australia Revenue (Million) Forecast, by Application 2019 & 2032
- Table 38: Rest of Middle East & Africa Nuclear Imaging Market in Australia Revenue (Million) Forecast, by Application 2019 & 2032
- Table 39: Global Nuclear Imaging Market in Australia Revenue Million Forecast, by Product 2019 & 2032
- Table 40: Global Nuclear Imaging Market in Australia Revenue Million Forecast, by Application 2019 & 2032
- Table 41: Global Nuclear Imaging Market in Australia Revenue Million Forecast, by Country 2019 & 2032
- Table 42: China Nuclear Imaging Market in Australia Revenue (Million) Forecast, by Application 2019 & 2032
- Table 43: India Nuclear Imaging Market in Australia Revenue (Million) Forecast, by Application 2019 & 2032
- Table 44: Japan Nuclear Imaging Market in Australia Revenue (Million) Forecast, by Application 2019 & 2032
- Table 45: South Korea Nuclear Imaging Market in Australia Revenue (Million) Forecast, by Application 2019 & 2032
- Table 46: ASEAN Nuclear Imaging Market in Australia Revenue (Million) Forecast, by Application 2019 & 2032
- Table 47: Oceania Nuclear Imaging Market in Australia Revenue (Million) Forecast, by Application 2019 & 2032
- Table 48: Rest of Asia Pacific Nuclear Imaging Market in Australia Revenue (Million) Forecast, by Application 2019 & 2032
Frequently Asked Questions
1. What is the projected Compound Annual Growth Rate (CAGR) of the Nuclear Imaging Market in Australia?
The projected CAGR is approximately 3.53%.
2. Which companies are prominent players in the Nuclear Imaging Market in Australia?
Key companies in the market include Mediso Ltd, Canon Inc (Canon Medical Systems Corporation), Bayer AG, Bracco Group, GE Healthcare, Koninklijke Philips N V, Novartis AG (Advanced Accelerator Applications), Siemens Healthineers AG, Fujifilm Holdings Corporation.
3. What are the main segments of the Nuclear Imaging Market in Australia?
The market segments include Product, Application.
4. Can you provide details about the market size?
The market size is estimated to be USD 174.87 Million as of 2022.
5. What are some drivers contributing to market growth?
Increasing Prevalence of Chronic Diseases; Rising Geriatric Population; Increasing Technological Advancements.
6. What are the notable trends driving market growth?
Equipment Segment is Expected to Hold a Significant Market Share Over the Forecast Period.
7. Are there any restraints impacting market growth?
Lack Of Proper Reimbursement And Stringent Regulatory Approval Procedures; High Cost of Equipment.
8. Can you provide examples of recent developments in the market?
In May 2021, Mediso's reference laboratory at ANSTO, Australia's Nuclear Science and Technology Organization installed the newly acquired nanoScan PET/CT and SPECT/CT preclinical molecular imaging systems.
9. What pricing options are available for accessing the report?
Pricing options include single-user, multi-user, and enterprise licenses priced at USD 3800, USD 4500, and USD 5800 respectively.
10. Is the market size provided in terms of value or volume?
The market size is provided in terms of value, measured in Million.
11. Are there any specific market keywords associated with the report?
Yes, the market keyword associated with the report is "Nuclear Imaging Market in Australia," which aids in identifying and referencing the specific market segment covered.
12. How do I determine which pricing option suits my needs best?
The pricing options vary based on user requirements and access needs. Individual users may opt for single-user licenses, while businesses requiring broader access may choose multi-user or enterprise licenses for cost-effective access to the report.
13. Are there any additional resources or data provided in the Nuclear Imaging Market in Australia report?
While the report offers comprehensive insights, it's advisable to review the specific contents or supplementary materials provided to ascertain if additional resources or data are available.
14. How can I stay updated on further developments or reports in the Nuclear Imaging Market in Australia?
To stay informed about further developments, trends, and reports in the Nuclear Imaging Market in Australia, consider subscribing to industry newsletters, following relevant companies and organizations, or regularly checking reputable industry news sources and publications.
Methodology
Step 1 - Identification of Relevant Samples Size from Population Database


Step 2 - Approaches for Defining Global Market Size (Value, Volume* & Price*)

Note*: In applicable scenarios
Step 3 - Data Sources
Primary Research
- Web Analytics
- Survey Reports
- Research Institute
- Latest Research Reports
- Opinion Leaders
Secondary Research
- Annual Reports
- White Paper
- Latest Press Release
- Industry Association
- Paid Database
- Investor Presentations

Step 4 - Data Triangulation
Involves using different sources of information in order to increase the validity of a study
These sources are likely to be stakeholders in a program - participants, other researchers, program staff, other community members, and so on.
Then we put all data in single framework & apply various statistical tools to find out the dynamic on the market.
During the analysis stage, feedback from the stakeholder groups would be compared to determine areas of agreement as well as areas of divergence


