
Key Insights
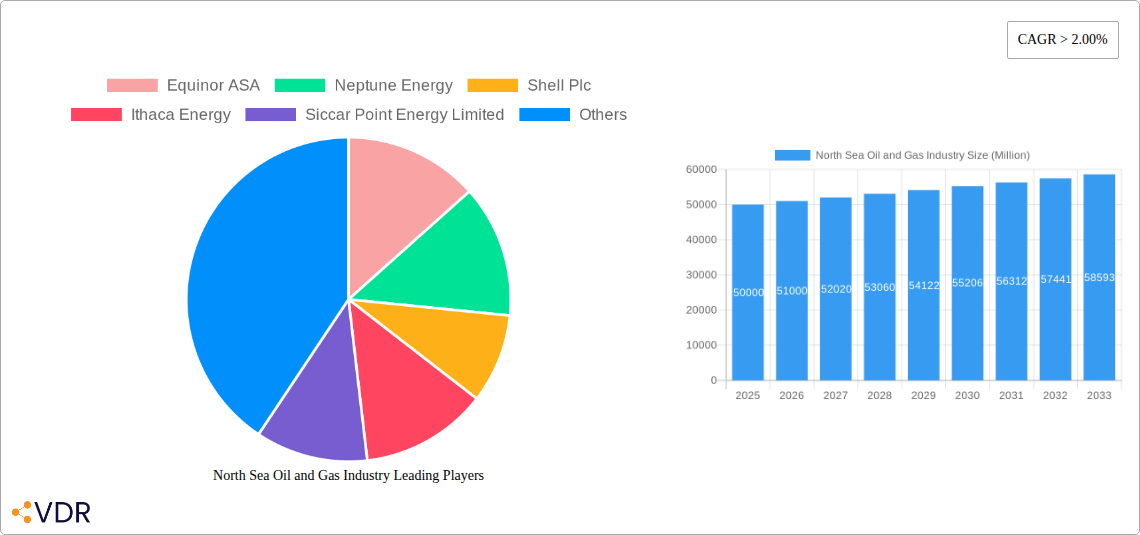
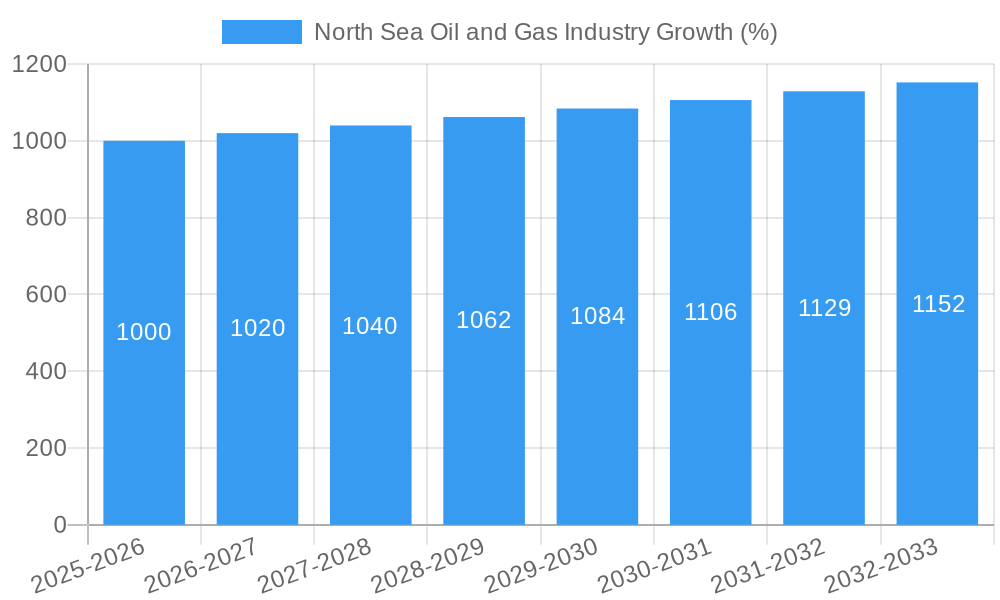
The North Sea oil and gas industry, while facing headwinds, presents a complex and dynamic market poised for moderate growth. The market, valued at approximately $50 billion in 2025, is projected to experience a compound annual growth rate (CAGR) exceeding 2% through 2033. This growth is driven primarily by sustained global energy demand, particularly in Europe, coupled with ongoing efforts to optimize existing infrastructure and explore new reserves, though at a slower pace due to environmental concerns and stricter regulations. Exploration activities, while crucial for long-term sustainability, are being cautiously approached, with a greater focus on maximizing production efficiency from existing fields. This involves investments in advanced technologies for enhanced oil recovery, improved subsea pipeline management, and optimized platform maintenance. The segment breakdown reveals a relatively balanced distribution across exploration, production, transportation, and services, indicating a robust and interconnected ecosystem. However, the industry is constrained by fluctuating oil prices, environmental regulations aimed at reducing carbon emissions, and the increasing difficulty of finding and exploiting new reserves in mature fields. The geopolitical landscape also adds complexity, with energy security concerns impacting investment decisions and market stability.
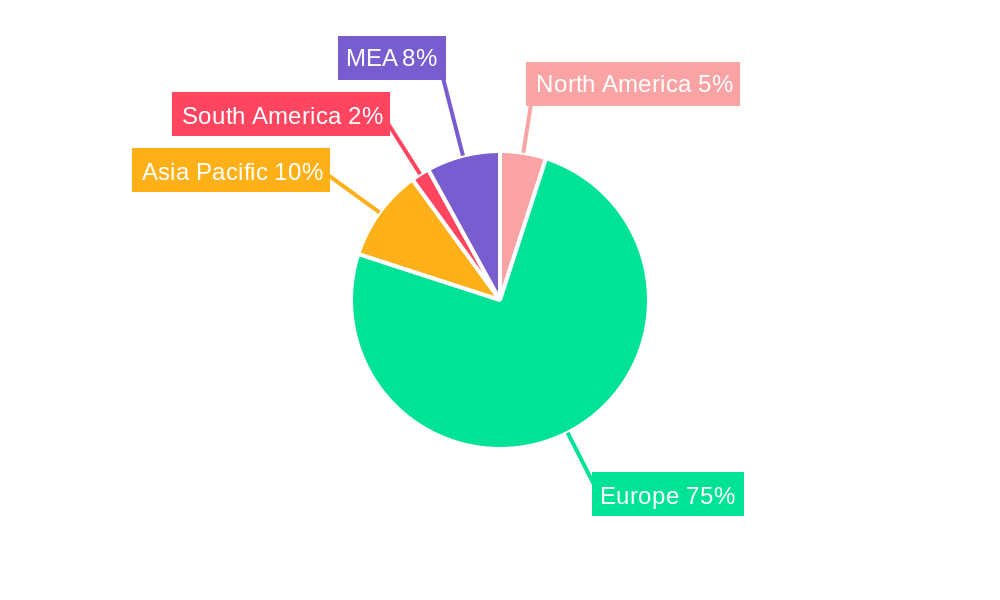
Significant regional differences exist, with the UK and Norway continuing to be dominant players in the North Sea basin. While North America holds a smaller share in direct North Sea operations, its advanced technologies and service providers play a significant supporting role. Asia-Pacific's influence is mainly indirect, through its growing energy demand and investments in the global energy sector. The ongoing energy transition towards renewables presents both a challenge and an opportunity; although the industry faces pressure to reduce its carbon footprint, the transition itself presents potential for diversification into carbon capture, utilization, and storage (CCUS) technologies and related services. This will be crucial for long-term viability and attracting future investment, ensuring the North Sea continues to play a role in the global energy mix for years to come, albeit a progressively smaller one as renewable energies increase their market share.
North Sea Oil and Gas Industry Market Report: 2019-2033
This comprehensive report provides an in-depth analysis of the North Sea oil and gas industry, encompassing market dynamics, growth trends, key players, and future outlook. The study period covers 2019-2033, with a base year of 2025 and a forecast period of 2025-2033. The report segments the market into Exploration (Seismic Surveys, Exploratory Drilling), Production (Offshore Platforms, Fixed Platforms), Transportation (Subsea Pipelines, Tankers), and Services (Supply Vessels, Maintenance and Repair), offering granular insights into each segment's performance and future trajectory. It leverages extensive primary and secondary research to present a robust analysis of this dynamic sector, crucial for industry professionals, investors, and policymakers.
North Sea Oil and Gas Industry Market Dynamics & Structure
The North Sea oil and gas market is characterized by a moderate level of concentration, with major players like Equinor ASA, Shell Plc, and BP Plc holding significant market share. However, the presence of smaller, independent companies like Ithaca Energy and Siccar Point Energy Limited adds to the competitive landscape. Technological innovation is crucial, driven by the need for enhanced oil recovery techniques and reduced environmental impact. Stringent regulatory frameworks, including emissions targets and safety regulations, heavily influence operational strategies. The industry faces competition from renewable energy sources, particularly offshore wind, which is rapidly expanding in the North Sea region. Mergers and acquisitions (M&A) activity is expected to remain relatively high, driven by the need for consolidation and access to new technologies and resources.
- Market Concentration: Moderately concentrated, with top 5 players holding approximately xx% market share in 2025.
- Technological Innovation: Focus on enhanced oil recovery (EOR) techniques, automation, and digitalization to improve efficiency and reduce costs.
- Regulatory Framework: Stringent environmental regulations and safety standards impacting operational costs and investment decisions. Carbon capture, utilization, and storage (CCUS) are increasingly important.
- Competitive Substitutes: Growing competition from renewable energy sources like offshore wind power.
- M&A Trends: Consolidation expected to continue, with an estimated xx M&A deals annually in the forecast period. Deal value expected to reach xx Million.
North Sea Oil and Gas Industry Growth Trends & Insights
The North Sea oil and gas market experienced a period of decline following the 2014 oil price crash, but it has since stabilized and is showing signs of moderate growth. This growth is attributed to several factors, including increasing global energy demand, ongoing exploration and production activities, and technological advancements that enhance extraction efficiency. However, the industry faces challenges related to declining reserves, aging infrastructure, and the growing pressure to decarbonize operations. The market is expected to witness a Compound Annual Growth Rate (CAGR) of xx% from 2025 to 2033, driven by strategic investments in CCUS and exploration activities in frontier areas. Market penetration of advanced technologies, such as automation and artificial intelligence (AI), is gradually increasing.
- Market Size Evolution: Market size is predicted to reach xx Million by 2033.
- Adoption Rates: Adoption of advanced drilling and production technologies shows steady growth.
- Technological Disruptions: CCUS, improved EOR techniques are major technological disruptions shaping the market.
- Consumer Behavior Shifts: Growing consumer awareness of environmental impact leads to pressure on the industry to decarbonize.
Dominant Regions, Countries, or Segments in North Sea Oil and Gas Industry
The UK and Norway are the dominant countries in the North Sea oil and gas industry, accounting for the majority of production and exploration activities. The production segment, particularly offshore platforms, is the largest contributor to overall market value, followed by transportation (subsea pipelines and tankers). Several factors drive growth in these regions and segments:
- UK: Favorable fiscal policies, robust infrastructure, and established operational expertise.
- Norway: Significant reserves, supportive regulatory environment, and technological advancements in subsea production.
- Production Segment (Offshore Platforms): High capital expenditure, significant reserves and technological advancements leading to higher output.
- Transportation Segment (Subsea Pipelines): The need for efficient transportation of large volumes of oil and gas.
The market share for UK is predicted to be xx% and Norway is predicted to be xx% in 2025.
North Sea Oil and Gas Industry Product Landscape
The product landscape is evolving, with a growing focus on advanced technologies and sustainable solutions. Innovations include advanced drilling techniques, subsea processing systems, and improved pipeline technologies. These advancements improve operational efficiency, reduce environmental impact, and enhance safety standards. Companies are increasingly emphasizing the unique selling propositions of their products, focusing on aspects such as cost-effectiveness, reliability, and sustainability. The industry is witnessing an increased adoption of digitalization and automation, leading to better decision-making and optimized production processes.
Key Drivers, Barriers & Challenges in North Sea Oil and Gas Industry
Key Drivers:
- Increasing global energy demand.
- Technological advancements in exploration and production.
- Government support for energy security and the energy transition.
Challenges and Restraints:
- Declining reserves in mature fields.
- High operating costs and capital expenditures.
- Stringent environmental regulations and pressure to decarbonize. This is estimated to impact the industry by xx Million annually.
- Supply chain vulnerabilities impacting the availability of specialized equipment and services.
Emerging Opportunities in North Sea Oil and Gas Industry
- CCUS: Significant potential for large-scale deployment, leveraging existing infrastructure.
- Hydrogen production: North Sea has potential for green and blue hydrogen production.
- Decommissioning activities: Growing market for specialized services and technologies.
- Offshore wind integration: Synergies between oil and gas infrastructure and offshore wind farms.
Growth Accelerators in the North Sea Oil and Gas Industry Industry
Technological breakthroughs, strategic partnerships, and expanding into new markets are key growth accelerators. Investments in CCUS technology and other decarbonization initiatives will be crucial. Collaboration among industry players, governments, and research institutions will foster innovation and accelerate the adoption of sustainable solutions. Expanding into new geographical areas, focusing on exploration and production in less-explored parts of the North Sea, can help unlock new resources.
Key Players Shaping the North Sea Oil and Gas Industry Market
- Equinor ASA
- Neptune Energy
- Shell Plc
- Ithaca Energy
- Siccar Point Energy Limited
- INEOS Group
- Vår Energi
- BP Plc
Notable Milestones in North Sea Oil and Gas Industry Sector
- March 2021: UK government agrees on a deal to support the oil and gas industry's transition to clean energy, supporting 40,000 jobs.
- January 2021: Norwegian Petroleum Directorate awards 61 production licenses to 30 companies in the APA 2020.
In-Depth North Sea Oil and Gas Industry Market Outlook
The North Sea oil and gas industry is poised for moderate growth, driven by ongoing exploration, technological advancements, and the strategic shift towards a lower-carbon future. The industry's future success will hinge on its ability to adapt to changing energy demands, embrace sustainable practices, and collaborate effectively across stakeholders to develop and implement innovative solutions. Opportunities exist in CCUS, hydrogen production, and the integration of offshore wind energy, promising significant market expansion and economic growth in the coming decade.
North Sea Oil and Gas Industry Segmentation
-
1. Geography
- 1.1. United Kingdom
- 1.2. Norway
- 1.3. Denmark
- 1.4. Rest of the Other Countries
North Sea Oil and Gas Industry Segmentation By Geography
- 1. United Kingdom
- 2. Norway
- 3. Denmark
- 4. Rest of the Other Countries
North Sea Oil and Gas Industry REPORT HIGHLIGHTS
| Aspects | Details |
|---|---|
| Study Period | 2019-2033 |
| Base Year | 2024 |
| Estimated Year | 2025 |
| Forecast Period | 2025-2033 |
| Historical Period | 2019-2024 |
| Growth Rate | CAGR of > 2.00% from 2019-2033 |
| Segmentation |
|
Table of Contents
- 1. Introduction
- 1.1. Research Scope
- 1.2. Market Segmentation
- 1.3. Research Methodology
- 1.4. Definitions and Assumptions
- 2. Executive Summary
- 2.1. Introduction
- 3. Market Dynamics
- 3.1. Introduction
- 3.2. Market Drivers
- 3.2.1. 4.; Growing Demand to Develop the Natural Gas Infrastructure4.; Increase in Offshore Oil and Gas Exploration and Production (E&P) Activities
- 3.3. Market Restrains
- 3.3.1. 4.; High Volatility of Oil and Gas Prices
- 3.4. Market Trends
- 3.4.1. Increasing Investments in Gas Sector Expected to Drive the Market Demand
- 4. Market Factor Analysis
- 4.1. Porters Five Forces
- 4.2. Supply/Value Chain
- 4.3. PESTEL analysis
- 4.4. Market Entropy
- 4.5. Patent/Trademark Analysis
- 5. Global North Sea Oil and Gas Industry Analysis, Insights and Forecast, 2019-2031
- 5.1. Market Analysis, Insights and Forecast - by Geography
- 5.1.1. United Kingdom
- 5.1.2. Norway
- 5.1.3. Denmark
- 5.1.4. Rest of the Other Countries
- 5.2. Market Analysis, Insights and Forecast - by Region
- 5.2.1. United Kingdom
- 5.2.2. Norway
- 5.2.3. Denmark
- 5.2.4. Rest of the Other Countries
- 5.1. Market Analysis, Insights and Forecast - by Geography
- 6. United Kingdom North Sea Oil and Gas Industry Analysis, Insights and Forecast, 2019-2031
- 6.1. Market Analysis, Insights and Forecast - by Geography
- 6.1.1. United Kingdom
- 6.1.2. Norway
- 6.1.3. Denmark
- 6.1.4. Rest of the Other Countries
- 6.1. Market Analysis, Insights and Forecast - by Geography
- 7. Norway North Sea Oil and Gas Industry Analysis, Insights and Forecast, 2019-2031
- 7.1. Market Analysis, Insights and Forecast - by Geography
- 7.1.1. United Kingdom
- 7.1.2. Norway
- 7.1.3. Denmark
- 7.1.4. Rest of the Other Countries
- 7.1. Market Analysis, Insights and Forecast - by Geography
- 8. Denmark North Sea Oil and Gas Industry Analysis, Insights and Forecast, 2019-2031
- 8.1. Market Analysis, Insights and Forecast - by Geography
- 8.1.1. United Kingdom
- 8.1.2. Norway
- 8.1.3. Denmark
- 8.1.4. Rest of the Other Countries
- 8.1. Market Analysis, Insights and Forecast - by Geography
- 9. Rest of the Other Countries North Sea Oil and Gas Industry Analysis, Insights and Forecast, 2019-2031
- 9.1. Market Analysis, Insights and Forecast - by Geography
- 9.1.1. United Kingdom
- 9.1.2. Norway
- 9.1.3. Denmark
- 9.1.4. Rest of the Other Countries
- 9.1. Market Analysis, Insights and Forecast - by Geography
- 10. North America North Sea Oil and Gas Industry Analysis, Insights and Forecast, 2019-2031
- 10.1. Market Analysis, Insights and Forecast - By Country/Sub-region
- 10.1.1 United States
- 10.1.2 Canada
- 10.1.3 Mexico
- 11. Europe North Sea Oil and Gas Industry Analysis, Insights and Forecast, 2019-2031
- 11.1. Market Analysis, Insights and Forecast - By Country/Sub-region
- 11.1.1 Germany
- 11.1.2 United Kingdom
- 11.1.3 France
- 11.1.4 Spain
- 11.1.5 Italy
- 11.1.6 Spain
- 11.1.7 Belgium
- 11.1.8 Netherland
- 11.1.9 Nordics
- 11.1.10 Rest of Europe
- 12. Asia Pacific North Sea Oil and Gas Industry Analysis, Insights and Forecast, 2019-2031
- 12.1. Market Analysis, Insights and Forecast - By Country/Sub-region
- 12.1.1 China
- 12.1.2 Japan
- 12.1.3 India
- 12.1.4 South Korea
- 12.1.5 Southeast Asia
- 12.1.6 Australia
- 12.1.7 Indonesia
- 12.1.8 Phillipes
- 12.1.9 Singapore
- 12.1.10 Thailandc
- 12.1.11 Rest of Asia Pacific
- 13. South America North Sea Oil and Gas Industry Analysis, Insights and Forecast, 2019-2031
- 13.1. Market Analysis, Insights and Forecast - By Country/Sub-region
- 13.1.1 Brazil
- 13.1.2 Argentina
- 13.1.3 Peru
- 13.1.4 Chile
- 13.1.5 Colombia
- 13.1.6 Ecuador
- 13.1.7 Venezuela
- 13.1.8 Rest of South America
- 14. MEA North Sea Oil and Gas Industry Analysis, Insights and Forecast, 2019-2031
- 14.1. Market Analysis, Insights and Forecast - By Country/Sub-region
- 14.1.1 United Arab Emirates
- 14.1.2 Saudi Arabia
- 14.1.3 South Africa
- 14.1.4 Rest of Middle East and Africa
- 15. Competitive Analysis
- 15.1. Global Market Share Analysis 2024
- 15.2. Company Profiles
- 15.2.1 Equinor ASA
- 15.2.1.1. Overview
- 15.2.1.2. Products
- 15.2.1.3. SWOT Analysis
- 15.2.1.4. Recent Developments
- 15.2.1.5. Financials (Based on Availability)
- 15.2.2 Neptune Energy
- 15.2.2.1. Overview
- 15.2.2.2. Products
- 15.2.2.3. SWOT Analysis
- 15.2.2.4. Recent Developments
- 15.2.2.5. Financials (Based on Availability)
- 15.2.3 Shell Plc
- 15.2.3.1. Overview
- 15.2.3.2. Products
- 15.2.3.3. SWOT Analysis
- 15.2.3.4. Recent Developments
- 15.2.3.5. Financials (Based on Availability)
- 15.2.4 Ithaca Energy
- 15.2.4.1. Overview
- 15.2.4.2. Products
- 15.2.4.3. SWOT Analysis
- 15.2.4.4. Recent Developments
- 15.2.4.5. Financials (Based on Availability)
- 15.2.5 Siccar Point Energy Limited
- 15.2.5.1. Overview
- 15.2.5.2. Products
- 15.2.5.3. SWOT Analysis
- 15.2.5.4. Recent Developments
- 15.2.5.5. Financials (Based on Availability)
- 15.2.6 INEOS Group
- 15.2.6.1. Overview
- 15.2.6.2. Products
- 15.2.6.3. SWOT Analysis
- 15.2.6.4. Recent Developments
- 15.2.6.5. Financials (Based on Availability)
- 15.2.7 Vår Energi
- 15.2.7.1. Overview
- 15.2.7.2. Products
- 15.2.7.3. SWOT Analysis
- 15.2.7.4. Recent Developments
- 15.2.7.5. Financials (Based on Availability)
- 15.2.8 BP Plc
- 15.2.8.1. Overview
- 15.2.8.2. Products
- 15.2.8.3. SWOT Analysis
- 15.2.8.4. Recent Developments
- 15.2.8.5. Financials (Based on Availability)
- 15.2.1 Equinor ASA
List of Figures
- Figure 1: Global North Sea Oil and Gas Industry Revenue Breakdown (Million, %) by Region 2024 & 2032
- Figure 2: Global North Sea Oil and Gas Industry Volume Breakdown (K Tons, %) by Region 2024 & 2032
- Figure 3: North America North Sea Oil and Gas Industry Revenue (Million), by Country 2024 & 2032
- Figure 4: North America North Sea Oil and Gas Industry Volume (K Tons), by Country 2024 & 2032
- Figure 5: North America North Sea Oil and Gas Industry Revenue Share (%), by Country 2024 & 2032
- Figure 6: North America North Sea Oil and Gas Industry Volume Share (%), by Country 2024 & 2032
- Figure 7: Europe North Sea Oil and Gas Industry Revenue (Million), by Country 2024 & 2032
- Figure 8: Europe North Sea Oil and Gas Industry Volume (K Tons), by Country 2024 & 2032
- Figure 9: Europe North Sea Oil and Gas Industry Revenue Share (%), by Country 2024 & 2032
- Figure 10: Europe North Sea Oil and Gas Industry Volume Share (%), by Country 2024 & 2032
- Figure 11: Asia Pacific North Sea Oil and Gas Industry Revenue (Million), by Country 2024 & 2032
- Figure 12: Asia Pacific North Sea Oil and Gas Industry Volume (K Tons), by Country 2024 & 2032
- Figure 13: Asia Pacific North Sea Oil and Gas Industry Revenue Share (%), by Country 2024 & 2032
- Figure 14: Asia Pacific North Sea Oil and Gas Industry Volume Share (%), by Country 2024 & 2032
- Figure 15: South America North Sea Oil and Gas Industry Revenue (Million), by Country 2024 & 2032
- Figure 16: South America North Sea Oil and Gas Industry Volume (K Tons), by Country 2024 & 2032
- Figure 17: South America North Sea Oil and Gas Industry Revenue Share (%), by Country 2024 & 2032
- Figure 18: South America North Sea Oil and Gas Industry Volume Share (%), by Country 2024 & 2032
- Figure 19: MEA North Sea Oil and Gas Industry Revenue (Million), by Country 2024 & 2032
- Figure 20: MEA North Sea Oil and Gas Industry Volume (K Tons), by Country 2024 & 2032
- Figure 21: MEA North Sea Oil and Gas Industry Revenue Share (%), by Country 2024 & 2032
- Figure 22: MEA North Sea Oil and Gas Industry Volume Share (%), by Country 2024 & 2032
- Figure 23: United Kingdom North Sea Oil and Gas Industry Revenue (Million), by Geography 2024 & 2032
- Figure 24: United Kingdom North Sea Oil and Gas Industry Volume (K Tons), by Geography 2024 & 2032
- Figure 25: United Kingdom North Sea Oil and Gas Industry Revenue Share (%), by Geography 2024 & 2032
- Figure 26: United Kingdom North Sea Oil and Gas Industry Volume Share (%), by Geography 2024 & 2032
- Figure 27: United Kingdom North Sea Oil and Gas Industry Revenue (Million), by Country 2024 & 2032
- Figure 28: United Kingdom North Sea Oil and Gas Industry Volume (K Tons), by Country 2024 & 2032
- Figure 29: United Kingdom North Sea Oil and Gas Industry Revenue Share (%), by Country 2024 & 2032
- Figure 30: United Kingdom North Sea Oil and Gas Industry Volume Share (%), by Country 2024 & 2032
- Figure 31: Norway North Sea Oil and Gas Industry Revenue (Million), by Geography 2024 & 2032
- Figure 32: Norway North Sea Oil and Gas Industry Volume (K Tons), by Geography 2024 & 2032
- Figure 33: Norway North Sea Oil and Gas Industry Revenue Share (%), by Geography 2024 & 2032
- Figure 34: Norway North Sea Oil and Gas Industry Volume Share (%), by Geography 2024 & 2032
- Figure 35: Norway North Sea Oil and Gas Industry Revenue (Million), by Country 2024 & 2032
- Figure 36: Norway North Sea Oil and Gas Industry Volume (K Tons), by Country 2024 & 2032
- Figure 37: Norway North Sea Oil and Gas Industry Revenue Share (%), by Country 2024 & 2032
- Figure 38: Norway North Sea Oil and Gas Industry Volume Share (%), by Country 2024 & 2032
- Figure 39: Denmark North Sea Oil and Gas Industry Revenue (Million), by Geography 2024 & 2032
- Figure 40: Denmark North Sea Oil and Gas Industry Volume (K Tons), by Geography 2024 & 2032
- Figure 41: Denmark North Sea Oil and Gas Industry Revenue Share (%), by Geography 2024 & 2032
- Figure 42: Denmark North Sea Oil and Gas Industry Volume Share (%), by Geography 2024 & 2032
- Figure 43: Denmark North Sea Oil and Gas Industry Revenue (Million), by Country 2024 & 2032
- Figure 44: Denmark North Sea Oil and Gas Industry Volume (K Tons), by Country 2024 & 2032
- Figure 45: Denmark North Sea Oil and Gas Industry Revenue Share (%), by Country 2024 & 2032
- Figure 46: Denmark North Sea Oil and Gas Industry Volume Share (%), by Country 2024 & 2032
- Figure 47: Rest of the Other Countries North Sea Oil and Gas Industry Revenue (Million), by Geography 2024 & 2032
- Figure 48: Rest of the Other Countries North Sea Oil and Gas Industry Volume (K Tons), by Geography 2024 & 2032
- Figure 49: Rest of the Other Countries North Sea Oil and Gas Industry Revenue Share (%), by Geography 2024 & 2032
- Figure 50: Rest of the Other Countries North Sea Oil and Gas Industry Volume Share (%), by Geography 2024 & 2032
- Figure 51: Rest of the Other Countries North Sea Oil and Gas Industry Revenue (Million), by Country 2024 & 2032
- Figure 52: Rest of the Other Countries North Sea Oil and Gas Industry Volume (K Tons), by Country 2024 & 2032
- Figure 53: Rest of the Other Countries North Sea Oil and Gas Industry Revenue Share (%), by Country 2024 & 2032
- Figure 54: Rest of the Other Countries North Sea Oil and Gas Industry Volume Share (%), by Country 2024 & 2032
List of Tables
- Table 1: Global North Sea Oil and Gas Industry Revenue Million Forecast, by Region 2019 & 2032
- Table 2: Global North Sea Oil and Gas Industry Volume K Tons Forecast, by Region 2019 & 2032
- Table 3: Global North Sea Oil and Gas Industry Revenue Million Forecast, by Geography 2019 & 2032
- Table 4: Global North Sea Oil and Gas Industry Volume K Tons Forecast, by Geography 2019 & 2032
- Table 5: Global North Sea Oil and Gas Industry Revenue Million Forecast, by Region 2019 & 2032
- Table 6: Global North Sea Oil and Gas Industry Volume K Tons Forecast, by Region 2019 & 2032
- Table 7: Global North Sea Oil and Gas Industry Revenue Million Forecast, by Country 2019 & 2032
- Table 8: Global North Sea Oil and Gas Industry Volume K Tons Forecast, by Country 2019 & 2032
- Table 9: United States North Sea Oil and Gas Industry Revenue (Million) Forecast, by Application 2019 & 2032
- Table 10: United States North Sea Oil and Gas Industry Volume (K Tons) Forecast, by Application 2019 & 2032
- Table 11: Canada North Sea Oil and Gas Industry Revenue (Million) Forecast, by Application 2019 & 2032
- Table 12: Canada North Sea Oil and Gas Industry Volume (K Tons) Forecast, by Application 2019 & 2032
- Table 13: Mexico North Sea Oil and Gas Industry Revenue (Million) Forecast, by Application 2019 & 2032
- Table 14: Mexico North Sea Oil and Gas Industry Volume (K Tons) Forecast, by Application 2019 & 2032
- Table 15: Global North Sea Oil and Gas Industry Revenue Million Forecast, by Country 2019 & 2032
- Table 16: Global North Sea Oil and Gas Industry Volume K Tons Forecast, by Country 2019 & 2032
- Table 17: Germany North Sea Oil and Gas Industry Revenue (Million) Forecast, by Application 2019 & 2032
- Table 18: Germany North Sea Oil and Gas Industry Volume (K Tons) Forecast, by Application 2019 & 2032
- Table 19: United Kingdom North Sea Oil and Gas Industry Revenue (Million) Forecast, by Application 2019 & 2032
- Table 20: United Kingdom North Sea Oil and Gas Industry Volume (K Tons) Forecast, by Application 2019 & 2032
- Table 21: France North Sea Oil and Gas Industry Revenue (Million) Forecast, by Application 2019 & 2032
- Table 22: France North Sea Oil and Gas Industry Volume (K Tons) Forecast, by Application 2019 & 2032
- Table 23: Spain North Sea Oil and Gas Industry Revenue (Million) Forecast, by Application 2019 & 2032
- Table 24: Spain North Sea Oil and Gas Industry Volume (K Tons) Forecast, by Application 2019 & 2032
- Table 25: Italy North Sea Oil and Gas Industry Revenue (Million) Forecast, by Application 2019 & 2032
- Table 26: Italy North Sea Oil and Gas Industry Volume (K Tons) Forecast, by Application 2019 & 2032
- Table 27: Spain North Sea Oil and Gas Industry Revenue (Million) Forecast, by Application 2019 & 2032
- Table 28: Spain North Sea Oil and Gas Industry Volume (K Tons) Forecast, by Application 2019 & 2032
- Table 29: Belgium North Sea Oil and Gas Industry Revenue (Million) Forecast, by Application 2019 & 2032
- Table 30: Belgium North Sea Oil and Gas Industry Volume (K Tons) Forecast, by Application 2019 & 2032
- Table 31: Netherland North Sea Oil and Gas Industry Revenue (Million) Forecast, by Application 2019 & 2032
- Table 32: Netherland North Sea Oil and Gas Industry Volume (K Tons) Forecast, by Application 2019 & 2032
- Table 33: Nordics North Sea Oil and Gas Industry Revenue (Million) Forecast, by Application 2019 & 2032
- Table 34: Nordics North Sea Oil and Gas Industry Volume (K Tons) Forecast, by Application 2019 & 2032
- Table 35: Rest of Europe North Sea Oil and Gas Industry Revenue (Million) Forecast, by Application 2019 & 2032
- Table 36: Rest of Europe North Sea Oil and Gas Industry Volume (K Tons) Forecast, by Application 2019 & 2032
- Table 37: Global North Sea Oil and Gas Industry Revenue Million Forecast, by Country 2019 & 2032
- Table 38: Global North Sea Oil and Gas Industry Volume K Tons Forecast, by Country 2019 & 2032
- Table 39: China North Sea Oil and Gas Industry Revenue (Million) Forecast, by Application 2019 & 2032
- Table 40: China North Sea Oil and Gas Industry Volume (K Tons) Forecast, by Application 2019 & 2032
- Table 41: Japan North Sea Oil and Gas Industry Revenue (Million) Forecast, by Application 2019 & 2032
- Table 42: Japan North Sea Oil and Gas Industry Volume (K Tons) Forecast, by Application 2019 & 2032
- Table 43: India North Sea Oil and Gas Industry Revenue (Million) Forecast, by Application 2019 & 2032
- Table 44: India North Sea Oil and Gas Industry Volume (K Tons) Forecast, by Application 2019 & 2032
- Table 45: South Korea North Sea Oil and Gas Industry Revenue (Million) Forecast, by Application 2019 & 2032
- Table 46: South Korea North Sea Oil and Gas Industry Volume (K Tons) Forecast, by Application 2019 & 2032
- Table 47: Southeast Asia North Sea Oil and Gas Industry Revenue (Million) Forecast, by Application 2019 & 2032
- Table 48: Southeast Asia North Sea Oil and Gas Industry Volume (K Tons) Forecast, by Application 2019 & 2032
- Table 49: Australia North Sea Oil and Gas Industry Revenue (Million) Forecast, by Application 2019 & 2032
- Table 50: Australia North Sea Oil and Gas Industry Volume (K Tons) Forecast, by Application 2019 & 2032
- Table 51: Indonesia North Sea Oil and Gas Industry Revenue (Million) Forecast, by Application 2019 & 2032
- Table 52: Indonesia North Sea Oil and Gas Industry Volume (K Tons) Forecast, by Application 2019 & 2032
- Table 53: Phillipes North Sea Oil and Gas Industry Revenue (Million) Forecast, by Application 2019 & 2032
- Table 54: Phillipes North Sea Oil and Gas Industry Volume (K Tons) Forecast, by Application 2019 & 2032
- Table 55: Singapore North Sea Oil and Gas Industry Revenue (Million) Forecast, by Application 2019 & 2032
- Table 56: Singapore North Sea Oil and Gas Industry Volume (K Tons) Forecast, by Application 2019 & 2032
- Table 57: Thailandc North Sea Oil and Gas Industry Revenue (Million) Forecast, by Application 2019 & 2032
- Table 58: Thailandc North Sea Oil and Gas Industry Volume (K Tons) Forecast, by Application 2019 & 2032
- Table 59: Rest of Asia Pacific North Sea Oil and Gas Industry Revenue (Million) Forecast, by Application 2019 & 2032
- Table 60: Rest of Asia Pacific North Sea Oil and Gas Industry Volume (K Tons) Forecast, by Application 2019 & 2032
- Table 61: Global North Sea Oil and Gas Industry Revenue Million Forecast, by Country 2019 & 2032
- Table 62: Global North Sea Oil and Gas Industry Volume K Tons Forecast, by Country 2019 & 2032
- Table 63: Brazil North Sea Oil and Gas Industry Revenue (Million) Forecast, by Application 2019 & 2032
- Table 64: Brazil North Sea Oil and Gas Industry Volume (K Tons) Forecast, by Application 2019 & 2032
- Table 65: Argentina North Sea Oil and Gas Industry Revenue (Million) Forecast, by Application 2019 & 2032
- Table 66: Argentina North Sea Oil and Gas Industry Volume (K Tons) Forecast, by Application 2019 & 2032
- Table 67: Peru North Sea Oil and Gas Industry Revenue (Million) Forecast, by Application 2019 & 2032
- Table 68: Peru North Sea Oil and Gas Industry Volume (K Tons) Forecast, by Application 2019 & 2032
- Table 69: Chile North Sea Oil and Gas Industry Revenue (Million) Forecast, by Application 2019 & 2032
- Table 70: Chile North Sea Oil and Gas Industry Volume (K Tons) Forecast, by Application 2019 & 2032
- Table 71: Colombia North Sea Oil and Gas Industry Revenue (Million) Forecast, by Application 2019 & 2032
- Table 72: Colombia North Sea Oil and Gas Industry Volume (K Tons) Forecast, by Application 2019 & 2032
- Table 73: Ecuador North Sea Oil and Gas Industry Revenue (Million) Forecast, by Application 2019 & 2032
- Table 74: Ecuador North Sea Oil and Gas Industry Volume (K Tons) Forecast, by Application 2019 & 2032
- Table 75: Venezuela North Sea Oil and Gas Industry Revenue (Million) Forecast, by Application 2019 & 2032
- Table 76: Venezuela North Sea Oil and Gas Industry Volume (K Tons) Forecast, by Application 2019 & 2032
- Table 77: Rest of South America North Sea Oil and Gas Industry Revenue (Million) Forecast, by Application 2019 & 2032
- Table 78: Rest of South America North Sea Oil and Gas Industry Volume (K Tons) Forecast, by Application 2019 & 2032
- Table 79: Global North Sea Oil and Gas Industry Revenue Million Forecast, by Country 2019 & 2032
- Table 80: Global North Sea Oil and Gas Industry Volume K Tons Forecast, by Country 2019 & 2032
- Table 81: United Arab Emirates North Sea Oil and Gas Industry Revenue (Million) Forecast, by Application 2019 & 2032
- Table 82: United Arab Emirates North Sea Oil and Gas Industry Volume (K Tons) Forecast, by Application 2019 & 2032
- Table 83: Saudi Arabia North Sea Oil and Gas Industry Revenue (Million) Forecast, by Application 2019 & 2032
- Table 84: Saudi Arabia North Sea Oil and Gas Industry Volume (K Tons) Forecast, by Application 2019 & 2032
- Table 85: South Africa North Sea Oil and Gas Industry Revenue (Million) Forecast, by Application 2019 & 2032
- Table 86: South Africa North Sea Oil and Gas Industry Volume (K Tons) Forecast, by Application 2019 & 2032
- Table 87: Rest of Middle East and Africa North Sea Oil and Gas Industry Revenue (Million) Forecast, by Application 2019 & 2032
- Table 88: Rest of Middle East and Africa North Sea Oil and Gas Industry Volume (K Tons) Forecast, by Application 2019 & 2032
- Table 89: Global North Sea Oil and Gas Industry Revenue Million Forecast, by Geography 2019 & 2032
- Table 90: Global North Sea Oil and Gas Industry Volume K Tons Forecast, by Geography 2019 & 2032
- Table 91: Global North Sea Oil and Gas Industry Revenue Million Forecast, by Country 2019 & 2032
- Table 92: Global North Sea Oil and Gas Industry Volume K Tons Forecast, by Country 2019 & 2032
- Table 93: Global North Sea Oil and Gas Industry Revenue Million Forecast, by Geography 2019 & 2032
- Table 94: Global North Sea Oil and Gas Industry Volume K Tons Forecast, by Geography 2019 & 2032
- Table 95: Global North Sea Oil and Gas Industry Revenue Million Forecast, by Country 2019 & 2032
- Table 96: Global North Sea Oil and Gas Industry Volume K Tons Forecast, by Country 2019 & 2032
- Table 97: Global North Sea Oil and Gas Industry Revenue Million Forecast, by Geography 2019 & 2032
- Table 98: Global North Sea Oil and Gas Industry Volume K Tons Forecast, by Geography 2019 & 2032
- Table 99: Global North Sea Oil and Gas Industry Revenue Million Forecast, by Country 2019 & 2032
- Table 100: Global North Sea Oil and Gas Industry Volume K Tons Forecast, by Country 2019 & 2032
- Table 101: Global North Sea Oil and Gas Industry Revenue Million Forecast, by Geography 2019 & 2032
- Table 102: Global North Sea Oil and Gas Industry Volume K Tons Forecast, by Geography 2019 & 2032
- Table 103: Global North Sea Oil and Gas Industry Revenue Million Forecast, by Country 2019 & 2032
- Table 104: Global North Sea Oil and Gas Industry Volume K Tons Forecast, by Country 2019 & 2032
Frequently Asked Questions
1. What is the projected Compound Annual Growth Rate (CAGR) of the North Sea Oil and Gas Industry?
The projected CAGR is approximately > 2.00%.
2. Which companies are prominent players in the North Sea Oil and Gas Industry?
Key companies in the market include Equinor ASA, Neptune Energy, Shell Plc, Ithaca Energy, Siccar Point Energy Limited, INEOS Group, Vår Energi, BP Plc.
3. What are the main segments of the North Sea Oil and Gas Industry?
The market segments include Geography.
4. Can you provide details about the market size?
The market size is estimated to be USD XX Million as of 2022.
5. What are some drivers contributing to market growth?
4.; Growing Demand to Develop the Natural Gas Infrastructure4.; Increase in Offshore Oil and Gas Exploration and Production (E&P) Activities.
6. What are the notable trends driving market growth?
Increasing Investments in Gas Sector Expected to Drive the Market Demand.
7. Are there any restraints impacting market growth?
4.; High Volatility of Oil and Gas Prices.
8. Can you provide examples of recent developments in the market?
In March 2021, United Kingdom became the first G7 country to be agreed on the deal to support the oil and gas industry's transition to clean, green energy, while supporting 40,000 jobs in the North Sea region. The deal between the government of the United Kingdom and the oil and gas sector industry is expected to support workers, businesses, and the supply chain through this transition by harnessing the industry's existing capabilities, infrastructure, and private investment potential to exploit new and emerging technologies such as hydrogen production, Carbon Capture Usage and Storage, offshore wind and decommissioning.
9. What pricing options are available for accessing the report?
Pricing options include single-user, multi-user, and enterprise licenses priced at USD 4750, USD 5250, and USD 8750 respectively.
10. Is the market size provided in terms of value or volume?
The market size is provided in terms of value, measured in Million and volume, measured in K Tons.
11. Are there any specific market keywords associated with the report?
Yes, the market keyword associated with the report is "North Sea Oil and Gas Industry," which aids in identifying and referencing the specific market segment covered.
12. How do I determine which pricing option suits my needs best?
The pricing options vary based on user requirements and access needs. Individual users may opt for single-user licenses, while businesses requiring broader access may choose multi-user or enterprise licenses for cost-effective access to the report.
13. Are there any additional resources or data provided in the North Sea Oil and Gas Industry report?
While the report offers comprehensive insights, it's advisable to review the specific contents or supplementary materials provided to ascertain if additional resources or data are available.
14. How can I stay updated on further developments or reports in the North Sea Oil and Gas Industry?
To stay informed about further developments, trends, and reports in the North Sea Oil and Gas Industry, consider subscribing to industry newsletters, following relevant companies and organizations, or regularly checking reputable industry news sources and publications.
Methodology
Step 1 - Identification of Relevant Samples Size from Population Database


Step 2 - Approaches for Defining Global Market Size (Value, Volume* & Price*)

Note*: In applicable scenarios
Step 3 - Data Sources
Primary Research
- Web Analytics
- Survey Reports
- Research Institute
- Latest Research Reports
- Opinion Leaders
Secondary Research
- Annual Reports
- White Paper
- Latest Press Release
- Industry Association
- Paid Database
- Investor Presentations

Step 4 - Data Triangulation
Involves using different sources of information in order to increase the validity of a study
These sources are likely to be stakeholders in a program - participants, other researchers, program staff, other community members, and so on.
Then we put all data in single framework & apply various statistical tools to find out the dynamic on the market.
During the analysis stage, feedback from the stakeholder groups would be compared to determine areas of agreement as well as areas of divergence


