
Key Insights
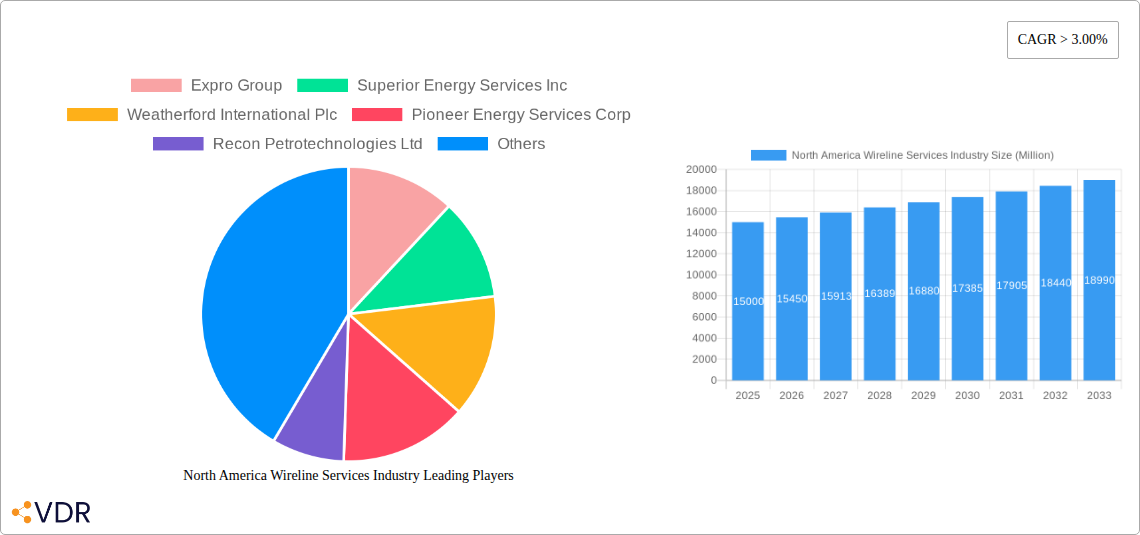
The North American wireline services market, encompassing electric line, slick line, open hole, and cased hole services across onshore and offshore deployments, is experiencing robust growth. Driven by increasing oil and gas exploration and production activities, particularly in shale formations requiring sophisticated well completion techniques, the market is projected to maintain a CAGR exceeding 3% from 2025 to 2033. Key players like Halliburton, Schlumberger, Baker Hughes, and Expro Group are leveraging technological advancements, such as improved logging tools and data analytics, to enhance operational efficiency and service offerings. The onshore segment currently dominates due to the extensive shale gas and oil reserves within North America, but the offshore segment is expected to witness considerable growth as exploration expands into deeper waters. The demand for enhanced recovery techniques and pressure-pumping solutions is further fueling market expansion. Regulatory changes related to environmental concerns and safety regulations are influencing industry practices, pushing companies to adopt more sustainable and efficient methods. Competition is intense, with companies focused on technological innovation and strategic partnerships to gain market share. The increasing adoption of automation and digital technologies, including artificial intelligence and machine learning, is transforming operations and creating opportunities for new service offerings.
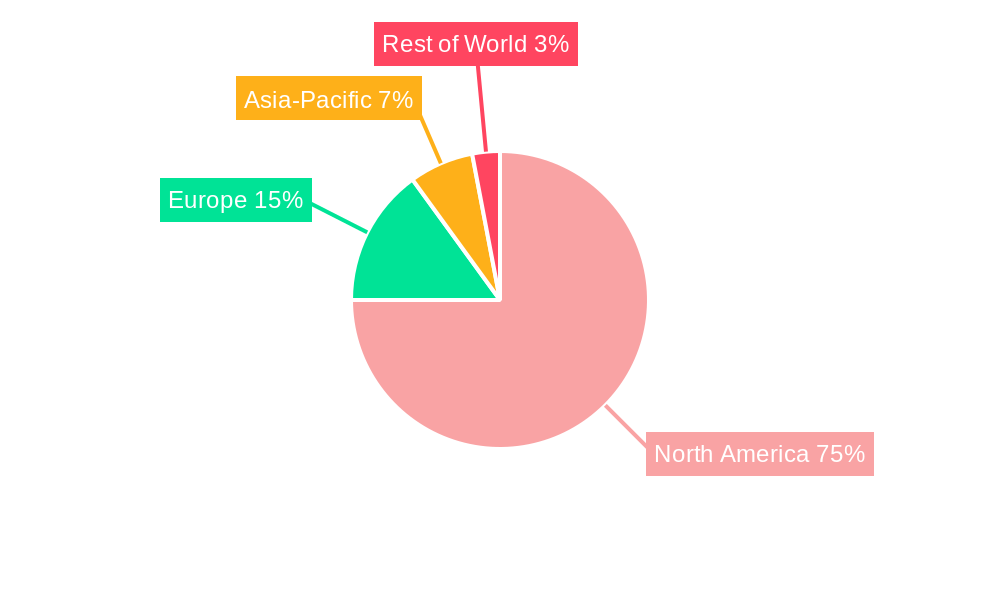
The market's growth trajectory is shaped by several factors. The ongoing energy transition, while presenting long-term challenges, simultaneously fuels demand for efficient and reliable oil and gas extraction in the short-to-medium term. This contributes to the consistent demand for wireline services. Furthermore, the focus on improving well productivity and reducing operational costs is driving innovation and the adoption of advanced wireline technologies. Despite potential headwinds from fluctuating oil and gas prices and economic uncertainty, the inherent need for efficient well completion and production monitoring makes the North American wireline services market resilient and poised for sustained expansion over the forecast period. The regional distribution within North America reflects the concentration of energy production, with the United States holding the largest market share, followed by Canada and Mexico.
This comprehensive report provides a detailed analysis of the North America wireline services industry, encompassing market size, growth trends, competitive landscape, and future outlook. The study period covers 2019-2033, with a base year of 2025 and a forecast period of 2025-2033. This report is invaluable for industry professionals, investors, and strategic decision-makers seeking to understand and capitalize on opportunities within this dynamic sector.
North America Wireline Services Industry Market Dynamics & Structure
The North American wireline services market is characterized by a moderately concentrated structure, with key players like Schlumberger, Halliburton, and Baker Hughes commanding significant market share. The market is driven by technological innovation, particularly in areas like advanced logging tools, automation, and data analytics. Stringent regulatory frameworks concerning safety and environmental protection significantly influence operational practices. Competitive substitutes, such as alternative well completion methods, exert pressure on market growth. End-user demographics are primarily driven by upstream oil and gas exploration and production companies, with a significant focus on onshore and offshore operations. The industry has witnessed several mergers and acquisitions (M&A) in recent years, reflecting consolidation and expansion strategies.
- Market Concentration: The top 5 players hold approximately XX% of the market share in 2025.
- Technological Innovation: Focus on automation, digitalization, and improved data analytics driving efficiency and cost reduction.
- Regulatory Framework: Stringent safety and environmental regulations impact operational costs and timelines.
- Competitive Substitutes: Alternative well completion techniques present competitive pressure.
- M&A Activity: XX major M&A deals were recorded between 2019 and 2024, totaling an estimated value of $XX million.
- End-User Demographics: Primarily driven by upstream oil and gas companies across onshore and offshore segments.
North America Wireline Services Industry Growth Trends & Insights
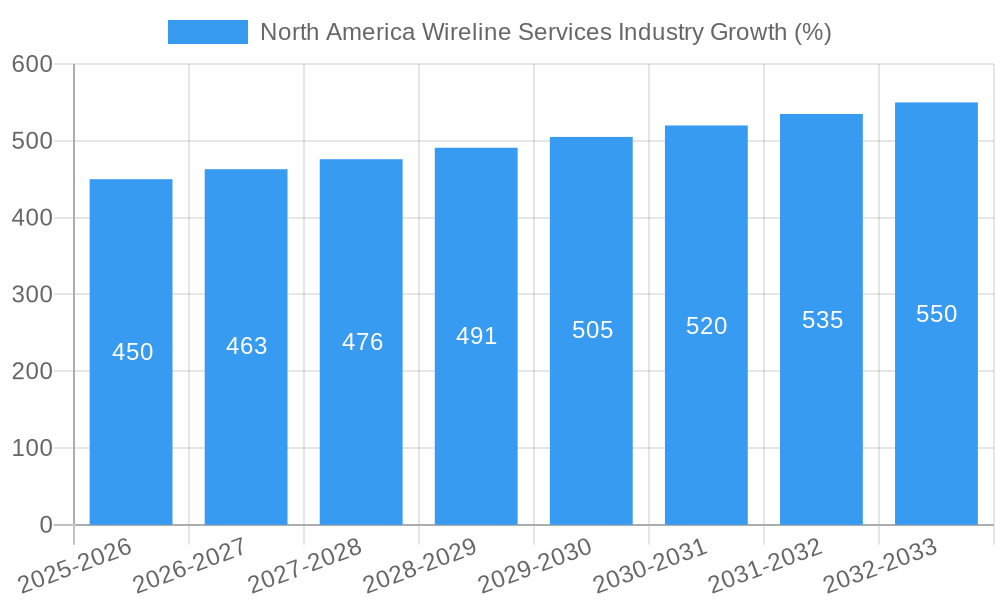
The North American wireline services market experienced fluctuating growth during the historical period (2019-2024), largely influenced by oil and gas price volatility and exploration activity. However, the market is projected to exhibit a Compound Annual Growth Rate (CAGR) of XX% during the forecast period (2025-2033), reaching a market size of $XX million by 2033. This growth is primarily driven by increasing oil and gas exploration and production activities, particularly in unconventional resources. Technological advancements are enhancing operational efficiency and improving data acquisition, further stimulating market expansion. Adoption of advanced wireline technologies is expected to increase significantly, impacting overall market penetration.
- Market Size (2025): $XX million
- Market Size (2033): $XX million
- CAGR (2025-2033): XX%
- Market Penetration (2025): XX%
Dominant Regions, Countries, or Segments in North America Wireline Services Industry
The onshore segment within the U.S. currently dominates the North American wireline services market, driven by robust shale gas and tight oil production. The electric line type holds the largest market share due to its versatility and efficiency in various well conditions. Cased hole operations also represent a significant portion of the market, reflecting the prevalence of mature oil and gas fields requiring intervention.
- Dominant Region: United States (Onshore)
- Dominant Type: Electric Line
- Dominant Hole Type: Cased Hole
- Key Drivers: High oil and gas production in the U.S., particularly shale gas and tight oil; increasing demand for well intervention and completion services.
North America Wireline Services Industry Product Landscape
The wireline services product landscape is continuously evolving, with a focus on improved data acquisition, automation, and enhanced operational safety. Recent innovations include advanced logging tools with higher resolution and improved data processing capabilities, remotely operated vehicles (ROVs) for improved safety in challenging environments, and the integration of artificial intelligence (AI) for data analysis and predictive maintenance. Key selling propositions include increased efficiency, reduced operational costs, and improved safety.
Key Drivers, Barriers & Challenges in North America Wireline Services Industry
Key Drivers: Growing demand for oil and gas, particularly unconventional resources; technological advancements improving operational efficiency; increasing investments in exploration and production activities.
Key Challenges: Fluctuations in oil and gas prices; competition from alternative well completion methods; stringent environmental regulations; skilled labor shortages; supply chain disruptions impacting equipment availability and pricing. These challenges have resulted in an estimated XX% reduction in profitability for some operators in 2024.
Emerging Opportunities in North America Wireline Services Industry
Emerging opportunities lie in the adoption of advanced technologies like AI and machine learning for data analytics, the expansion into unconventional resource development, and the growing demand for enhanced oil recovery (EOR) techniques. Furthermore, the development of more sustainable and environmentally friendly wireline solutions can present significant market expansion potential.
Growth Accelerators in the North America Wireline Services Industry Industry
Technological advancements, strategic partnerships, and the expansion into new geographical areas are key growth accelerators. Investments in research and development of advanced logging tools, automation systems, and data analytics platforms will be critical to sustained market expansion. Collaborative efforts among service providers and oil and gas companies will optimize efficiency and reduce costs.
Key Players Shaping the North America Wireline Services Industry Market
- Expro Group
- Superior Energy Services Inc
- Weatherford International Plc
- Pioneer Energy Services Corp
- Recon Petrotechnologies Ltd
- SGS SA
- Nextier Oilfield Solutions Inc
- Baker Hughes Company
- Halliburton Company
- Schlumberger Limited
Notable Milestones in North America Wireline Services Industry Sector
- May 2022: Caliber Completion Services, LLC acquired substantially all the wireline assets from ClearWell Dynamics, LLC's subsidiary, formerly known as Pioneer Wireline Services, LLC.
- Q3 2022: Schlumberger was awarded multiple scopes for an enhanced oil recovery pilot project by Denbury Onshore, LLC.
- Q3 2022: BP Canada Energy Group ULC (bp) awarded Schlumberger an integrated well construction and evaluation contract for its Ephesus deepwater exploration well in Canada offshore.
In-Depth North America Wireline Services Industry Market Outlook
The North American wireline services market is poised for sustained growth driven by technological innovation, increasing oil and gas exploration, and strategic partnerships. Opportunities exist in expanding into new markets, particularly in unconventional resources and EOR. Companies investing in advanced technologies and strategic collaborations are well-positioned to capture significant market share and benefit from the long-term growth potential of this sector.
North America Wireline Services Industry Segmentation
-
1. Type
- 1.1. Electric Line
- 1.2. Slick Line
-
2. Hole Type
- 2.1. Open Hole
- 2.2. Cased Hole
-
3. Deployment
- 3.1. Onshore
- 3.2. Offshore
-
4. Geography
- 4.1. United States
- 4.2. Canada
- 4.3. Rest of North America
North America Wireline Services Industry Segmentation By Geography
- 1. United States
- 2. Canada
- 3. Rest of North America
North America Wireline Services Industry REPORT HIGHLIGHTS
| Aspects | Details |
|---|---|
| Study Period | 2019-2033 |
| Base Year | 2024 |
| Estimated Year | 2025 |
| Forecast Period | 2025-2033 |
| Historical Period | 2019-2024 |
| Growth Rate | CAGR of > 3.00% from 2019-2033 |
| Segmentation |
|
Table of Contents
- 1. Introduction
- 1.1. Research Scope
- 1.2. Market Segmentation
- 1.3. Research Methodology
- 1.4. Definitions and Assumptions
- 2. Executive Summary
- 2.1. Introduction
- 3. Market Dynamics
- 3.1. Introduction
- 3.2. Market Drivers
- 3.2.1. 4.; Increasing Automotive Sales in Saudi Arabia4.; Rising Demand from Heavy Automotives
- 3.3. Market Restrains
- 3.3.1. 4.; Rising Emphasis on Electric Vehicles
- 3.4. Market Trends
- 3.4.1. Onshore Segment to Dominate the Market
- 4. Market Factor Analysis
- 4.1. Porters Five Forces
- 4.2. Supply/Value Chain
- 4.3. PESTEL analysis
- 4.4. Market Entropy
- 4.5. Patent/Trademark Analysis
- 5. North America Wireline Services Industry Analysis, Insights and Forecast, 2019-2031
- 5.1. Market Analysis, Insights and Forecast - by Type
- 5.1.1. Electric Line
- 5.1.2. Slick Line
- 5.2. Market Analysis, Insights and Forecast - by Hole Type
- 5.2.1. Open Hole
- 5.2.2. Cased Hole
- 5.3. Market Analysis, Insights and Forecast - by Deployment
- 5.3.1. Onshore
- 5.3.2. Offshore
- 5.4. Market Analysis, Insights and Forecast - by Geography
- 5.4.1. United States
- 5.4.2. Canada
- 5.4.3. Rest of North America
- 5.5. Market Analysis, Insights and Forecast - by Region
- 5.5.1. United States
- 5.5.2. Canada
- 5.5.3. Rest of North America
- 5.1. Market Analysis, Insights and Forecast - by Type
- 6. United States North America Wireline Services Industry Analysis, Insights and Forecast, 2019-2031
- 6.1. Market Analysis, Insights and Forecast - by Type
- 6.1.1. Electric Line
- 6.1.2. Slick Line
- 6.2. Market Analysis, Insights and Forecast - by Hole Type
- 6.2.1. Open Hole
- 6.2.2. Cased Hole
- 6.3. Market Analysis, Insights and Forecast - by Deployment
- 6.3.1. Onshore
- 6.3.2. Offshore
- 6.4. Market Analysis, Insights and Forecast - by Geography
- 6.4.1. United States
- 6.4.2. Canada
- 6.4.3. Rest of North America
- 6.1. Market Analysis, Insights and Forecast - by Type
- 7. Canada North America Wireline Services Industry Analysis, Insights and Forecast, 2019-2031
- 7.1. Market Analysis, Insights and Forecast - by Type
- 7.1.1. Electric Line
- 7.1.2. Slick Line
- 7.2. Market Analysis, Insights and Forecast - by Hole Type
- 7.2.1. Open Hole
- 7.2.2. Cased Hole
- 7.3. Market Analysis, Insights and Forecast - by Deployment
- 7.3.1. Onshore
- 7.3.2. Offshore
- 7.4. Market Analysis, Insights and Forecast - by Geography
- 7.4.1. United States
- 7.4.2. Canada
- 7.4.3. Rest of North America
- 7.1. Market Analysis, Insights and Forecast - by Type
- 8. Rest of North America North America Wireline Services Industry Analysis, Insights and Forecast, 2019-2031
- 8.1. Market Analysis, Insights and Forecast - by Type
- 8.1.1. Electric Line
- 8.1.2. Slick Line
- 8.2. Market Analysis, Insights and Forecast - by Hole Type
- 8.2.1. Open Hole
- 8.2.2. Cased Hole
- 8.3. Market Analysis, Insights and Forecast - by Deployment
- 8.3.1. Onshore
- 8.3.2. Offshore
- 8.4. Market Analysis, Insights and Forecast - by Geography
- 8.4.1. United States
- 8.4.2. Canada
- 8.4.3. Rest of North America
- 8.1. Market Analysis, Insights and Forecast - by Type
- 9. United States North America Wireline Services Industry Analysis, Insights and Forecast, 2019-2031
- 10. Canada North America Wireline Services Industry Analysis, Insights and Forecast, 2019-2031
- 11. Mexico North America Wireline Services Industry Analysis, Insights and Forecast, 2019-2031
- 12. Rest of North America North America Wireline Services Industry Analysis, Insights and Forecast, 2019-2031
- 13. Competitive Analysis
- 13.1. Market Share Analysis 2024
- 13.2. Company Profiles
- 13.2.1 Expro Group
- 13.2.1.1. Overview
- 13.2.1.2. Products
- 13.2.1.3. SWOT Analysis
- 13.2.1.4. Recent Developments
- 13.2.1.5. Financials (Based on Availability)
- 13.2.2 Superior Energy Services Inc
- 13.2.2.1. Overview
- 13.2.2.2. Products
- 13.2.2.3. SWOT Analysis
- 13.2.2.4. Recent Developments
- 13.2.2.5. Financials (Based on Availability)
- 13.2.3 Weatherford International Plc
- 13.2.3.1. Overview
- 13.2.3.2. Products
- 13.2.3.3. SWOT Analysis
- 13.2.3.4. Recent Developments
- 13.2.3.5. Financials (Based on Availability)
- 13.2.4 Pioneer Energy Services Corp
- 13.2.4.1. Overview
- 13.2.4.2. Products
- 13.2.4.3. SWOT Analysis
- 13.2.4.4. Recent Developments
- 13.2.4.5. Financials (Based on Availability)
- 13.2.5 Recon Petrotechnologies Ltd
- 13.2.5.1. Overview
- 13.2.5.2. Products
- 13.2.5.3. SWOT Analysis
- 13.2.5.4. Recent Developments
- 13.2.5.5. Financials (Based on Availability)
- 13.2.6 SGS SA
- 13.2.6.1. Overview
- 13.2.6.2. Products
- 13.2.6.3. SWOT Analysis
- 13.2.6.4. Recent Developments
- 13.2.6.5. Financials (Based on Availability)
- 13.2.7 Nextier Oilfield Solutions Inc
- 13.2.7.1. Overview
- 13.2.7.2. Products
- 13.2.7.3. SWOT Analysis
- 13.2.7.4. Recent Developments
- 13.2.7.5. Financials (Based on Availability)
- 13.2.8 Baker Hughes Company
- 13.2.8.1. Overview
- 13.2.8.2. Products
- 13.2.8.3. SWOT Analysis
- 13.2.8.4. Recent Developments
- 13.2.8.5. Financials (Based on Availability)
- 13.2.9 Halliburton Company
- 13.2.9.1. Overview
- 13.2.9.2. Products
- 13.2.9.3. SWOT Analysis
- 13.2.9.4. Recent Developments
- 13.2.9.5. Financials (Based on Availability)
- 13.2.10 Schlumberger Limited
- 13.2.10.1. Overview
- 13.2.10.2. Products
- 13.2.10.3. SWOT Analysis
- 13.2.10.4. Recent Developments
- 13.2.10.5. Financials (Based on Availability)
- 13.2.1 Expro Group
List of Figures
- Figure 1: North America Wireline Services Industry Revenue Breakdown (Million, %) by Product 2024 & 2032
- Figure 2: North America Wireline Services Industry Share (%) by Company 2024
List of Tables
- Table 1: North America Wireline Services Industry Revenue Million Forecast, by Region 2019 & 2032
- Table 2: North America Wireline Services Industry Revenue Million Forecast, by Type 2019 & 2032
- Table 3: North America Wireline Services Industry Revenue Million Forecast, by Hole Type 2019 & 2032
- Table 4: North America Wireline Services Industry Revenue Million Forecast, by Deployment 2019 & 2032
- Table 5: North America Wireline Services Industry Revenue Million Forecast, by Geography 2019 & 2032
- Table 6: North America Wireline Services Industry Revenue Million Forecast, by Region 2019 & 2032
- Table 7: North America Wireline Services Industry Revenue Million Forecast, by Country 2019 & 2032
- Table 8: United States North America Wireline Services Industry Revenue (Million) Forecast, by Application 2019 & 2032
- Table 9: Canada North America Wireline Services Industry Revenue (Million) Forecast, by Application 2019 & 2032
- Table 10: Mexico North America Wireline Services Industry Revenue (Million) Forecast, by Application 2019 & 2032
- Table 11: Rest of North America North America Wireline Services Industry Revenue (Million) Forecast, by Application 2019 & 2032
- Table 12: North America Wireline Services Industry Revenue Million Forecast, by Type 2019 & 2032
- Table 13: North America Wireline Services Industry Revenue Million Forecast, by Hole Type 2019 & 2032
- Table 14: North America Wireline Services Industry Revenue Million Forecast, by Deployment 2019 & 2032
- Table 15: North America Wireline Services Industry Revenue Million Forecast, by Geography 2019 & 2032
- Table 16: North America Wireline Services Industry Revenue Million Forecast, by Country 2019 & 2032
- Table 17: North America Wireline Services Industry Revenue Million Forecast, by Type 2019 & 2032
- Table 18: North America Wireline Services Industry Revenue Million Forecast, by Hole Type 2019 & 2032
- Table 19: North America Wireline Services Industry Revenue Million Forecast, by Deployment 2019 & 2032
- Table 20: North America Wireline Services Industry Revenue Million Forecast, by Geography 2019 & 2032
- Table 21: North America Wireline Services Industry Revenue Million Forecast, by Country 2019 & 2032
- Table 22: North America Wireline Services Industry Revenue Million Forecast, by Type 2019 & 2032
- Table 23: North America Wireline Services Industry Revenue Million Forecast, by Hole Type 2019 & 2032
- Table 24: North America Wireline Services Industry Revenue Million Forecast, by Deployment 2019 & 2032
- Table 25: North America Wireline Services Industry Revenue Million Forecast, by Geography 2019 & 2032
- Table 26: North America Wireline Services Industry Revenue Million Forecast, by Country 2019 & 2032
Frequently Asked Questions
1. What is the projected Compound Annual Growth Rate (CAGR) of the North America Wireline Services Industry?
The projected CAGR is approximately > 3.00%.
2. Which companies are prominent players in the North America Wireline Services Industry?
Key companies in the market include Expro Group, Superior Energy Services Inc, Weatherford International Plc, Pioneer Energy Services Corp, Recon Petrotechnologies Ltd, SGS SA, Nextier Oilfield Solutions Inc, Baker Hughes Company, Halliburton Company, Schlumberger Limited.
3. What are the main segments of the North America Wireline Services Industry?
The market segments include Type, Hole Type, Deployment, Geography.
4. Can you provide details about the market size?
The market size is estimated to be USD XX Million as of 2022.
5. What are some drivers contributing to market growth?
4.; Increasing Automotive Sales in Saudi Arabia4.; Rising Demand from Heavy Automotives.
6. What are the notable trends driving market growth?
Onshore Segment to Dominate the Market.
7. Are there any restraints impacting market growth?
4.; Rising Emphasis on Electric Vehicles.
8. Can you provide examples of recent developments in the market?
Q3 2022: Schlumberger was awarded multiple scopes for an enhanced oil recovery pilot project by Denbury Onshore, LLC. The award covers downhole logging, coring and core laboratory analysis, downhole completions equipment, electric submersible REDA pumps configured to handle a high concentration of CO2 in the produced fluids, and permanent distributed temperature and acoustic sensing using Optiq Schlumberger fiber-optic solutions.
9. What pricing options are available for accessing the report?
Pricing options include single-user, multi-user, and enterprise licenses priced at USD 4750, USD 5250, and USD 8750 respectively.
10. Is the market size provided in terms of value or volume?
The market size is provided in terms of value, measured in Million.
11. Are there any specific market keywords associated with the report?
Yes, the market keyword associated with the report is "North America Wireline Services Industry," which aids in identifying and referencing the specific market segment covered.
12. How do I determine which pricing option suits my needs best?
The pricing options vary based on user requirements and access needs. Individual users may opt for single-user licenses, while businesses requiring broader access may choose multi-user or enterprise licenses for cost-effective access to the report.
13. Are there any additional resources or data provided in the North America Wireline Services Industry report?
While the report offers comprehensive insights, it's advisable to review the specific contents or supplementary materials provided to ascertain if additional resources or data are available.
14. How can I stay updated on further developments or reports in the North America Wireline Services Industry?
To stay informed about further developments, trends, and reports in the North America Wireline Services Industry, consider subscribing to industry newsletters, following relevant companies and organizations, or regularly checking reputable industry news sources and publications.
Methodology
Step 1 - Identification of Relevant Samples Size from Population Database


Step 2 - Approaches for Defining Global Market Size (Value, Volume* & Price*)

Note*: In applicable scenarios
Step 3 - Data Sources
Primary Research
- Web Analytics
- Survey Reports
- Research Institute
- Latest Research Reports
- Opinion Leaders
Secondary Research
- Annual Reports
- White Paper
- Latest Press Release
- Industry Association
- Paid Database
- Investor Presentations

Step 4 - Data Triangulation
Involves using different sources of information in order to increase the validity of a study
These sources are likely to be stakeholders in a program - participants, other researchers, program staff, other community members, and so on.
Then we put all data in single framework & apply various statistical tools to find out the dynamic on the market.
During the analysis stage, feedback from the stakeholder groups would be compared to determine areas of agreement as well as areas of divergence


