
Key Insights
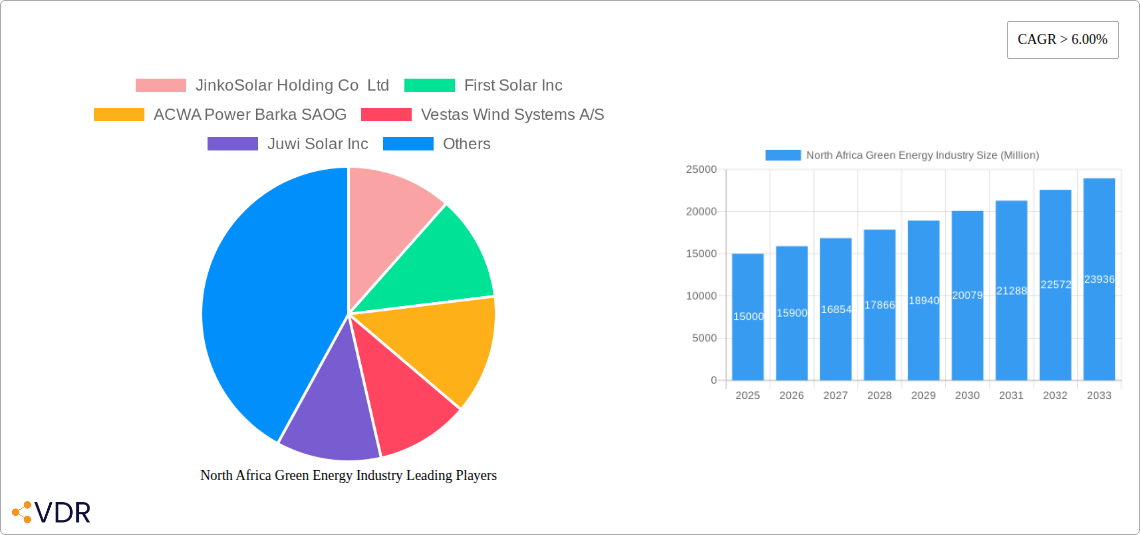
The North African green energy market, encompassing solar, wind, and other renewable sources, presents a compelling investment opportunity. Driven by increasing energy demand, ambitious government targets for renewable energy integration, and the region's abundant solar and wind resources, the market is experiencing significant growth. A CAGR exceeding 6% indicates a robust expansion trajectory, projected to reach a substantial market size by 2033. Morocco, Egypt, and Algeria are leading the charge, attracting significant foreign direct investment and fostering the development of large-scale renewable energy projects. However, challenges remain, including grid infrastructure limitations in certain areas, financing constraints for smaller-scale projects, and the need for policy stability to encourage long-term investment. The dominance of solar and wind power is expected to continue, with the "Others" segment potentially showing growth driven by emerging technologies like geothermal and biomass. Key players, including international corporations like JinkoSolar, First Solar, and Vestas, alongside regional developers like ACWA Power, are actively shaping the market landscape through project development, technology deployment, and strategic partnerships. The market's success hinges on sustained government support, technological advancements, and addressing infrastructure bottlenecks.
The growth within the North African green energy sector is projected to be driven by several factors. Government incentives and regulations supporting renewable energy adoption are crucial. The cost-competitiveness of solar and wind power compared to traditional fossil fuels is further stimulating growth. The considerable untapped potential for renewable energy resources, particularly solar in the Sahara region, presents a significant advantage. Furthermore, the increasing awareness of climate change and the need for sustainable energy solutions are bolstering the market. However, factors such as water scarcity in some regions impacting certain renewable energy technologies, and the potential need for improved energy storage solutions, must be considered. Competition amongst established players and emerging companies will continue to intensify, promoting innovation and driving down costs. Ultimately, the future of the North African green energy market hinges on sustained policy support, technological advancements, and effective strategies to manage the risks and challenges associated with large-scale renewable energy deployment.
This comprehensive report provides an in-depth analysis of the burgeoning North Africa green energy industry, encompassing market dynamics, growth trends, key players, and future outlook. With a focus on solar, wind, and other renewable energy sources across Morocco, Egypt, Algeria, and the rest of North Africa, this report is essential for investors, industry professionals, and policymakers seeking to navigate this rapidly expanding sector. The report utilizes data from 2019-2024 (Historical Period), with a Base Year of 2025 and a Forecast Period extending to 2033. Market values are presented in millions of units.
North Africa Green Energy Industry Market Dynamics & Structure
This section analyzes the North African green energy market's competitive landscape, technological advancements, regulatory environment, and market trends. We examine market concentration, identifying leading players and their market share percentages (xx%). The analysis incorporates a detailed overview of M&A activities within the sector, estimating the volume of deals closed during the study period at xx deals (Million deals).
- Market Concentration: Highly fragmented (xx%) with a growing presence of international players.
- Technological Innovation: Focus on improving efficiency of solar PV, wind turbine technology, and energy storage solutions. Barriers to innovation include lack of local manufacturing capabilities and limited R&D investment.
- Regulatory Frameworks: Vary across North African countries. Incentives such as feed-in tariffs and tax breaks drive growth, while inconsistencies across regulations pose challenges.
- Competitive Product Substitutes: Limited direct substitutes for renewable energy, but competition exists from fossil fuels, particularly in the absence of robust grid infrastructure.
- End-User Demographics: Primarily utilities, industrial users, and increasingly, residential consumers.
- M&A Trends: A rising number of strategic acquisitions by international companies to gain access to North African markets.
North Africa Green Energy Industry Growth Trends & Insights
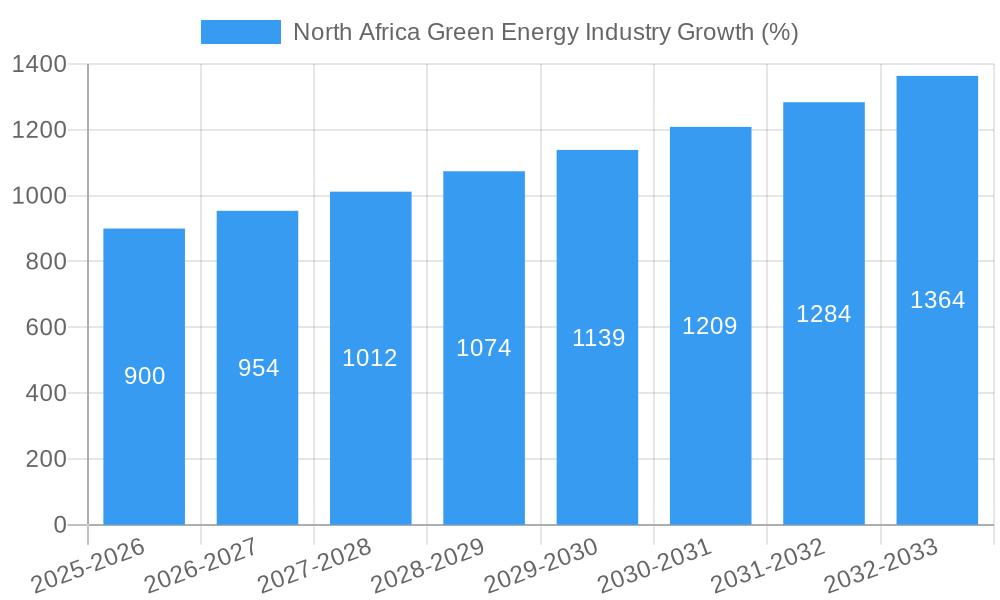
This section offers a comprehensive examination of the North African green energy market’s evolution, leveraging detailed market research data. The analysis covers market size evolution, pinpointing the compound annual growth rate (CAGR) at xx% during the forecast period. Adoption rates across different segments are examined, along with the impact of technological advancements and shifting consumer behavior.
The market size for green energy in North Africa is expected to reach xx Million USD by 2033, demonstrating the significant growth potential of the region. Factors influencing this growth include government support for renewable energy targets, increasing energy demand, and declining costs of renewable energy technologies. The report assesses changes in consumer behavior, noting a growing preference for sustainable energy solutions among residential and commercial consumers. The impact of technological advancements such as improved energy storage and smart grid technologies are analyzed.
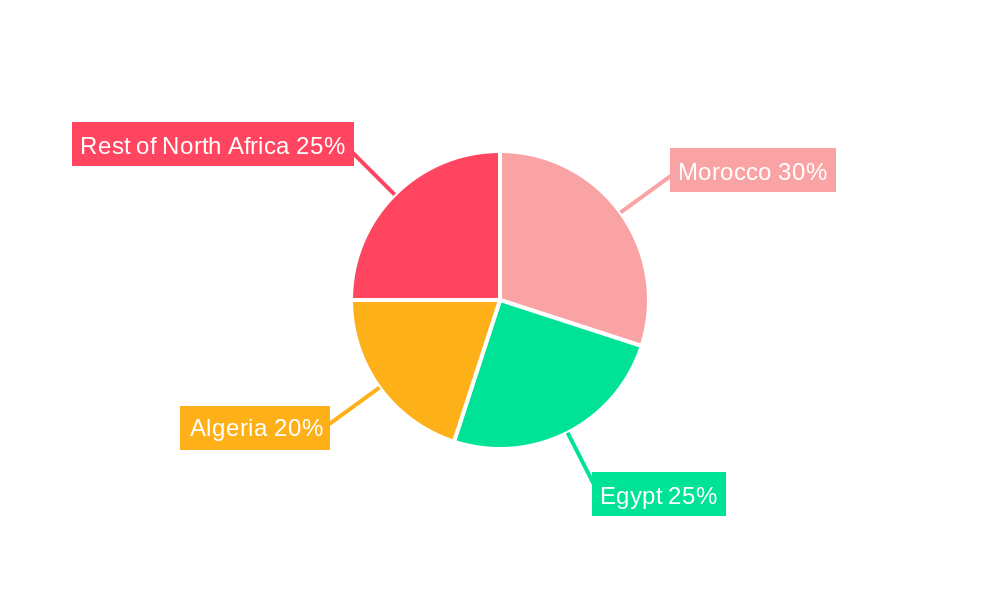
Dominant Regions, Countries, or Segments in North Africa Green Energy Industry
This analysis identifies the dominant regions, countries, and segments within the North African green energy market, examining their growth drivers and market share.
- Morocco: Leading in solar energy development due to favorable solar irradiance and government incentives. Market share (xx%).
- Egypt: Significant potential in wind and solar energy. Market share (xx%).
- Algeria: Significant untapped potential, with growth hindered by regulatory complexities. Market share (xx%).
- Rest of North Africa: A collection of smaller markets with varying degrees of development. Market share (xx%).
- Solar: Dominant segment due to abundant sunshine and cost-effectiveness of solar PV. Market share (xx%).
- Wind: Growing segment, particularly in regions with high wind speeds. Market share (xx%).
- Others: Includes geothermal, biomass, and hydropower, with limited current contribution to the overall market. Market share (xx%).
Dominance is driven by government policy, investment levels, resource availability, and grid infrastructure. Regions with supportive regulatory environments and robust grid connections exhibit faster growth.
North Africa Green Energy Industry Product Landscape
The North African green energy market showcases a diverse range of products, including high-efficiency solar PV modules, advanced wind turbines, and energy storage systems. Key innovations focus on cost reduction, performance enhancement, and improved integration with the grid. These advancements cater to various applications, from large-scale utility projects to off-grid solutions, driving market expansion. Unique selling propositions include cost competitiveness, technological advancements, and environmentally friendly operations.
Key Drivers, Barriers & Challenges in North Africa Green Energy Industry
Key Drivers:
- Government support for renewable energy targets.
- Declining costs of renewable energy technologies.
- Increasing energy demand.
- Growing awareness of climate change and sustainability.
Challenges and Restraints:
- Limited grid infrastructure in some areas.
- Regulatory inconsistencies across countries.
- Financing challenges for large-scale projects.
- Supply chain disruptions impacting project timelines and costs.
Emerging Opportunities in North Africa Green Energy Industry
Emerging opportunities include the development of off-grid solutions, integration of renewable energy into existing infrastructure, and increased focus on energy storage solutions. The expanding adoption of rooftop solar and the growth of the electric vehicle market offer further opportunities. Untapped markets in rural areas present significant potential for the expansion of renewable energy solutions.
Growth Accelerators in the North Africa Green Energy Industry
Long-term growth is fueled by technological breakthroughs in renewable energy efficiency and storage, strategic partnerships between international and local companies, and expansions into previously underserved markets. Government initiatives to enhance grid infrastructure and streamline regulatory processes act as significant catalysts.
Key Players Shaping the North Africa Green Energy Market
- JinkoSolar Holding Co Ltd
- First Solar Inc
- ACWA Power Barka SAOG
- Vestas Wind Systems A/S
- Juwi Solar Inc
- SkyPower Ltd
- Siemens Gamesa Renewable Energy SA
- Canadian Solar Inc
- Scatec Solar ASA
Notable Milestones in North Africa Green Energy Industry Sector
- December 2022: Xlinks announces plans for a 10.5 GWh solar power plant. TuNur announces plans for a 4.5 GWh solar plant in Tunisia, aiming to export electricity to Italy, France, and Malta.
- November 2022: Egypt signs agreements for two wind and solar projects (USD 1 billion combined cost) backed by the IFC.
In-Depth North Africa Green Energy Industry Market Outlook
The North African green energy market presents significant long-term growth potential, driven by increasing energy demand, supportive government policies, and declining technology costs. Strategic opportunities exist for companies that can effectively navigate the regional regulatory landscape, establish strong local partnerships, and develop innovative solutions tailored to the specific needs of this diverse market. The forecast period promises continued expansion, with solar and wind energy taking center stage.
North Africa Green Energy Industry Segmentation
-
1. Source
- 1.1. Solar
- 1.2. Wind
- 1.3. Others
-
2. Geogrpahy
- 2.1. Morocco
- 2.2. Egypt
- 2.3. Algeria
- 2.4. Rest of North Africa
North Africa Green Energy Industry Segmentation By Geography
-
1. North America
- 1.1. United States
- 1.2. Canada
- 1.3. Mexico
-
2. South America
- 2.1. Brazil
- 2.2. Argentina
- 2.3. Rest of South America
-
3. Europe
- 3.1. United Kingdom
- 3.2. Germany
- 3.3. France
- 3.4. Italy
- 3.5. Spain
- 3.6. Russia
- 3.7. Benelux
- 3.8. Nordics
- 3.9. Rest of Europe
-
4. Middle East & Africa
- 4.1. Turkey
- 4.2. Israel
- 4.3. GCC
- 4.4. North Africa
- 4.5. South Africa
- 4.6. Rest of Middle East & Africa
-
5. Asia Pacific
- 5.1. China
- 5.2. India
- 5.3. Japan
- 5.4. South Korea
- 5.5. ASEAN
- 5.6. Oceania
- 5.7. Rest of Asia Pacific
North Africa Green Energy Industry REPORT HIGHLIGHTS
| Aspects | Details |
|---|---|
| Study Period | 2019-2033 |
| Base Year | 2024 |
| Estimated Year | 2025 |
| Forecast Period | 2025-2033 |
| Historical Period | 2019-2024 |
| Growth Rate | CAGR of > 6.00% from 2019-2033 |
| Segmentation |
|
Table of Contents
- 1. Introduction
- 1.1. Research Scope
- 1.2. Market Segmentation
- 1.3. Research Methodology
- 1.4. Definitions and Assumptions
- 2. Executive Summary
- 2.1. Introduction
- 3. Market Dynamics
- 3.1. Introduction
- 3.2. Market Drivers
- 3.2.1. 4.; Demand for Solar Photovoltaic Installations4.; Growing Investments
- 3.3. Market Restrains
- 3.3.1. 4.; Increasing Wind Energy Installations
- 3.4. Market Trends
- 3.4.1. Solar Energy is Expected to Dominate the Market
- 4. Market Factor Analysis
- 4.1. Porters Five Forces
- 4.2. Supply/Value Chain
- 4.3. PESTEL analysis
- 4.4. Market Entropy
- 4.5. Patent/Trademark Analysis
- 5. Global North Africa Green Energy Industry Analysis, Insights and Forecast, 2019-2031
- 5.1. Market Analysis, Insights and Forecast - by Source
- 5.1.1. Solar
- 5.1.2. Wind
- 5.1.3. Others
- 5.2. Market Analysis, Insights and Forecast - by Geogrpahy
- 5.2.1. Morocco
- 5.2.2. Egypt
- 5.2.3. Algeria
- 5.2.4. Rest of North Africa
- 5.3. Market Analysis, Insights and Forecast - by Region
- 5.3.1. North America
- 5.3.2. South America
- 5.3.3. Europe
- 5.3.4. Middle East & Africa
- 5.3.5. Asia Pacific
- 5.1. Market Analysis, Insights and Forecast - by Source
- 6. North America North Africa Green Energy Industry Analysis, Insights and Forecast, 2019-2031
- 6.1. Market Analysis, Insights and Forecast - by Source
- 6.1.1. Solar
- 6.1.2. Wind
- 6.1.3. Others
- 6.2. Market Analysis, Insights and Forecast - by Geogrpahy
- 6.2.1. Morocco
- 6.2.2. Egypt
- 6.2.3. Algeria
- 6.2.4. Rest of North Africa
- 6.1. Market Analysis, Insights and Forecast - by Source
- 7. South America North Africa Green Energy Industry Analysis, Insights and Forecast, 2019-2031
- 7.1. Market Analysis, Insights and Forecast - by Source
- 7.1.1. Solar
- 7.1.2. Wind
- 7.1.3. Others
- 7.2. Market Analysis, Insights and Forecast - by Geogrpahy
- 7.2.1. Morocco
- 7.2.2. Egypt
- 7.2.3. Algeria
- 7.2.4. Rest of North Africa
- 7.1. Market Analysis, Insights and Forecast - by Source
- 8. Europe North Africa Green Energy Industry Analysis, Insights and Forecast, 2019-2031
- 8.1. Market Analysis, Insights and Forecast - by Source
- 8.1.1. Solar
- 8.1.2. Wind
- 8.1.3. Others
- 8.2. Market Analysis, Insights and Forecast - by Geogrpahy
- 8.2.1. Morocco
- 8.2.2. Egypt
- 8.2.3. Algeria
- 8.2.4. Rest of North Africa
- 8.1. Market Analysis, Insights and Forecast - by Source
- 9. Middle East & Africa North Africa Green Energy Industry Analysis, Insights and Forecast, 2019-2031
- 9.1. Market Analysis, Insights and Forecast - by Source
- 9.1.1. Solar
- 9.1.2. Wind
- 9.1.3. Others
- 9.2. Market Analysis, Insights and Forecast - by Geogrpahy
- 9.2.1. Morocco
- 9.2.2. Egypt
- 9.2.3. Algeria
- 9.2.4. Rest of North Africa
- 9.1. Market Analysis, Insights and Forecast - by Source
- 10. Asia Pacific North Africa Green Energy Industry Analysis, Insights and Forecast, 2019-2031
- 10.1. Market Analysis, Insights and Forecast - by Source
- 10.1.1. Solar
- 10.1.2. Wind
- 10.1.3. Others
- 10.2. Market Analysis, Insights and Forecast - by Geogrpahy
- 10.2.1. Morocco
- 10.2.2. Egypt
- 10.2.3. Algeria
- 10.2.4. Rest of North Africa
- 10.1. Market Analysis, Insights and Forecast - by Source
- 11. South Africa North Africa Green Energy Industry Analysis, Insights and Forecast, 2019-2031
- 12. Sudan North Africa Green Energy Industry Analysis, Insights and Forecast, 2019-2031
- 13. Uganda North Africa Green Energy Industry Analysis, Insights and Forecast, 2019-2031
- 14. Tanzania North Africa Green Energy Industry Analysis, Insights and Forecast, 2019-2031
- 15. Kenya North Africa Green Energy Industry Analysis, Insights and Forecast, 2019-2031
- 16. Rest of Africa North Africa Green Energy Industry Analysis, Insights and Forecast, 2019-2031
- 17. Competitive Analysis
- 17.1. Global Market Share Analysis 2024
- 17.2. Company Profiles
- 17.2.1 JinkoSolar Holding Co Ltd
- 17.2.1.1. Overview
- 17.2.1.2. Products
- 17.2.1.3. SWOT Analysis
- 17.2.1.4. Recent Developments
- 17.2.1.5. Financials (Based on Availability)
- 17.2.2 First Solar Inc
- 17.2.2.1. Overview
- 17.2.2.2. Products
- 17.2.2.3. SWOT Analysis
- 17.2.2.4. Recent Developments
- 17.2.2.5. Financials (Based on Availability)
- 17.2.3 ACWA Power Barka SAOG
- 17.2.3.1. Overview
- 17.2.3.2. Products
- 17.2.3.3. SWOT Analysis
- 17.2.3.4. Recent Developments
- 17.2.3.5. Financials (Based on Availability)
- 17.2.4 Vestas Wind Systems A/S
- 17.2.4.1. Overview
- 17.2.4.2. Products
- 17.2.4.3. SWOT Analysis
- 17.2.4.4. Recent Developments
- 17.2.4.5. Financials (Based on Availability)
- 17.2.5 Juwi Solar Inc
- 17.2.5.1. Overview
- 17.2.5.2. Products
- 17.2.5.3. SWOT Analysis
- 17.2.5.4. Recent Developments
- 17.2.5.5. Financials (Based on Availability)
- 17.2.6 SkyPower Ltd
- 17.2.6.1. Overview
- 17.2.6.2. Products
- 17.2.6.3. SWOT Analysis
- 17.2.6.4. Recent Developments
- 17.2.6.5. Financials (Based on Availability)
- 17.2.7 Siemens Gamesa Renewable Energy SA
- 17.2.7.1. Overview
- 17.2.7.2. Products
- 17.2.7.3. SWOT Analysis
- 17.2.7.4. Recent Developments
- 17.2.7.5. Financials (Based on Availability)
- 17.2.8 Canadian Solar Inc
- 17.2.8.1. Overview
- 17.2.8.2. Products
- 17.2.8.3. SWOT Analysis
- 17.2.8.4. Recent Developments
- 17.2.8.5. Financials (Based on Availability)
- 17.2.9 Scatec Solar ASA
- 17.2.9.1. Overview
- 17.2.9.2. Products
- 17.2.9.3. SWOT Analysis
- 17.2.9.4. Recent Developments
- 17.2.9.5. Financials (Based on Availability)
- 17.2.1 JinkoSolar Holding Co Ltd
List of Figures
- Figure 1: Global North Africa Green Energy Industry Revenue Breakdown (Million, %) by Region 2024 & 2032
- Figure 2: Global North Africa Green Energy Industry Volume Breakdown (Gigawatte, %) by Region 2024 & 2032
- Figure 3: Africa North Africa Green Energy Industry Revenue (Million), by Country 2024 & 2032
- Figure 4: Africa North Africa Green Energy Industry Volume (Gigawatte), by Country 2024 & 2032
- Figure 5: Africa North Africa Green Energy Industry Revenue Share (%), by Country 2024 & 2032
- Figure 6: Africa North Africa Green Energy Industry Volume Share (%), by Country 2024 & 2032
- Figure 7: North America North Africa Green Energy Industry Revenue (Million), by Source 2024 & 2032
- Figure 8: North America North Africa Green Energy Industry Volume (Gigawatte), by Source 2024 & 2032
- Figure 9: North America North Africa Green Energy Industry Revenue Share (%), by Source 2024 & 2032
- Figure 10: North America North Africa Green Energy Industry Volume Share (%), by Source 2024 & 2032
- Figure 11: North America North Africa Green Energy Industry Revenue (Million), by Geogrpahy 2024 & 2032
- Figure 12: North America North Africa Green Energy Industry Volume (Gigawatte), by Geogrpahy 2024 & 2032
- Figure 13: North America North Africa Green Energy Industry Revenue Share (%), by Geogrpahy 2024 & 2032
- Figure 14: North America North Africa Green Energy Industry Volume Share (%), by Geogrpahy 2024 & 2032
- Figure 15: North America North Africa Green Energy Industry Revenue (Million), by Country 2024 & 2032
- Figure 16: North America North Africa Green Energy Industry Volume (Gigawatte), by Country 2024 & 2032
- Figure 17: North America North Africa Green Energy Industry Revenue Share (%), by Country 2024 & 2032
- Figure 18: North America North Africa Green Energy Industry Volume Share (%), by Country 2024 & 2032
- Figure 19: South America North Africa Green Energy Industry Revenue (Million), by Source 2024 & 2032
- Figure 20: South America North Africa Green Energy Industry Volume (Gigawatte), by Source 2024 & 2032
- Figure 21: South America North Africa Green Energy Industry Revenue Share (%), by Source 2024 & 2032
- Figure 22: South America North Africa Green Energy Industry Volume Share (%), by Source 2024 & 2032
- Figure 23: South America North Africa Green Energy Industry Revenue (Million), by Geogrpahy 2024 & 2032
- Figure 24: South America North Africa Green Energy Industry Volume (Gigawatte), by Geogrpahy 2024 & 2032
- Figure 25: South America North Africa Green Energy Industry Revenue Share (%), by Geogrpahy 2024 & 2032
- Figure 26: South America North Africa Green Energy Industry Volume Share (%), by Geogrpahy 2024 & 2032
- Figure 27: South America North Africa Green Energy Industry Revenue (Million), by Country 2024 & 2032
- Figure 28: South America North Africa Green Energy Industry Volume (Gigawatte), by Country 2024 & 2032
- Figure 29: South America North Africa Green Energy Industry Revenue Share (%), by Country 2024 & 2032
- Figure 30: South America North Africa Green Energy Industry Volume Share (%), by Country 2024 & 2032
- Figure 31: Europe North Africa Green Energy Industry Revenue (Million), by Source 2024 & 2032
- Figure 32: Europe North Africa Green Energy Industry Volume (Gigawatte), by Source 2024 & 2032
- Figure 33: Europe North Africa Green Energy Industry Revenue Share (%), by Source 2024 & 2032
- Figure 34: Europe North Africa Green Energy Industry Volume Share (%), by Source 2024 & 2032
- Figure 35: Europe North Africa Green Energy Industry Revenue (Million), by Geogrpahy 2024 & 2032
- Figure 36: Europe North Africa Green Energy Industry Volume (Gigawatte), by Geogrpahy 2024 & 2032
- Figure 37: Europe North Africa Green Energy Industry Revenue Share (%), by Geogrpahy 2024 & 2032
- Figure 38: Europe North Africa Green Energy Industry Volume Share (%), by Geogrpahy 2024 & 2032
- Figure 39: Europe North Africa Green Energy Industry Revenue (Million), by Country 2024 & 2032
- Figure 40: Europe North Africa Green Energy Industry Volume (Gigawatte), by Country 2024 & 2032
- Figure 41: Europe North Africa Green Energy Industry Revenue Share (%), by Country 2024 & 2032
- Figure 42: Europe North Africa Green Energy Industry Volume Share (%), by Country 2024 & 2032
- Figure 43: Middle East & Africa North Africa Green Energy Industry Revenue (Million), by Source 2024 & 2032
- Figure 44: Middle East & Africa North Africa Green Energy Industry Volume (Gigawatte), by Source 2024 & 2032
- Figure 45: Middle East & Africa North Africa Green Energy Industry Revenue Share (%), by Source 2024 & 2032
- Figure 46: Middle East & Africa North Africa Green Energy Industry Volume Share (%), by Source 2024 & 2032
- Figure 47: Middle East & Africa North Africa Green Energy Industry Revenue (Million), by Geogrpahy 2024 & 2032
- Figure 48: Middle East & Africa North Africa Green Energy Industry Volume (Gigawatte), by Geogrpahy 2024 & 2032
- Figure 49: Middle East & Africa North Africa Green Energy Industry Revenue Share (%), by Geogrpahy 2024 & 2032
- Figure 50: Middle East & Africa North Africa Green Energy Industry Volume Share (%), by Geogrpahy 2024 & 2032
- Figure 51: Middle East & Africa North Africa Green Energy Industry Revenue (Million), by Country 2024 & 2032
- Figure 52: Middle East & Africa North Africa Green Energy Industry Volume (Gigawatte), by Country 2024 & 2032
- Figure 53: Middle East & Africa North Africa Green Energy Industry Revenue Share (%), by Country 2024 & 2032
- Figure 54: Middle East & Africa North Africa Green Energy Industry Volume Share (%), by Country 2024 & 2032
- Figure 55: Asia Pacific North Africa Green Energy Industry Revenue (Million), by Source 2024 & 2032
- Figure 56: Asia Pacific North Africa Green Energy Industry Volume (Gigawatte), by Source 2024 & 2032
- Figure 57: Asia Pacific North Africa Green Energy Industry Revenue Share (%), by Source 2024 & 2032
- Figure 58: Asia Pacific North Africa Green Energy Industry Volume Share (%), by Source 2024 & 2032
- Figure 59: Asia Pacific North Africa Green Energy Industry Revenue (Million), by Geogrpahy 2024 & 2032
- Figure 60: Asia Pacific North Africa Green Energy Industry Volume (Gigawatte), by Geogrpahy 2024 & 2032
- Figure 61: Asia Pacific North Africa Green Energy Industry Revenue Share (%), by Geogrpahy 2024 & 2032
- Figure 62: Asia Pacific North Africa Green Energy Industry Volume Share (%), by Geogrpahy 2024 & 2032
- Figure 63: Asia Pacific North Africa Green Energy Industry Revenue (Million), by Country 2024 & 2032
- Figure 64: Asia Pacific North Africa Green Energy Industry Volume (Gigawatte), by Country 2024 & 2032
- Figure 65: Asia Pacific North Africa Green Energy Industry Revenue Share (%), by Country 2024 & 2032
- Figure 66: Asia Pacific North Africa Green Energy Industry Volume Share (%), by Country 2024 & 2032
List of Tables
- Table 1: Global North Africa Green Energy Industry Revenue Million Forecast, by Region 2019 & 2032
- Table 2: Global North Africa Green Energy Industry Volume Gigawatte Forecast, by Region 2019 & 2032
- Table 3: Global North Africa Green Energy Industry Revenue Million Forecast, by Source 2019 & 2032
- Table 4: Global North Africa Green Energy Industry Volume Gigawatte Forecast, by Source 2019 & 2032
- Table 5: Global North Africa Green Energy Industry Revenue Million Forecast, by Geogrpahy 2019 & 2032
- Table 6: Global North Africa Green Energy Industry Volume Gigawatte Forecast, by Geogrpahy 2019 & 2032
- Table 7: Global North Africa Green Energy Industry Revenue Million Forecast, by Region 2019 & 2032
- Table 8: Global North Africa Green Energy Industry Volume Gigawatte Forecast, by Region 2019 & 2032
- Table 9: Global North Africa Green Energy Industry Revenue Million Forecast, by Country 2019 & 2032
- Table 10: Global North Africa Green Energy Industry Volume Gigawatte Forecast, by Country 2019 & 2032
- Table 11: South Africa North Africa Green Energy Industry Revenue (Million) Forecast, by Application 2019 & 2032
- Table 12: South Africa North Africa Green Energy Industry Volume (Gigawatte) Forecast, by Application 2019 & 2032
- Table 13: Sudan North Africa Green Energy Industry Revenue (Million) Forecast, by Application 2019 & 2032
- Table 14: Sudan North Africa Green Energy Industry Volume (Gigawatte) Forecast, by Application 2019 & 2032
- Table 15: Uganda North Africa Green Energy Industry Revenue (Million) Forecast, by Application 2019 & 2032
- Table 16: Uganda North Africa Green Energy Industry Volume (Gigawatte) Forecast, by Application 2019 & 2032
- Table 17: Tanzania North Africa Green Energy Industry Revenue (Million) Forecast, by Application 2019 & 2032
- Table 18: Tanzania North Africa Green Energy Industry Volume (Gigawatte) Forecast, by Application 2019 & 2032
- Table 19: Kenya North Africa Green Energy Industry Revenue (Million) Forecast, by Application 2019 & 2032
- Table 20: Kenya North Africa Green Energy Industry Volume (Gigawatte) Forecast, by Application 2019 & 2032
- Table 21: Rest of Africa North Africa Green Energy Industry Revenue (Million) Forecast, by Application 2019 & 2032
- Table 22: Rest of Africa North Africa Green Energy Industry Volume (Gigawatte) Forecast, by Application 2019 & 2032
- Table 23: Global North Africa Green Energy Industry Revenue Million Forecast, by Source 2019 & 2032
- Table 24: Global North Africa Green Energy Industry Volume Gigawatte Forecast, by Source 2019 & 2032
- Table 25: Global North Africa Green Energy Industry Revenue Million Forecast, by Geogrpahy 2019 & 2032
- Table 26: Global North Africa Green Energy Industry Volume Gigawatte Forecast, by Geogrpahy 2019 & 2032
- Table 27: Global North Africa Green Energy Industry Revenue Million Forecast, by Country 2019 & 2032
- Table 28: Global North Africa Green Energy Industry Volume Gigawatte Forecast, by Country 2019 & 2032
- Table 29: United States North Africa Green Energy Industry Revenue (Million) Forecast, by Application 2019 & 2032
- Table 30: United States North Africa Green Energy Industry Volume (Gigawatte) Forecast, by Application 2019 & 2032
- Table 31: Canada North Africa Green Energy Industry Revenue (Million) Forecast, by Application 2019 & 2032
- Table 32: Canada North Africa Green Energy Industry Volume (Gigawatte) Forecast, by Application 2019 & 2032
- Table 33: Mexico North Africa Green Energy Industry Revenue (Million) Forecast, by Application 2019 & 2032
- Table 34: Mexico North Africa Green Energy Industry Volume (Gigawatte) Forecast, by Application 2019 & 2032
- Table 35: Global North Africa Green Energy Industry Revenue Million Forecast, by Source 2019 & 2032
- Table 36: Global North Africa Green Energy Industry Volume Gigawatte Forecast, by Source 2019 & 2032
- Table 37: Global North Africa Green Energy Industry Revenue Million Forecast, by Geogrpahy 2019 & 2032
- Table 38: Global North Africa Green Energy Industry Volume Gigawatte Forecast, by Geogrpahy 2019 & 2032
- Table 39: Global North Africa Green Energy Industry Revenue Million Forecast, by Country 2019 & 2032
- Table 40: Global North Africa Green Energy Industry Volume Gigawatte Forecast, by Country 2019 & 2032
- Table 41: Brazil North Africa Green Energy Industry Revenue (Million) Forecast, by Application 2019 & 2032
- Table 42: Brazil North Africa Green Energy Industry Volume (Gigawatte) Forecast, by Application 2019 & 2032
- Table 43: Argentina North Africa Green Energy Industry Revenue (Million) Forecast, by Application 2019 & 2032
- Table 44: Argentina North Africa Green Energy Industry Volume (Gigawatte) Forecast, by Application 2019 & 2032
- Table 45: Rest of South America North Africa Green Energy Industry Revenue (Million) Forecast, by Application 2019 & 2032
- Table 46: Rest of South America North Africa Green Energy Industry Volume (Gigawatte) Forecast, by Application 2019 & 2032
- Table 47: Global North Africa Green Energy Industry Revenue Million Forecast, by Source 2019 & 2032
- Table 48: Global North Africa Green Energy Industry Volume Gigawatte Forecast, by Source 2019 & 2032
- Table 49: Global North Africa Green Energy Industry Revenue Million Forecast, by Geogrpahy 2019 & 2032
- Table 50: Global North Africa Green Energy Industry Volume Gigawatte Forecast, by Geogrpahy 2019 & 2032
- Table 51: Global North Africa Green Energy Industry Revenue Million Forecast, by Country 2019 & 2032
- Table 52: Global North Africa Green Energy Industry Volume Gigawatte Forecast, by Country 2019 & 2032
- Table 53: United Kingdom North Africa Green Energy Industry Revenue (Million) Forecast, by Application 2019 & 2032
- Table 54: United Kingdom North Africa Green Energy Industry Volume (Gigawatte) Forecast, by Application 2019 & 2032
- Table 55: Germany North Africa Green Energy Industry Revenue (Million) Forecast, by Application 2019 & 2032
- Table 56: Germany North Africa Green Energy Industry Volume (Gigawatte) Forecast, by Application 2019 & 2032
- Table 57: France North Africa Green Energy Industry Revenue (Million) Forecast, by Application 2019 & 2032
- Table 58: France North Africa Green Energy Industry Volume (Gigawatte) Forecast, by Application 2019 & 2032
- Table 59: Italy North Africa Green Energy Industry Revenue (Million) Forecast, by Application 2019 & 2032
- Table 60: Italy North Africa Green Energy Industry Volume (Gigawatte) Forecast, by Application 2019 & 2032
- Table 61: Spain North Africa Green Energy Industry Revenue (Million) Forecast, by Application 2019 & 2032
- Table 62: Spain North Africa Green Energy Industry Volume (Gigawatte) Forecast, by Application 2019 & 2032
- Table 63: Russia North Africa Green Energy Industry Revenue (Million) Forecast, by Application 2019 & 2032
- Table 64: Russia North Africa Green Energy Industry Volume (Gigawatte) Forecast, by Application 2019 & 2032
- Table 65: Benelux North Africa Green Energy Industry Revenue (Million) Forecast, by Application 2019 & 2032
- Table 66: Benelux North Africa Green Energy Industry Volume (Gigawatte) Forecast, by Application 2019 & 2032
- Table 67: Nordics North Africa Green Energy Industry Revenue (Million) Forecast, by Application 2019 & 2032
- Table 68: Nordics North Africa Green Energy Industry Volume (Gigawatte) Forecast, by Application 2019 & 2032
- Table 69: Rest of Europe North Africa Green Energy Industry Revenue (Million) Forecast, by Application 2019 & 2032
- Table 70: Rest of Europe North Africa Green Energy Industry Volume (Gigawatte) Forecast, by Application 2019 & 2032
- Table 71: Global North Africa Green Energy Industry Revenue Million Forecast, by Source 2019 & 2032
- Table 72: Global North Africa Green Energy Industry Volume Gigawatte Forecast, by Source 2019 & 2032
- Table 73: Global North Africa Green Energy Industry Revenue Million Forecast, by Geogrpahy 2019 & 2032
- Table 74: Global North Africa Green Energy Industry Volume Gigawatte Forecast, by Geogrpahy 2019 & 2032
- Table 75: Global North Africa Green Energy Industry Revenue Million Forecast, by Country 2019 & 2032
- Table 76: Global North Africa Green Energy Industry Volume Gigawatte Forecast, by Country 2019 & 2032
- Table 77: Turkey North Africa Green Energy Industry Revenue (Million) Forecast, by Application 2019 & 2032
- Table 78: Turkey North Africa Green Energy Industry Volume (Gigawatte) Forecast, by Application 2019 & 2032
- Table 79: Israel North Africa Green Energy Industry Revenue (Million) Forecast, by Application 2019 & 2032
- Table 80: Israel North Africa Green Energy Industry Volume (Gigawatte) Forecast, by Application 2019 & 2032
- Table 81: GCC North Africa Green Energy Industry Revenue (Million) Forecast, by Application 2019 & 2032
- Table 82: GCC North Africa Green Energy Industry Volume (Gigawatte) Forecast, by Application 2019 & 2032
- Table 83: North Africa North Africa Green Energy Industry Revenue (Million) Forecast, by Application 2019 & 2032
- Table 84: North Africa North Africa Green Energy Industry Volume (Gigawatte) Forecast, by Application 2019 & 2032
- Table 85: South Africa North Africa Green Energy Industry Revenue (Million) Forecast, by Application 2019 & 2032
- Table 86: South Africa North Africa Green Energy Industry Volume (Gigawatte) Forecast, by Application 2019 & 2032
- Table 87: Rest of Middle East & Africa North Africa Green Energy Industry Revenue (Million) Forecast, by Application 2019 & 2032
- Table 88: Rest of Middle East & Africa North Africa Green Energy Industry Volume (Gigawatte) Forecast, by Application 2019 & 2032
- Table 89: Global North Africa Green Energy Industry Revenue Million Forecast, by Source 2019 & 2032
- Table 90: Global North Africa Green Energy Industry Volume Gigawatte Forecast, by Source 2019 & 2032
- Table 91: Global North Africa Green Energy Industry Revenue Million Forecast, by Geogrpahy 2019 & 2032
- Table 92: Global North Africa Green Energy Industry Volume Gigawatte Forecast, by Geogrpahy 2019 & 2032
- Table 93: Global North Africa Green Energy Industry Revenue Million Forecast, by Country 2019 & 2032
- Table 94: Global North Africa Green Energy Industry Volume Gigawatte Forecast, by Country 2019 & 2032
- Table 95: China North Africa Green Energy Industry Revenue (Million) Forecast, by Application 2019 & 2032
- Table 96: China North Africa Green Energy Industry Volume (Gigawatte) Forecast, by Application 2019 & 2032
- Table 97: India North Africa Green Energy Industry Revenue (Million) Forecast, by Application 2019 & 2032
- Table 98: India North Africa Green Energy Industry Volume (Gigawatte) Forecast, by Application 2019 & 2032
- Table 99: Japan North Africa Green Energy Industry Revenue (Million) Forecast, by Application 2019 & 2032
- Table 100: Japan North Africa Green Energy Industry Volume (Gigawatte) Forecast, by Application 2019 & 2032
- Table 101: South Korea North Africa Green Energy Industry Revenue (Million) Forecast, by Application 2019 & 2032
- Table 102: South Korea North Africa Green Energy Industry Volume (Gigawatte) Forecast, by Application 2019 & 2032
- Table 103: ASEAN North Africa Green Energy Industry Revenue (Million) Forecast, by Application 2019 & 2032
- Table 104: ASEAN North Africa Green Energy Industry Volume (Gigawatte) Forecast, by Application 2019 & 2032
- Table 105: Oceania North Africa Green Energy Industry Revenue (Million) Forecast, by Application 2019 & 2032
- Table 106: Oceania North Africa Green Energy Industry Volume (Gigawatte) Forecast, by Application 2019 & 2032
- Table 107: Rest of Asia Pacific North Africa Green Energy Industry Revenue (Million) Forecast, by Application 2019 & 2032
- Table 108: Rest of Asia Pacific North Africa Green Energy Industry Volume (Gigawatte) Forecast, by Application 2019 & 2032
Frequently Asked Questions
1. What is the projected Compound Annual Growth Rate (CAGR) of the North Africa Green Energy Industry?
The projected CAGR is approximately > 6.00%.
2. Which companies are prominent players in the North Africa Green Energy Industry?
Key companies in the market include JinkoSolar Holding Co Ltd, First Solar Inc, ACWA Power Barka SAOG, Vestas Wind Systems A/S, Juwi Solar Inc, SkyPower Ltd, Siemens Gamesa Renewable Energy SA, Canadian Solar Inc, Scatec Solar ASA.
3. What are the main segments of the North Africa Green Energy Industry?
The market segments include Source, Geogrpahy.
4. Can you provide details about the market size?
The market size is estimated to be USD XX Million as of 2022.
5. What are some drivers contributing to market growth?
4.; Demand for Solar Photovoltaic Installations4.; Growing Investments.
6. What are the notable trends driving market growth?
Solar Energy is Expected to Dominate the Market.
7. Are there any restraints impacting market growth?
4.; Increasing Wind Energy Installations.
8. Can you provide examples of recent developments in the market?
December 2022: a British company, Xlinks, has announced the installation of a 10.5 GWh solar power plant. Similarly, TuNur, a renewable energy developer, announced its plans to generate 4.5 GWh of electricity from a solar power plant in Tunisia and export it to export to Italy, France, and Malta with an aim to reduce European CO emissions.
9. What pricing options are available for accessing the report?
Pricing options include single-user, multi-user, and enterprise licenses priced at USD 4750, USD 5250, and USD 8750 respectively.
10. Is the market size provided in terms of value or volume?
The market size is provided in terms of value, measured in Million and volume, measured in Gigawatte.
11. Are there any specific market keywords associated with the report?
Yes, the market keyword associated with the report is "North Africa Green Energy Industry," which aids in identifying and referencing the specific market segment covered.
12. How do I determine which pricing option suits my needs best?
The pricing options vary based on user requirements and access needs. Individual users may opt for single-user licenses, while businesses requiring broader access may choose multi-user or enterprise licenses for cost-effective access to the report.
13. Are there any additional resources or data provided in the North Africa Green Energy Industry report?
While the report offers comprehensive insights, it's advisable to review the specific contents or supplementary materials provided to ascertain if additional resources or data are available.
14. How can I stay updated on further developments or reports in the North Africa Green Energy Industry?
To stay informed about further developments, trends, and reports in the North Africa Green Energy Industry, consider subscribing to industry newsletters, following relevant companies and organizations, or regularly checking reputable industry news sources and publications.
Methodology
Step 1 - Identification of Relevant Samples Size from Population Database


Step 2 - Approaches for Defining Global Market Size (Value, Volume* & Price*)

Note*: In applicable scenarios
Step 3 - Data Sources
Primary Research
- Web Analytics
- Survey Reports
- Research Institute
- Latest Research Reports
- Opinion Leaders
Secondary Research
- Annual Reports
- White Paper
- Latest Press Release
- Industry Association
- Paid Database
- Investor Presentations

Step 4 - Data Triangulation
Involves using different sources of information in order to increase the validity of a study
These sources are likely to be stakeholders in a program - participants, other researchers, program staff, other community members, and so on.
Then we put all data in single framework & apply various statistical tools to find out the dynamic on the market.
During the analysis stage, feedback from the stakeholder groups would be compared to determine areas of agreement as well as areas of divergence


