
Key Insights
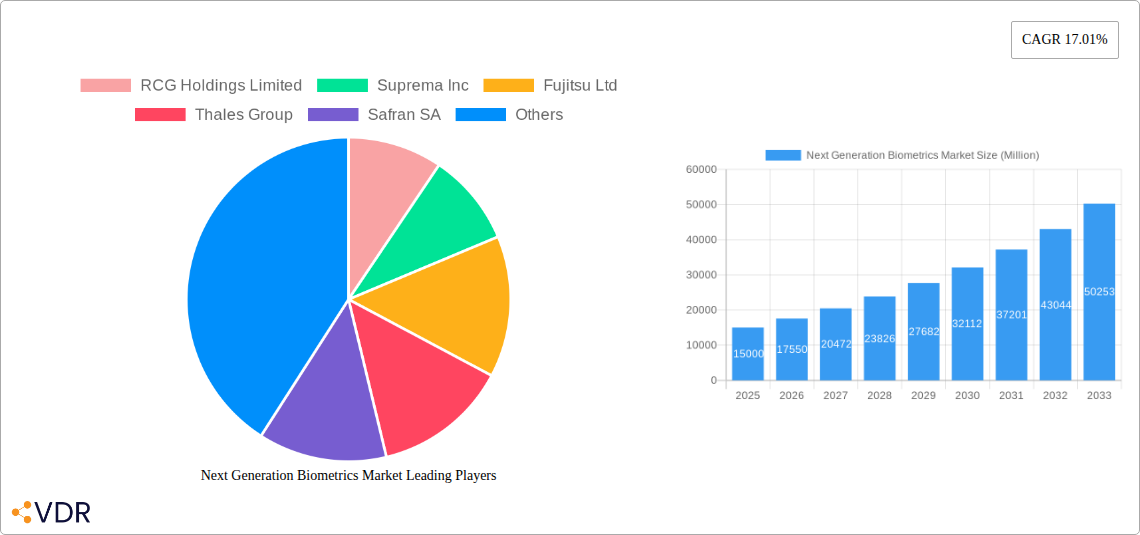
The Next Generation Biometrics Market is experiencing robust growth, projected to reach a substantial value by 2033. A Compound Annual Growth Rate (CAGR) of 17.01% from 2019 to 2024 indicates significant market expansion driven by increasing demand for secure authentication across various sectors. Key drivers include rising concerns over data security breaches, the need for streamlined user authentication processes, and the expanding adoption of biometric technologies in government initiatives, particularly border control and citizen identification programs. Furthermore, advancements in biometric technology, such as improved accuracy, speed, and ease of use, particularly in areas like facial and iris recognition, are fueling market growth. The market is segmented by solution type (face, fingerprint, iris, palm print, signature recognition, and others) and end-user vertical (government, defense, travel, home security, banking, healthcare, and others). Face recognition currently holds a dominant market share due to its widespread adoption and ease of implementation. However, other modalities like iris and fingerprint recognition are witnessing considerable growth due to their high accuracy and security features. The Asia-Pacific region, specifically China and India, is projected to witness the highest growth rate due to substantial government investments in biometric infrastructure and large population bases. North America remains a significant market, driven by strong adoption in sectors like banking and finance, while Europe is characterized by a more mature market with consistent growth.
The competitive landscape is characterized by a mix of established players and emerging companies. Major players such as RCG Holdings Limited, Suprema Inc., Fujitsu Ltd., Thales Group, and IDEMIA are investing heavily in R&D to improve accuracy, security, and usability of their biometric solutions. The market is further shaped by strategic partnerships, acquisitions, and technological advancements, driving innovation and competition. While the market faces challenges such as data privacy concerns and the potential for bias in biometric algorithms, the overall trend points towards continued expansion, driven by the increasing need for secure and efficient authentication solutions in a digitally connected world. The forecast period of 2025-2033 promises further market expansion, with specific regional variations dependent on adoption rates and government regulations. Estimating a market size requires additional base year data, but given the CAGR, a substantial increase over the 2024 market value is expected by 2033.
Next Generation Biometrics Market: A Comprehensive Report (2019-2033)
This comprehensive report provides a detailed analysis of the Next Generation Biometrics Market, encompassing market dynamics, growth trends, regional insights, and key player strategies. The study period covers 2019-2033, with 2025 serving as the base and estimated year. The forecast period is 2025-2033, and the historical period is 2019-2024. The report segments the market by Type of Solution (Face Recognition, Fingerprint Recognition, Iris Recognition, Palm Print Recognition, Signature Recognition, Other Types of Solutions) and End-user Vertical (Government, Defense, Travel and Immigration, Home Security, Banking and Financial Service, Healthcare, Other End-user Verticals). The market size is presented in Million units.
Next Generation Biometrics Market Dynamics & Structure
The Next Generation Biometrics market is experiencing rapid growth driven by increasing demand for secure authentication and identification across various sectors. Market concentration is moderate, with several key players holding significant market share, while numerous smaller companies are also active. Technological innovation, particularly in areas like AI-powered biometrics and multimodal systems, is a major driver. However, stringent regulatory frameworks and data privacy concerns pose significant challenges. The market also faces competitive pressure from traditional security methods. The adoption of next-generation biometrics is influenced by end-user demographics, with government and defense sectors leading the way. M&A activity has been significant, with larger companies acquiring smaller, specialized firms to expand their product portfolios and technological capabilities. The value of M&A deals in the period 2019-2024 is estimated at xx Million units.
- Market Concentration: Moderate, with a few dominant players and numerous smaller competitors.
- Technological Innovation: AI-powered biometrics, multimodal solutions, and improved accuracy are key drivers.
- Regulatory Frameworks: GDPR, CCPA, and other regulations impact data privacy and security, creating both opportunities and challenges.
- Competitive Substitutes: Traditional security methods like passwords and access cards continue to compete.
- End-User Demographics: Government and defense sectors are early adopters, followed by travel and financial services.
- M&A Trends: Significant consolidation through acquisitions to expand market share and technological capabilities. Estimated xx Million units worth of deals in 2019-2024.
Next Generation Biometrics Market Growth Trends & Insights
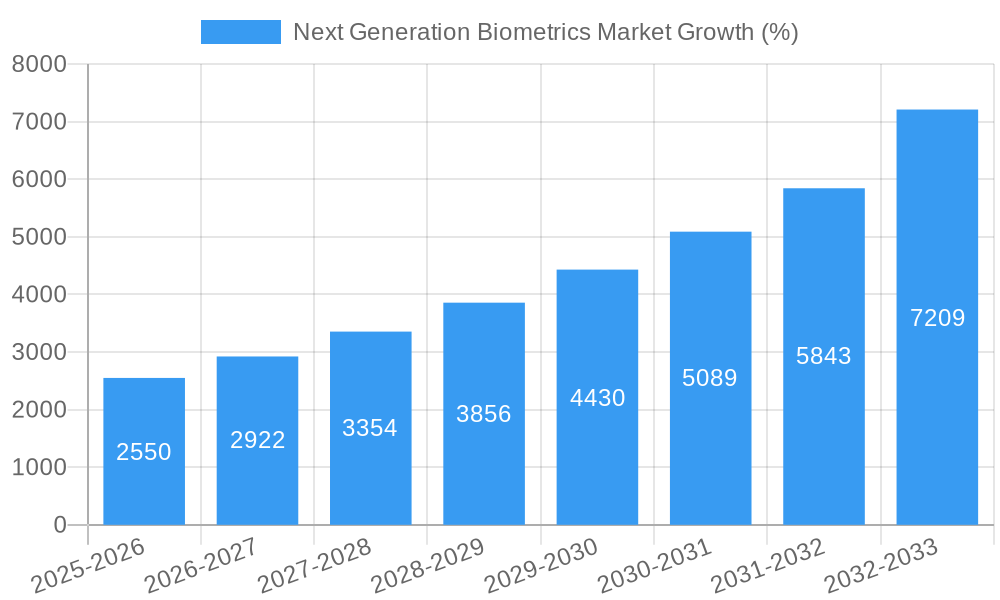
The Next Generation Biometrics market is projected to experience substantial growth during the forecast period (2025-2033), driven by the increasing adoption of biometric authentication across various sectors. The market size in 2025 is estimated at xx Million units and is expected to reach xx Million units by 2033, exhibiting a CAGR of xx%. This growth is fueled by several factors, including the rising need for enhanced security, increasing government investments in infrastructure projects, and the growing popularity of contactless technologies. Technological advancements, such as improved algorithms, miniaturization of sensors, and advancements in AI and machine learning, are further accelerating market expansion. The penetration rate of biometric technologies is also increasing steadily across different sectors. Consumer behavior shifts towards contactless solutions and a greater awareness of data security contribute significantly to market growth. Technological disruptions, like the introduction of new biometric modalities and improved data analytics, further enhance the appeal and efficacy of next-generation solutions.
Dominant Regions, Countries, or Segments in Next Generation Biometrics Market
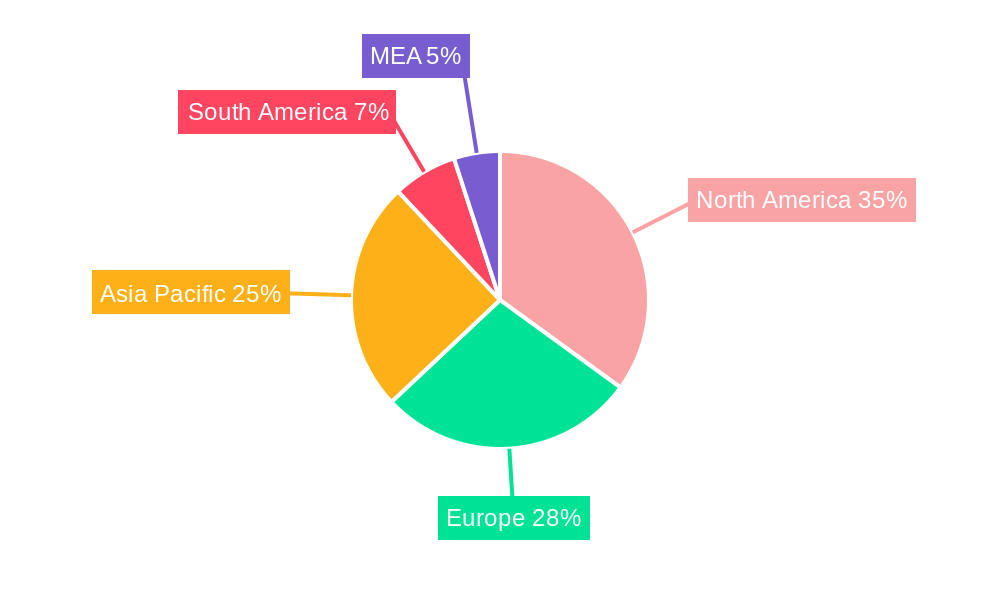
North America and Europe currently dominate the Next Generation Biometrics market, driven by high technological advancements, stringent security regulations, and considerable investments in infrastructure projects. However, the Asia-Pacific region is expected to experience the fastest growth during the forecast period due to rapid economic growth, increasing smartphone penetration, and rising government initiatives to enhance national security. Within the segments, Face Recognition and Fingerprint Recognition are currently the largest, while Iris Recognition and other emerging technologies exhibit high growth potential.
- North America: High adoption rate due to advanced technology and strong regulatory framework. Market share estimated at xx%.
- Europe: Strong growth due to increasing security concerns and government investments. Market share estimated at xx%.
- Asia-Pacific: Fastest-growing region driven by economic expansion and rising smartphone usage. Market share estimated at xx%.
- Face Recognition: Dominates by volume due to ease of implementation and high accuracy. Market share estimated at xx%.
- Fingerprint Recognition: Second largest segment, benefiting from established technology and widespread adoption. Market share estimated at xx%.
- Government & Defense: Highest spending due to critical security requirements. Market share estimated at xx%.
- Travel & Immigration: Significant growth driven by need for efficient border control. Market share estimated at xx%.
Next Generation Biometrics Market Product Landscape
The Next Generation Biometrics market showcases continuous product innovation, with a focus on enhancing accuracy, speed, and user experience. New products incorporate advanced algorithms, improved sensor technology, and AI-powered capabilities for superior performance. These advancements enable seamless integration across various applications, from access control systems to mobile devices. Unique selling propositions include improved accuracy, reduced error rates, and enhanced security features, often integrated with other security measures for enhanced protection. The market is characterized by a diverse range of products, catering to specific industry needs and application requirements.
Key Drivers, Barriers & Challenges in Next Generation Biometrics Market
Key Drivers: Increasing demand for secure authentication, growing adoption of mobile biometric solutions, government initiatives promoting digital identity, and advancements in AI and machine learning. For instance, the rising adoption of contactless payment systems fuels demand for fingerprint and facial recognition technologies.
Key Challenges: Concerns over data privacy and security, high implementation costs, lack of standardization across different systems, and potential biases in biometric algorithms leading to inaccurate or discriminatory outcomes. These challenges can limit adoption rates and create significant hurdles for market expansion. Supply chain disruptions could also hinder production and delivery, impacting availability and pricing.
Emerging Opportunities in Next Generation Biometrics Market
Emerging opportunities lie in the expansion of biometric applications into new sectors like healthcare, personal wellness devices, and advanced identity management systems. The development of more robust and ethical AI algorithms to mitigate potential biases represents another key opportunity. Moreover, the convergence of biometrics with other technologies, such as blockchain and IoT, opens exciting possibilities for secure and efficient systems. The demand for multimodal biometric systems that combine multiple methods for enhanced security is expected to increase significantly.
Growth Accelerators in the Next Generation Biometrics Market Industry
Technological breakthroughs, particularly in AI-powered biometrics, are driving accelerated market growth. Strategic partnerships between technology companies and end-users foster collaboration and innovation. Government policies promoting digital identity and border control initiatives accelerate adoption. Market expansion into developing economies with growing populations and increasing smartphone penetration is another catalyst for long-term growth.
Key Players Shaping the Next Generation Biometrics Market Market
- RCG Holdings Limited
- Suprema Inc
- Fujitsu Ltd
- Thales Group
- Safran SA
- Siemens AG
- Fingerprint Cards AB
- NEC Corporation
- Cross Match Technologies
- IDEMIA
Notable Milestones in Next Generation Biometrics Market Sector
- June 2022: Vision-Box launched its Seamless Kiosk, a biometric solution aiming to revolutionize travel experiences.
- May 2022: IDEMIA introduced two new MorphoWave contactless fingerprint terminals, enhancing accessibility and affordability.
- January 2022: IDEMIA partnered with Microsoft to develop next-generation eSIM and connection technologies.
In-Depth Next Generation Biometrics Market Market Outlook
The Next Generation Biometrics market is poised for sustained growth, driven by continuous technological advancements, increasing security concerns across diverse sectors, and rising government investments in digital infrastructure. Strategic partnerships and the expansion into untapped markets will further propel market expansion. Companies focusing on innovation, data security, and user-friendly solutions are expected to gain a significant competitive advantage. The long-term outlook remains positive, with opportunities for substantial market growth and significant returns on investment.
Next Generation Biometrics Market Segmentation
-
1. Type of Solution
- 1.1. Face Recognition
- 1.2. Fingerprint Recognition
- 1.3. Iris Recognition
- 1.4. Palm Print Recognition
- 1.5. Signature Recognition
- 1.6. Other Types of Solutions
-
2. End-user Vertical
- 2.1. Government
- 2.2. Defense
- 2.3. Travel and Immigration
- 2.4. Home Security
- 2.5. Banking and Financial Service
- 2.6. Healthcare
- 2.7. Other End-user Verticals
Next Generation Biometrics Market Segmentation By Geography
- 1. North America
- 2. Europe
- 3. Asia Pacific
- 4. Middle East
- 5. Latin America
Next Generation Biometrics Market REPORT HIGHLIGHTS
| Aspects | Details |
|---|---|
| Study Period | 2019-2033 |
| Base Year | 2024 |
| Estimated Year | 2025 |
| Forecast Period | 2025-2033 |
| Historical Period | 2019-2024 |
| Growth Rate | CAGR of 17.01% from 2019-2033 |
| Segmentation |
|
Table of Contents
- 1. Introduction
- 1.1. Research Scope
- 1.2. Market Segmentation
- 1.3. Research Methodology
- 1.4. Definitions and Assumptions
- 2. Executive Summary
- 2.1. Introduction
- 3. Market Dynamics
- 3.1. Introduction
- 3.2. Market Drivers
- 3.2.1. Inclination of Growth toward E-Passport Program; Integration of Biometrics in Smartphones Driving Growth
- 3.3. Market Restrains
- 3.3.1. Fear of Privacy Invasion Challenging Growth; High Initial Cost of Systems Restricting Growth
- 3.4. Market Trends
- 3.4.1. Banking and Financial Industry to be the Fastest Growing Sector
- 4. Market Factor Analysis
- 4.1. Porters Five Forces
- 4.2. Supply/Value Chain
- 4.3. PESTEL analysis
- 4.4. Market Entropy
- 4.5. Patent/Trademark Analysis
- 5. Global Next Generation Biometrics Market Analysis, Insights and Forecast, 2019-2031
- 5.1. Market Analysis, Insights and Forecast - by Type of Solution
- 5.1.1. Face Recognition
- 5.1.2. Fingerprint Recognition
- 5.1.3. Iris Recognition
- 5.1.4. Palm Print Recognition
- 5.1.5. Signature Recognition
- 5.1.6. Other Types of Solutions
- 5.2. Market Analysis, Insights and Forecast - by End-user Vertical
- 5.2.1. Government
- 5.2.2. Defense
- 5.2.3. Travel and Immigration
- 5.2.4. Home Security
- 5.2.5. Banking and Financial Service
- 5.2.6. Healthcare
- 5.2.7. Other End-user Verticals
- 5.3. Market Analysis, Insights and Forecast - by Region
- 5.3.1. North America
- 5.3.2. Europe
- 5.3.3. Asia Pacific
- 5.3.4. Middle East
- 5.3.5. Latin America
- 5.1. Market Analysis, Insights and Forecast - by Type of Solution
- 6. North America Next Generation Biometrics Market Analysis, Insights and Forecast, 2019-2031
- 6.1. Market Analysis, Insights and Forecast - by Type of Solution
- 6.1.1. Face Recognition
- 6.1.2. Fingerprint Recognition
- 6.1.3. Iris Recognition
- 6.1.4. Palm Print Recognition
- 6.1.5. Signature Recognition
- 6.1.6. Other Types of Solutions
- 6.2. Market Analysis, Insights and Forecast - by End-user Vertical
- 6.2.1. Government
- 6.2.2. Defense
- 6.2.3. Travel and Immigration
- 6.2.4. Home Security
- 6.2.5. Banking and Financial Service
- 6.2.6. Healthcare
- 6.2.7. Other End-user Verticals
- 6.1. Market Analysis, Insights and Forecast - by Type of Solution
- 7. Europe Next Generation Biometrics Market Analysis, Insights and Forecast, 2019-2031
- 7.1. Market Analysis, Insights and Forecast - by Type of Solution
- 7.1.1. Face Recognition
- 7.1.2. Fingerprint Recognition
- 7.1.3. Iris Recognition
- 7.1.4. Palm Print Recognition
- 7.1.5. Signature Recognition
- 7.1.6. Other Types of Solutions
- 7.2. Market Analysis, Insights and Forecast - by End-user Vertical
- 7.2.1. Government
- 7.2.2. Defense
- 7.2.3. Travel and Immigration
- 7.2.4. Home Security
- 7.2.5. Banking and Financial Service
- 7.2.6. Healthcare
- 7.2.7. Other End-user Verticals
- 7.1. Market Analysis, Insights and Forecast - by Type of Solution
- 8. Asia Pacific Next Generation Biometrics Market Analysis, Insights and Forecast, 2019-2031
- 8.1. Market Analysis, Insights and Forecast - by Type of Solution
- 8.1.1. Face Recognition
- 8.1.2. Fingerprint Recognition
- 8.1.3. Iris Recognition
- 8.1.4. Palm Print Recognition
- 8.1.5. Signature Recognition
- 8.1.6. Other Types of Solutions
- 8.2. Market Analysis, Insights and Forecast - by End-user Vertical
- 8.2.1. Government
- 8.2.2. Defense
- 8.2.3. Travel and Immigration
- 8.2.4. Home Security
- 8.2.5. Banking and Financial Service
- 8.2.6. Healthcare
- 8.2.7. Other End-user Verticals
- 8.1. Market Analysis, Insights and Forecast - by Type of Solution
- 9. Middle East Next Generation Biometrics Market Analysis, Insights and Forecast, 2019-2031
- 9.1. Market Analysis, Insights and Forecast - by Type of Solution
- 9.1.1. Face Recognition
- 9.1.2. Fingerprint Recognition
- 9.1.3. Iris Recognition
- 9.1.4. Palm Print Recognition
- 9.1.5. Signature Recognition
- 9.1.6. Other Types of Solutions
- 9.2. Market Analysis, Insights and Forecast - by End-user Vertical
- 9.2.1. Government
- 9.2.2. Defense
- 9.2.3. Travel and Immigration
- 9.2.4. Home Security
- 9.2.5. Banking and Financial Service
- 9.2.6. Healthcare
- 9.2.7. Other End-user Verticals
- 9.1. Market Analysis, Insights and Forecast - by Type of Solution
- 10. Latin America Next Generation Biometrics Market Analysis, Insights and Forecast, 2019-2031
- 10.1. Market Analysis, Insights and Forecast - by Type of Solution
- 10.1.1. Face Recognition
- 10.1.2. Fingerprint Recognition
- 10.1.3. Iris Recognition
- 10.1.4. Palm Print Recognition
- 10.1.5. Signature Recognition
- 10.1.6. Other Types of Solutions
- 10.2. Market Analysis, Insights and Forecast - by End-user Vertical
- 10.2.1. Government
- 10.2.2. Defense
- 10.2.3. Travel and Immigration
- 10.2.4. Home Security
- 10.2.5. Banking and Financial Service
- 10.2.6. Healthcare
- 10.2.7. Other End-user Verticals
- 10.1. Market Analysis, Insights and Forecast - by Type of Solution
- 11. North America Next Generation Biometrics Market Analysis, Insights and Forecast, 2019-2031
- 11.1. Market Analysis, Insights and Forecast - By Country/Sub-region
- 11.1.1 United States
- 11.1.2 Canada
- 11.1.3 Mexico
- 12. Europe Next Generation Biometrics Market Analysis, Insights and Forecast, 2019-2031
- 12.1. Market Analysis, Insights and Forecast - By Country/Sub-region
- 12.1.1 Germany
- 12.1.2 United Kingdom
- 12.1.3 France
- 12.1.4 Spain
- 12.1.5 Italy
- 12.1.6 Spain
- 12.1.7 Belgium
- 12.1.8 Netherland
- 12.1.9 Nordics
- 12.1.10 Rest of Europe
- 13. Asia Pacific Next Generation Biometrics Market Analysis, Insights and Forecast, 2019-2031
- 13.1. Market Analysis, Insights and Forecast - By Country/Sub-region
- 13.1.1 China
- 13.1.2 Japan
- 13.1.3 India
- 13.1.4 South Korea
- 13.1.5 Southeast Asia
- 13.1.6 Australia
- 13.1.7 Indonesia
- 13.1.8 Phillipes
- 13.1.9 Singapore
- 13.1.10 Thailandc
- 13.1.11 Rest of Asia Pacific
- 14. South America Next Generation Biometrics Market Analysis, Insights and Forecast, 2019-2031
- 14.1. Market Analysis, Insights and Forecast - By Country/Sub-region
- 14.1.1 Brazil
- 14.1.2 Argentina
- 14.1.3 Peru
- 14.1.4 Chile
- 14.1.5 Colombia
- 14.1.6 Ecuador
- 14.1.7 Venezuela
- 14.1.8 Rest of South America
- 15. North America Next Generation Biometrics Market Analysis, Insights and Forecast, 2019-2031
- 15.1. Market Analysis, Insights and Forecast - By Country/Sub-region
- 15.1.1 United States
- 15.1.2 Canada
- 15.1.3 Mexico
- 16. MEA Next Generation Biometrics Market Analysis, Insights and Forecast, 2019-2031
- 16.1. Market Analysis, Insights and Forecast - By Country/Sub-region
- 16.1.1 United Arab Emirates
- 16.1.2 Saudi Arabia
- 16.1.3 South Africa
- 16.1.4 Rest of Middle East and Africa
- 17. Competitive Analysis
- 17.1. Global Market Share Analysis 2024
- 17.2. Company Profiles
- 17.2.1 RCG Holdings Limited
- 17.2.1.1. Overview
- 17.2.1.2. Products
- 17.2.1.3. SWOT Analysis
- 17.2.1.4. Recent Developments
- 17.2.1.5. Financials (Based on Availability)
- 17.2.2 Suprema Inc
- 17.2.2.1. Overview
- 17.2.2.2. Products
- 17.2.2.3. SWOT Analysis
- 17.2.2.4. Recent Developments
- 17.2.2.5. Financials (Based on Availability)
- 17.2.3 Fujitsu Ltd
- 17.2.3.1. Overview
- 17.2.3.2. Products
- 17.2.3.3. SWOT Analysis
- 17.2.3.4. Recent Developments
- 17.2.3.5. Financials (Based on Availability)
- 17.2.4 Thales Group
- 17.2.4.1. Overview
- 17.2.4.2. Products
- 17.2.4.3. SWOT Analysis
- 17.2.4.4. Recent Developments
- 17.2.4.5. Financials (Based on Availability)
- 17.2.5 Safran SA
- 17.2.5.1. Overview
- 17.2.5.2. Products
- 17.2.5.3. SWOT Analysis
- 17.2.5.4. Recent Developments
- 17.2.5.5. Financials (Based on Availability)
- 17.2.6 Siemens AG
- 17.2.6.1. Overview
- 17.2.6.2. Products
- 17.2.6.3. SWOT Analysis
- 17.2.6.4. Recent Developments
- 17.2.6.5. Financials (Based on Availability)
- 17.2.7 Fingerprint Cards AB
- 17.2.7.1. Overview
- 17.2.7.2. Products
- 17.2.7.3. SWOT Analysis
- 17.2.7.4. Recent Developments
- 17.2.7.5. Financials (Based on Availability)
- 17.2.8 NEC Corporation
- 17.2.8.1. Overview
- 17.2.8.2. Products
- 17.2.8.3. SWOT Analysis
- 17.2.8.4. Recent Developments
- 17.2.8.5. Financials (Based on Availability)
- 17.2.9 Cross Match Technologies
- 17.2.9.1. Overview
- 17.2.9.2. Products
- 17.2.9.3. SWOT Analysis
- 17.2.9.4. Recent Developments
- 17.2.9.5. Financials (Based on Availability)
- 17.2.10 IDEMIA
- 17.2.10.1. Overview
- 17.2.10.2. Products
- 17.2.10.3. SWOT Analysis
- 17.2.10.4. Recent Developments
- 17.2.10.5. Financials (Based on Availability)
- 17.2.1 RCG Holdings Limited
List of Figures
- Figure 1: Global Next Generation Biometrics Market Revenue Breakdown (Million, %) by Region 2024 & 2032
- Figure 2: Global Next Generation Biometrics Market Volume Breakdown (K Unit, %) by Region 2024 & 2032
- Figure 3: North America Next Generation Biometrics Market Revenue (Million), by Country 2024 & 2032
- Figure 4: North America Next Generation Biometrics Market Volume (K Unit), by Country 2024 & 2032
- Figure 5: North America Next Generation Biometrics Market Revenue Share (%), by Country 2024 & 2032
- Figure 6: North America Next Generation Biometrics Market Volume Share (%), by Country 2024 & 2032
- Figure 7: Europe Next Generation Biometrics Market Revenue (Million), by Country 2024 & 2032
- Figure 8: Europe Next Generation Biometrics Market Volume (K Unit), by Country 2024 & 2032
- Figure 9: Europe Next Generation Biometrics Market Revenue Share (%), by Country 2024 & 2032
- Figure 10: Europe Next Generation Biometrics Market Volume Share (%), by Country 2024 & 2032
- Figure 11: Asia Pacific Next Generation Biometrics Market Revenue (Million), by Country 2024 & 2032
- Figure 12: Asia Pacific Next Generation Biometrics Market Volume (K Unit), by Country 2024 & 2032
- Figure 13: Asia Pacific Next Generation Biometrics Market Revenue Share (%), by Country 2024 & 2032
- Figure 14: Asia Pacific Next Generation Biometrics Market Volume Share (%), by Country 2024 & 2032
- Figure 15: South America Next Generation Biometrics Market Revenue (Million), by Country 2024 & 2032
- Figure 16: South America Next Generation Biometrics Market Volume (K Unit), by Country 2024 & 2032
- Figure 17: South America Next Generation Biometrics Market Revenue Share (%), by Country 2024 & 2032
- Figure 18: South America Next Generation Biometrics Market Volume Share (%), by Country 2024 & 2032
- Figure 19: North America Next Generation Biometrics Market Revenue (Million), by Country 2024 & 2032
- Figure 20: North America Next Generation Biometrics Market Volume (K Unit), by Country 2024 & 2032
- Figure 21: North America Next Generation Biometrics Market Revenue Share (%), by Country 2024 & 2032
- Figure 22: North America Next Generation Biometrics Market Volume Share (%), by Country 2024 & 2032
- Figure 23: MEA Next Generation Biometrics Market Revenue (Million), by Country 2024 & 2032
- Figure 24: MEA Next Generation Biometrics Market Volume (K Unit), by Country 2024 & 2032
- Figure 25: MEA Next Generation Biometrics Market Revenue Share (%), by Country 2024 & 2032
- Figure 26: MEA Next Generation Biometrics Market Volume Share (%), by Country 2024 & 2032
- Figure 27: North America Next Generation Biometrics Market Revenue (Million), by Type of Solution 2024 & 2032
- Figure 28: North America Next Generation Biometrics Market Volume (K Unit), by Type of Solution 2024 & 2032
- Figure 29: North America Next Generation Biometrics Market Revenue Share (%), by Type of Solution 2024 & 2032
- Figure 30: North America Next Generation Biometrics Market Volume Share (%), by Type of Solution 2024 & 2032
- Figure 31: North America Next Generation Biometrics Market Revenue (Million), by End-user Vertical 2024 & 2032
- Figure 32: North America Next Generation Biometrics Market Volume (K Unit), by End-user Vertical 2024 & 2032
- Figure 33: North America Next Generation Biometrics Market Revenue Share (%), by End-user Vertical 2024 & 2032
- Figure 34: North America Next Generation Biometrics Market Volume Share (%), by End-user Vertical 2024 & 2032
- Figure 35: North America Next Generation Biometrics Market Revenue (Million), by Country 2024 & 2032
- Figure 36: North America Next Generation Biometrics Market Volume (K Unit), by Country 2024 & 2032
- Figure 37: North America Next Generation Biometrics Market Revenue Share (%), by Country 2024 & 2032
- Figure 38: North America Next Generation Biometrics Market Volume Share (%), by Country 2024 & 2032
- Figure 39: Europe Next Generation Biometrics Market Revenue (Million), by Type of Solution 2024 & 2032
- Figure 40: Europe Next Generation Biometrics Market Volume (K Unit), by Type of Solution 2024 & 2032
- Figure 41: Europe Next Generation Biometrics Market Revenue Share (%), by Type of Solution 2024 & 2032
- Figure 42: Europe Next Generation Biometrics Market Volume Share (%), by Type of Solution 2024 & 2032
- Figure 43: Europe Next Generation Biometrics Market Revenue (Million), by End-user Vertical 2024 & 2032
- Figure 44: Europe Next Generation Biometrics Market Volume (K Unit), by End-user Vertical 2024 & 2032
- Figure 45: Europe Next Generation Biometrics Market Revenue Share (%), by End-user Vertical 2024 & 2032
- Figure 46: Europe Next Generation Biometrics Market Volume Share (%), by End-user Vertical 2024 & 2032
- Figure 47: Europe Next Generation Biometrics Market Revenue (Million), by Country 2024 & 2032
- Figure 48: Europe Next Generation Biometrics Market Volume (K Unit), by Country 2024 & 2032
- Figure 49: Europe Next Generation Biometrics Market Revenue Share (%), by Country 2024 & 2032
- Figure 50: Europe Next Generation Biometrics Market Volume Share (%), by Country 2024 & 2032
- Figure 51: Asia Pacific Next Generation Biometrics Market Revenue (Million), by Type of Solution 2024 & 2032
- Figure 52: Asia Pacific Next Generation Biometrics Market Volume (K Unit), by Type of Solution 2024 & 2032
- Figure 53: Asia Pacific Next Generation Biometrics Market Revenue Share (%), by Type of Solution 2024 & 2032
- Figure 54: Asia Pacific Next Generation Biometrics Market Volume Share (%), by Type of Solution 2024 & 2032
- Figure 55: Asia Pacific Next Generation Biometrics Market Revenue (Million), by End-user Vertical 2024 & 2032
- Figure 56: Asia Pacific Next Generation Biometrics Market Volume (K Unit), by End-user Vertical 2024 & 2032
- Figure 57: Asia Pacific Next Generation Biometrics Market Revenue Share (%), by End-user Vertical 2024 & 2032
- Figure 58: Asia Pacific Next Generation Biometrics Market Volume Share (%), by End-user Vertical 2024 & 2032
- Figure 59: Asia Pacific Next Generation Biometrics Market Revenue (Million), by Country 2024 & 2032
- Figure 60: Asia Pacific Next Generation Biometrics Market Volume (K Unit), by Country 2024 & 2032
- Figure 61: Asia Pacific Next Generation Biometrics Market Revenue Share (%), by Country 2024 & 2032
- Figure 62: Asia Pacific Next Generation Biometrics Market Volume Share (%), by Country 2024 & 2032
- Figure 63: Middle East Next Generation Biometrics Market Revenue (Million), by Type of Solution 2024 & 2032
- Figure 64: Middle East Next Generation Biometrics Market Volume (K Unit), by Type of Solution 2024 & 2032
- Figure 65: Middle East Next Generation Biometrics Market Revenue Share (%), by Type of Solution 2024 & 2032
- Figure 66: Middle East Next Generation Biometrics Market Volume Share (%), by Type of Solution 2024 & 2032
- Figure 67: Middle East Next Generation Biometrics Market Revenue (Million), by End-user Vertical 2024 & 2032
- Figure 68: Middle East Next Generation Biometrics Market Volume (K Unit), by End-user Vertical 2024 & 2032
- Figure 69: Middle East Next Generation Biometrics Market Revenue Share (%), by End-user Vertical 2024 & 2032
- Figure 70: Middle East Next Generation Biometrics Market Volume Share (%), by End-user Vertical 2024 & 2032
- Figure 71: Middle East Next Generation Biometrics Market Revenue (Million), by Country 2024 & 2032
- Figure 72: Middle East Next Generation Biometrics Market Volume (K Unit), by Country 2024 & 2032
- Figure 73: Middle East Next Generation Biometrics Market Revenue Share (%), by Country 2024 & 2032
- Figure 74: Middle East Next Generation Biometrics Market Volume Share (%), by Country 2024 & 2032
- Figure 75: Latin America Next Generation Biometrics Market Revenue (Million), by Type of Solution 2024 & 2032
- Figure 76: Latin America Next Generation Biometrics Market Volume (K Unit), by Type of Solution 2024 & 2032
- Figure 77: Latin America Next Generation Biometrics Market Revenue Share (%), by Type of Solution 2024 & 2032
- Figure 78: Latin America Next Generation Biometrics Market Volume Share (%), by Type of Solution 2024 & 2032
- Figure 79: Latin America Next Generation Biometrics Market Revenue (Million), by End-user Vertical 2024 & 2032
- Figure 80: Latin America Next Generation Biometrics Market Volume (K Unit), by End-user Vertical 2024 & 2032
- Figure 81: Latin America Next Generation Biometrics Market Revenue Share (%), by End-user Vertical 2024 & 2032
- Figure 82: Latin America Next Generation Biometrics Market Volume Share (%), by End-user Vertical 2024 & 2032
- Figure 83: Latin America Next Generation Biometrics Market Revenue (Million), by Country 2024 & 2032
- Figure 84: Latin America Next Generation Biometrics Market Volume (K Unit), by Country 2024 & 2032
- Figure 85: Latin America Next Generation Biometrics Market Revenue Share (%), by Country 2024 & 2032
- Figure 86: Latin America Next Generation Biometrics Market Volume Share (%), by Country 2024 & 2032
List of Tables
- Table 1: Global Next Generation Biometrics Market Revenue Million Forecast, by Region 2019 & 2032
- Table 2: Global Next Generation Biometrics Market Volume K Unit Forecast, by Region 2019 & 2032
- Table 3: Global Next Generation Biometrics Market Revenue Million Forecast, by Type of Solution 2019 & 2032
- Table 4: Global Next Generation Biometrics Market Volume K Unit Forecast, by Type of Solution 2019 & 2032
- Table 5: Global Next Generation Biometrics Market Revenue Million Forecast, by End-user Vertical 2019 & 2032
- Table 6: Global Next Generation Biometrics Market Volume K Unit Forecast, by End-user Vertical 2019 & 2032
- Table 7: Global Next Generation Biometrics Market Revenue Million Forecast, by Region 2019 & 2032
- Table 8: Global Next Generation Biometrics Market Volume K Unit Forecast, by Region 2019 & 2032
- Table 9: Global Next Generation Biometrics Market Revenue Million Forecast, by Country 2019 & 2032
- Table 10: Global Next Generation Biometrics Market Volume K Unit Forecast, by Country 2019 & 2032
- Table 11: United States Next Generation Biometrics Market Revenue (Million) Forecast, by Application 2019 & 2032
- Table 12: United States Next Generation Biometrics Market Volume (K Unit) Forecast, by Application 2019 & 2032
- Table 13: Canada Next Generation Biometrics Market Revenue (Million) Forecast, by Application 2019 & 2032
- Table 14: Canada Next Generation Biometrics Market Volume (K Unit) Forecast, by Application 2019 & 2032
- Table 15: Mexico Next Generation Biometrics Market Revenue (Million) Forecast, by Application 2019 & 2032
- Table 16: Mexico Next Generation Biometrics Market Volume (K Unit) Forecast, by Application 2019 & 2032
- Table 17: Global Next Generation Biometrics Market Revenue Million Forecast, by Country 2019 & 2032
- Table 18: Global Next Generation Biometrics Market Volume K Unit Forecast, by Country 2019 & 2032
- Table 19: Germany Next Generation Biometrics Market Revenue (Million) Forecast, by Application 2019 & 2032
- Table 20: Germany Next Generation Biometrics Market Volume (K Unit) Forecast, by Application 2019 & 2032
- Table 21: United Kingdom Next Generation Biometrics Market Revenue (Million) Forecast, by Application 2019 & 2032
- Table 22: United Kingdom Next Generation Biometrics Market Volume (K Unit) Forecast, by Application 2019 & 2032
- Table 23: France Next Generation Biometrics Market Revenue (Million) Forecast, by Application 2019 & 2032
- Table 24: France Next Generation Biometrics Market Volume (K Unit) Forecast, by Application 2019 & 2032
- Table 25: Spain Next Generation Biometrics Market Revenue (Million) Forecast, by Application 2019 & 2032
- Table 26: Spain Next Generation Biometrics Market Volume (K Unit) Forecast, by Application 2019 & 2032
- Table 27: Italy Next Generation Biometrics Market Revenue (Million) Forecast, by Application 2019 & 2032
- Table 28: Italy Next Generation Biometrics Market Volume (K Unit) Forecast, by Application 2019 & 2032
- Table 29: Spain Next Generation Biometrics Market Revenue (Million) Forecast, by Application 2019 & 2032
- Table 30: Spain Next Generation Biometrics Market Volume (K Unit) Forecast, by Application 2019 & 2032
- Table 31: Belgium Next Generation Biometrics Market Revenue (Million) Forecast, by Application 2019 & 2032
- Table 32: Belgium Next Generation Biometrics Market Volume (K Unit) Forecast, by Application 2019 & 2032
- Table 33: Netherland Next Generation Biometrics Market Revenue (Million) Forecast, by Application 2019 & 2032
- Table 34: Netherland Next Generation Biometrics Market Volume (K Unit) Forecast, by Application 2019 & 2032
- Table 35: Nordics Next Generation Biometrics Market Revenue (Million) Forecast, by Application 2019 & 2032
- Table 36: Nordics Next Generation Biometrics Market Volume (K Unit) Forecast, by Application 2019 & 2032
- Table 37: Rest of Europe Next Generation Biometrics Market Revenue (Million) Forecast, by Application 2019 & 2032
- Table 38: Rest of Europe Next Generation Biometrics Market Volume (K Unit) Forecast, by Application 2019 & 2032
- Table 39: Global Next Generation Biometrics Market Revenue Million Forecast, by Country 2019 & 2032
- Table 40: Global Next Generation Biometrics Market Volume K Unit Forecast, by Country 2019 & 2032
- Table 41: China Next Generation Biometrics Market Revenue (Million) Forecast, by Application 2019 & 2032
- Table 42: China Next Generation Biometrics Market Volume (K Unit) Forecast, by Application 2019 & 2032
- Table 43: Japan Next Generation Biometrics Market Revenue (Million) Forecast, by Application 2019 & 2032
- Table 44: Japan Next Generation Biometrics Market Volume (K Unit) Forecast, by Application 2019 & 2032
- Table 45: India Next Generation Biometrics Market Revenue (Million) Forecast, by Application 2019 & 2032
- Table 46: India Next Generation Biometrics Market Volume (K Unit) Forecast, by Application 2019 & 2032
- Table 47: South Korea Next Generation Biometrics Market Revenue (Million) Forecast, by Application 2019 & 2032
- Table 48: South Korea Next Generation Biometrics Market Volume (K Unit) Forecast, by Application 2019 & 2032
- Table 49: Southeast Asia Next Generation Biometrics Market Revenue (Million) Forecast, by Application 2019 & 2032
- Table 50: Southeast Asia Next Generation Biometrics Market Volume (K Unit) Forecast, by Application 2019 & 2032
- Table 51: Australia Next Generation Biometrics Market Revenue (Million) Forecast, by Application 2019 & 2032
- Table 52: Australia Next Generation Biometrics Market Volume (K Unit) Forecast, by Application 2019 & 2032
- Table 53: Indonesia Next Generation Biometrics Market Revenue (Million) Forecast, by Application 2019 & 2032
- Table 54: Indonesia Next Generation Biometrics Market Volume (K Unit) Forecast, by Application 2019 & 2032
- Table 55: Phillipes Next Generation Biometrics Market Revenue (Million) Forecast, by Application 2019 & 2032
- Table 56: Phillipes Next Generation Biometrics Market Volume (K Unit) Forecast, by Application 2019 & 2032
- Table 57: Singapore Next Generation Biometrics Market Revenue (Million) Forecast, by Application 2019 & 2032
- Table 58: Singapore Next Generation Biometrics Market Volume (K Unit) Forecast, by Application 2019 & 2032
- Table 59: Thailandc Next Generation Biometrics Market Revenue (Million) Forecast, by Application 2019 & 2032
- Table 60: Thailandc Next Generation Biometrics Market Volume (K Unit) Forecast, by Application 2019 & 2032
- Table 61: Rest of Asia Pacific Next Generation Biometrics Market Revenue (Million) Forecast, by Application 2019 & 2032
- Table 62: Rest of Asia Pacific Next Generation Biometrics Market Volume (K Unit) Forecast, by Application 2019 & 2032
- Table 63: Global Next Generation Biometrics Market Revenue Million Forecast, by Country 2019 & 2032
- Table 64: Global Next Generation Biometrics Market Volume K Unit Forecast, by Country 2019 & 2032
- Table 65: Brazil Next Generation Biometrics Market Revenue (Million) Forecast, by Application 2019 & 2032
- Table 66: Brazil Next Generation Biometrics Market Volume (K Unit) Forecast, by Application 2019 & 2032
- Table 67: Argentina Next Generation Biometrics Market Revenue (Million) Forecast, by Application 2019 & 2032
- Table 68: Argentina Next Generation Biometrics Market Volume (K Unit) Forecast, by Application 2019 & 2032
- Table 69: Peru Next Generation Biometrics Market Revenue (Million) Forecast, by Application 2019 & 2032
- Table 70: Peru Next Generation Biometrics Market Volume (K Unit) Forecast, by Application 2019 & 2032
- Table 71: Chile Next Generation Biometrics Market Revenue (Million) Forecast, by Application 2019 & 2032
- Table 72: Chile Next Generation Biometrics Market Volume (K Unit) Forecast, by Application 2019 & 2032
- Table 73: Colombia Next Generation Biometrics Market Revenue (Million) Forecast, by Application 2019 & 2032
- Table 74: Colombia Next Generation Biometrics Market Volume (K Unit) Forecast, by Application 2019 & 2032
- Table 75: Ecuador Next Generation Biometrics Market Revenue (Million) Forecast, by Application 2019 & 2032
- Table 76: Ecuador Next Generation Biometrics Market Volume (K Unit) Forecast, by Application 2019 & 2032
- Table 77: Venezuela Next Generation Biometrics Market Revenue (Million) Forecast, by Application 2019 & 2032
- Table 78: Venezuela Next Generation Biometrics Market Volume (K Unit) Forecast, by Application 2019 & 2032
- Table 79: Rest of South America Next Generation Biometrics Market Revenue (Million) Forecast, by Application 2019 & 2032
- Table 80: Rest of South America Next Generation Biometrics Market Volume (K Unit) Forecast, by Application 2019 & 2032
- Table 81: Global Next Generation Biometrics Market Revenue Million Forecast, by Country 2019 & 2032
- Table 82: Global Next Generation Biometrics Market Volume K Unit Forecast, by Country 2019 & 2032
- Table 83: United States Next Generation Biometrics Market Revenue (Million) Forecast, by Application 2019 & 2032
- Table 84: United States Next Generation Biometrics Market Volume (K Unit) Forecast, by Application 2019 & 2032
- Table 85: Canada Next Generation Biometrics Market Revenue (Million) Forecast, by Application 2019 & 2032
- Table 86: Canada Next Generation Biometrics Market Volume (K Unit) Forecast, by Application 2019 & 2032
- Table 87: Mexico Next Generation Biometrics Market Revenue (Million) Forecast, by Application 2019 & 2032
- Table 88: Mexico Next Generation Biometrics Market Volume (K Unit) Forecast, by Application 2019 & 2032
- Table 89: Global Next Generation Biometrics Market Revenue Million Forecast, by Country 2019 & 2032
- Table 90: Global Next Generation Biometrics Market Volume K Unit Forecast, by Country 2019 & 2032
- Table 91: United Arab Emirates Next Generation Biometrics Market Revenue (Million) Forecast, by Application 2019 & 2032
- Table 92: United Arab Emirates Next Generation Biometrics Market Volume (K Unit) Forecast, by Application 2019 & 2032
- Table 93: Saudi Arabia Next Generation Biometrics Market Revenue (Million) Forecast, by Application 2019 & 2032
- Table 94: Saudi Arabia Next Generation Biometrics Market Volume (K Unit) Forecast, by Application 2019 & 2032
- Table 95: South Africa Next Generation Biometrics Market Revenue (Million) Forecast, by Application 2019 & 2032
- Table 96: South Africa Next Generation Biometrics Market Volume (K Unit) Forecast, by Application 2019 & 2032
- Table 97: Rest of Middle East and Africa Next Generation Biometrics Market Revenue (Million) Forecast, by Application 2019 & 2032
- Table 98: Rest of Middle East and Africa Next Generation Biometrics Market Volume (K Unit) Forecast, by Application 2019 & 2032
- Table 99: Global Next Generation Biometrics Market Revenue Million Forecast, by Type of Solution 2019 & 2032
- Table 100: Global Next Generation Biometrics Market Volume K Unit Forecast, by Type of Solution 2019 & 2032
- Table 101: Global Next Generation Biometrics Market Revenue Million Forecast, by End-user Vertical 2019 & 2032
- Table 102: Global Next Generation Biometrics Market Volume K Unit Forecast, by End-user Vertical 2019 & 2032
- Table 103: Global Next Generation Biometrics Market Revenue Million Forecast, by Country 2019 & 2032
- Table 104: Global Next Generation Biometrics Market Volume K Unit Forecast, by Country 2019 & 2032
- Table 105: Global Next Generation Biometrics Market Revenue Million Forecast, by Type of Solution 2019 & 2032
- Table 106: Global Next Generation Biometrics Market Volume K Unit Forecast, by Type of Solution 2019 & 2032
- Table 107: Global Next Generation Biometrics Market Revenue Million Forecast, by End-user Vertical 2019 & 2032
- Table 108: Global Next Generation Biometrics Market Volume K Unit Forecast, by End-user Vertical 2019 & 2032
- Table 109: Global Next Generation Biometrics Market Revenue Million Forecast, by Country 2019 & 2032
- Table 110: Global Next Generation Biometrics Market Volume K Unit Forecast, by Country 2019 & 2032
- Table 111: Global Next Generation Biometrics Market Revenue Million Forecast, by Type of Solution 2019 & 2032
- Table 112: Global Next Generation Biometrics Market Volume K Unit Forecast, by Type of Solution 2019 & 2032
- Table 113: Global Next Generation Biometrics Market Revenue Million Forecast, by End-user Vertical 2019 & 2032
- Table 114: Global Next Generation Biometrics Market Volume K Unit Forecast, by End-user Vertical 2019 & 2032
- Table 115: Global Next Generation Biometrics Market Revenue Million Forecast, by Country 2019 & 2032
- Table 116: Global Next Generation Biometrics Market Volume K Unit Forecast, by Country 2019 & 2032
- Table 117: Global Next Generation Biometrics Market Revenue Million Forecast, by Type of Solution 2019 & 2032
- Table 118: Global Next Generation Biometrics Market Volume K Unit Forecast, by Type of Solution 2019 & 2032
- Table 119: Global Next Generation Biometrics Market Revenue Million Forecast, by End-user Vertical 2019 & 2032
- Table 120: Global Next Generation Biometrics Market Volume K Unit Forecast, by End-user Vertical 2019 & 2032
- Table 121: Global Next Generation Biometrics Market Revenue Million Forecast, by Country 2019 & 2032
- Table 122: Global Next Generation Biometrics Market Volume K Unit Forecast, by Country 2019 & 2032
- Table 123: Global Next Generation Biometrics Market Revenue Million Forecast, by Type of Solution 2019 & 2032
- Table 124: Global Next Generation Biometrics Market Volume K Unit Forecast, by Type of Solution 2019 & 2032
- Table 125: Global Next Generation Biometrics Market Revenue Million Forecast, by End-user Vertical 2019 & 2032
- Table 126: Global Next Generation Biometrics Market Volume K Unit Forecast, by End-user Vertical 2019 & 2032
- Table 127: Global Next Generation Biometrics Market Revenue Million Forecast, by Country 2019 & 2032
- Table 128: Global Next Generation Biometrics Market Volume K Unit Forecast, by Country 2019 & 2032
Frequently Asked Questions
1. What is the projected Compound Annual Growth Rate (CAGR) of the Next Generation Biometrics Market?
The projected CAGR is approximately 17.01%.
2. Which companies are prominent players in the Next Generation Biometrics Market?
Key companies in the market include RCG Holdings Limited, Suprema Inc, Fujitsu Ltd, Thales Group, Safran SA, Siemens AG, Fingerprint Cards AB, NEC Corporation, Cross Match Technologies, IDEMIA.
3. What are the main segments of the Next Generation Biometrics Market?
The market segments include Type of Solution, End-user Vertical.
4. Can you provide details about the market size?
The market size is estimated to be USD XX Million as of 2022.
5. What are some drivers contributing to market growth?
Inclination of Growth toward E-Passport Program; Integration of Biometrics in Smartphones Driving Growth.
6. What are the notable trends driving market growth?
Banking and Financial Industry to be the Fastest Growing Sector.
7. Are there any restraints impacting market growth?
Fear of Privacy Invasion Challenging Growth; High Initial Cost of Systems Restricting Growth.
8. Can you provide examples of recent developments in the market?
June 2022: Vision-Box presented its latest solution Seamless Kiosk, which is based on a new generation of biometric innovation and is intended to revolutionize the traveling experience.
9. What pricing options are available for accessing the report?
Pricing options include single-user, multi-user, and enterprise licenses priced at USD 4750, USD 5250, and USD 8750 respectively.
10. Is the market size provided in terms of value or volume?
The market size is provided in terms of value, measured in Million and volume, measured in K Unit.
11. Are there any specific market keywords associated with the report?
Yes, the market keyword associated with the report is "Next Generation Biometrics Market," which aids in identifying and referencing the specific market segment covered.
12. How do I determine which pricing option suits my needs best?
The pricing options vary based on user requirements and access needs. Individual users may opt for single-user licenses, while businesses requiring broader access may choose multi-user or enterprise licenses for cost-effective access to the report.
13. Are there any additional resources or data provided in the Next Generation Biometrics Market report?
While the report offers comprehensive insights, it's advisable to review the specific contents or supplementary materials provided to ascertain if additional resources or data are available.
14. How can I stay updated on further developments or reports in the Next Generation Biometrics Market?
To stay informed about further developments, trends, and reports in the Next Generation Biometrics Market, consider subscribing to industry newsletters, following relevant companies and organizations, or regularly checking reputable industry news sources and publications.
Methodology
Step 1 - Identification of Relevant Samples Size from Population Database


Step 2 - Approaches for Defining Global Market Size (Value, Volume* & Price*)

Note*: In applicable scenarios
Step 3 - Data Sources
Primary Research
- Web Analytics
- Survey Reports
- Research Institute
- Latest Research Reports
- Opinion Leaders
Secondary Research
- Annual Reports
- White Paper
- Latest Press Release
- Industry Association
- Paid Database
- Investor Presentations

Step 4 - Data Triangulation
Involves using different sources of information in order to increase the validity of a study
These sources are likely to be stakeholders in a program - participants, other researchers, program staff, other community members, and so on.
Then we put all data in single framework & apply various statistical tools to find out the dynamic on the market.
During the analysis stage, feedback from the stakeholder groups would be compared to determine areas of agreement as well as areas of divergence


