
Key Insights
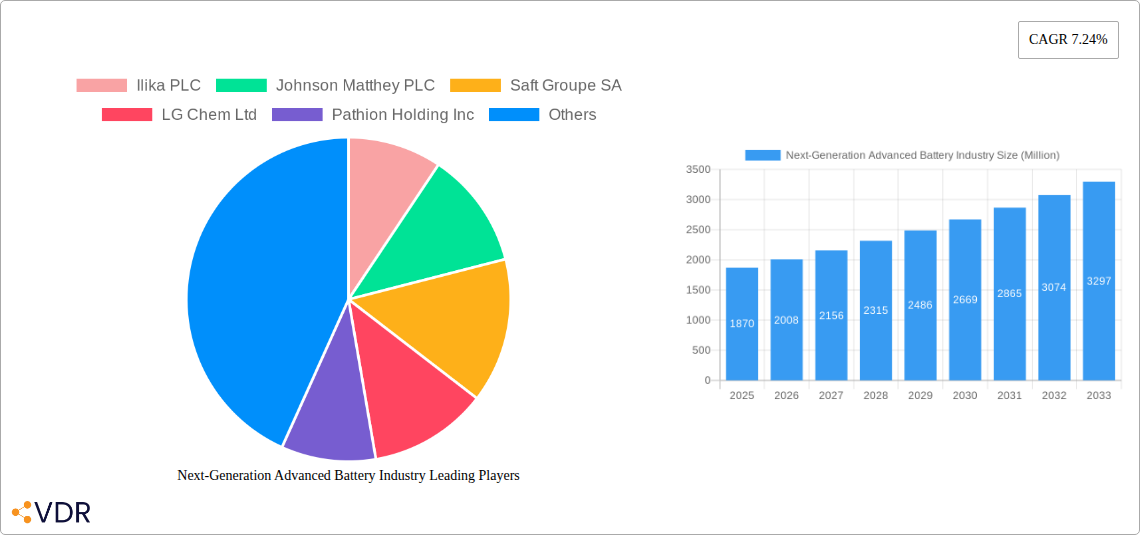
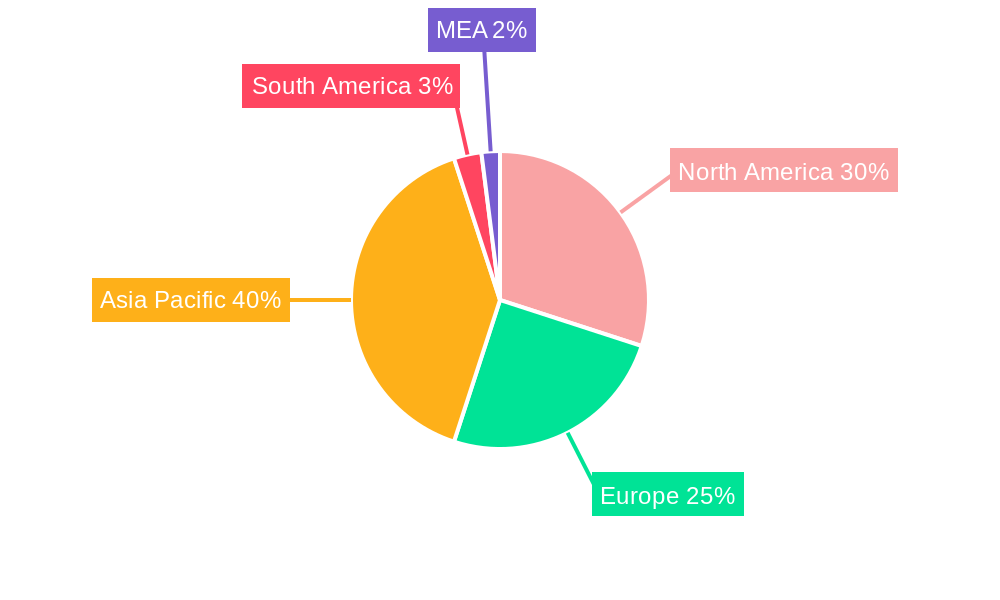
The next-generation advanced battery market, valued at $1.87 billion in 2025, is poised for significant growth, exhibiting a Compound Annual Growth Rate (CAGR) of 7.24% from 2025 to 2033. This expansion is driven by the increasing demand for energy storage solutions across various sectors, including electric vehicles (EVs), consumer electronics, and grid-scale energy storage. Technological advancements in solid-state batteries, magnesium-ion batteries, and other next-generation technologies are further fueling market growth. The shift towards renewable energy sources and the need for efficient energy storage solutions are key drivers. While challenges such as high production costs and technological maturity for some battery types remain, continuous research and development efforts are steadily addressing these limitations. The market is segmented by technology (Solid Electrolyte Battery, Magnesium Ion Battery, Next-generation Flow Battery, Metal-Air Battery, Lithium-Sulfur Battery, Other Technologies) and end-user (Consumer Electronics, Transportation, Industrial, Energy Storage, Other End Users). The transportation sector, particularly electric vehicles, is anticipated to be a major growth engine, contributing significantly to the market's expansion over the forecast period. Geographical analysis reveals strong growth potential in Asia Pacific, driven by robust EV adoption and government initiatives promoting renewable energy. North America and Europe are also expected to witness considerable growth due to increasing investments in renewable energy infrastructure and stringent emission regulations.
The competitive landscape includes established players like LG Chem, CATL, and Saft, alongside emerging companies specializing in innovative battery technologies. Strategic partnerships and mergers and acquisitions are expected to play a key role in shaping the industry landscape. The market is also experiencing a surge in investment in research and development, particularly for solid-state batteries which offer the potential for higher energy density, improved safety, and longer lifespan compared to existing lithium-ion technologies. The continuing growth hinges on overcoming existing limitations in production scale-up and cost reduction for these promising but still emerging battery technologies. Successful navigation of these challenges will solidify the next-generation advanced battery market's position as a crucial element in the global transition to sustainable energy.
Next-Generation Advanced Battery Industry Market Report: 2019-2033
This comprehensive report provides an in-depth analysis of the next-generation advanced battery industry, encompassing market dynamics, growth trends, regional insights, product landscape, and key players. With a study period spanning 2019-2033, a base year of 2025, and a forecast period of 2025-2033, this report is an essential resource for industry professionals, investors, and strategic decision-makers. The report covers key market segments including Solid Electrolyte Battery, Magnesium Ion Battery, Next-generation Flow Battery, Metal-Air Battery, Lithium-Sulfur Battery, and Other Technologies, across end-user applications in Consumer Electronics, Transportation, Industrial, Energy Storage, and Other End Users. The report analyzes the market performance of key companies including Ilika PLC, Johnson Matthey PLC, Saft Groupe SA, LG Chem Ltd, Pathion Holding Inc, Contemporary Amperex Technology Co Ltd, PolyPlus Battery Co Inc, GS Yuasa Corporation, and Sion Power Corporation. The global market size is projected to reach xx Million units by 2033.
Next-Generation Advanced Battery Industry Market Dynamics & Structure
This section analyzes the competitive landscape, technological advancements, regulatory influences, and market consolidation trends within the next-generation advanced battery industry. The market is characterized by a dynamic interplay of established players and emerging innovators, leading to both collaborative partnerships and fierce competition.
- Market Concentration: The market exhibits a moderately concentrated structure, with a few dominant players controlling a significant market share, while numerous smaller companies focus on niche technologies. The market share of the top 5 players is estimated at 60% in 2025.
- Technological Innovation: Significant R&D investment fuels continuous innovation, particularly in solid-state batteries, magnesium-ion batteries, and other next-generation technologies aiming to overcome limitations of current Li-ion batteries. Innovation barriers include high R&D costs, complex manufacturing processes, and material sourcing challenges.
- Regulatory Frameworks: Government regulations and incentives play a crucial role, driving investment and adoption of advanced battery technologies, particularly in the transportation and energy storage sectors. Stringent environmental regulations are accelerating the transition towards greener energy solutions. The US Bipartisan Infrastructure Law exemplifies this trend.
- Competitive Product Substitutes: While Li-ion batteries currently dominate, emerging technologies pose a competitive threat, potentially disrupting the market landscape in the coming years.
- M&A Trends: Mergers and acquisitions are prevalent, with major players actively consolidating their positions and acquiring smaller companies with promising technologies or strategic market access. The number of M&A deals averaged xx per year during the historical period (2019-2024).
- End-User Demographics: The demand for advanced batteries is driven by increasing adoption in electric vehicles, grid-scale energy storage, and portable electronics, reflecting evolving consumer preferences and environmental concerns.
Next-Generation Advanced Battery Industry Growth Trends & Insights
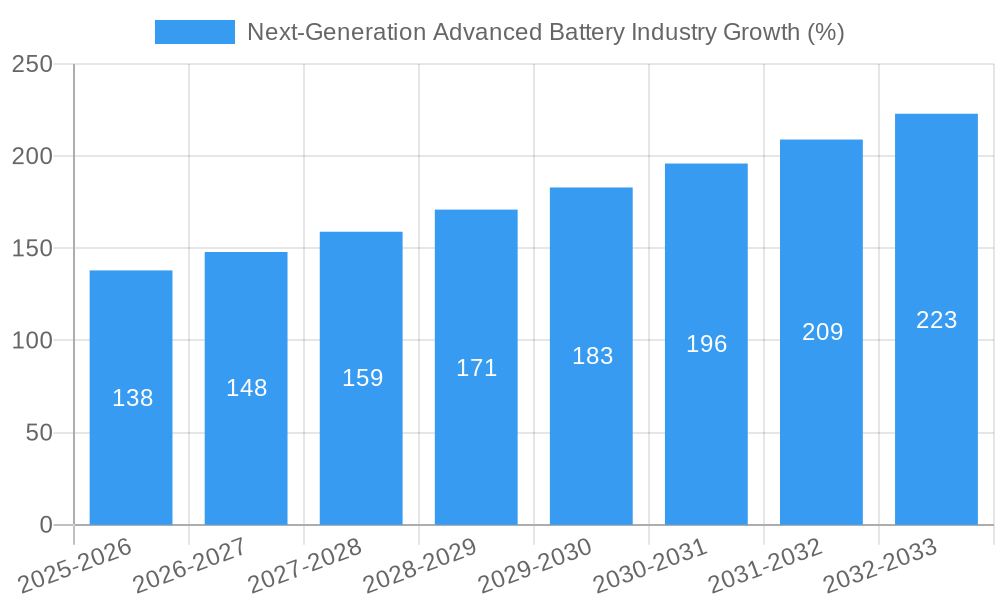
The next-generation advanced battery market is experiencing rapid growth, driven by factors such as increasing demand for electric vehicles, renewable energy integration, and growing concerns about climate change. This section details the market size evolution, adoption rates, technological disruptions, and consumer behavior shifts, leveraging extensive market research and data analysis. The market witnessed a CAGR of xx% during the historical period (2019-2024), and is projected to grow at a CAGR of xx% during the forecast period (2025-2033). Market penetration in the transportation segment is expected to reach xx% by 2033. Technological disruptions, such as advancements in solid-state battery technology, are reshaping the market dynamics and driving substantial growth. Consumer behavior shifts, emphasizing sustainability and environmental responsibility, are further bolstering the adoption of next-generation batteries. The increasing affordability and improved performance of these advanced batteries are key factors impacting market growth.
Dominant Regions, Countries, or Segments in Next-Generation Advanced Battery Industry
This section identifies the leading regions, countries, and segments driving market growth. Asia-Pacific is projected to be the dominant region, driven by strong government support, a large manufacturing base, and increasing demand for electric vehicles. North America and Europe also contribute significantly. The transportation segment dominates the end-user market due to the rapid growth of the electric vehicle industry.
- Key Drivers:
- Strong government policies and incentives for renewable energy and electric vehicles.
- Growing demand for energy storage solutions.
- Significant investments in R&D.
- Favorable economic conditions in certain regions.
- Development of robust charging infrastructure.
- Dominant Segments:
- Technology: Solid-state batteries are expected to experience the highest growth due to their potential for higher energy density and improved safety.
- End User: The transportation sector dominates due to the rise of electric vehicles, followed by energy storage solutions. The consumer electronics sector also contributes significantly to the market.
Next-Generation Advanced Battery Industry Product Landscape
The next-generation advanced battery market offers a diverse range of products with varying chemistries, designs, and performance characteristics. Key innovations focus on enhancing energy density, power output, cycle life, safety, and cost-effectiveness. Solid-state batteries, for example, offer increased energy density and improved safety compared to traditional Li-ion batteries, while magnesium-ion batteries promise faster charging and longer lifespan. These advancements are driving product diversification and enabling wider applications across diverse sectors.
Key Drivers, Barriers & Challenges in Next-Generation Advanced Battery Industry
Key Drivers: The market is driven by the increasing demand for electric vehicles and renewable energy storage, supported by government policies promoting clean energy adoption (e.g., the USD 2.91 billion investment from the US Department of Energy). Technological advancements continually improve battery performance, further fueling market expansion.
Key Challenges and Restraints: High raw material costs, complex manufacturing processes, supply chain vulnerabilities, and safety concerns represent significant barriers to market growth. Regulatory uncertainties and potential standardization challenges also pose significant risks. The estimated impact of supply chain issues on market growth is xx% in 2025.
Emerging Opportunities in Next-Generation Advanced Battery Industry
Emerging opportunities include the expansion of battery applications in grid-scale energy storage, the development of more sustainable and ethically sourced materials, and the exploration of new battery chemistries with superior performance characteristics. The growing demand for portable energy solutions and advancements in micro-battery technology present additional lucrative opportunities.
Growth Accelerators in the Next-Generation Advanced Battery Industry
Several factors are driving long-term growth, including breakthroughs in solid-state battery technology, strategic collaborations between automakers and battery manufacturers (as seen with Mercedes-Benz and ProLogium), and expanding applications in electric aviation and other emerging sectors. Government support for R&D and infrastructure development further catalyzes market expansion.
Key Players Shaping the Next-Generation Advanced Battery Industry Market
- Ilika PLC
- Johnson Matthey PLC
- Saft Groupe SA
- LG Chem Ltd
- Pathion Holding Inc
- Contemporary Amperex Technology Co Ltd
- PolyPlus Battery Co Inc
- GS Yuasa Corporation
- Sion Power Corporation
Notable Milestones in Next-Generation Advanced Battery Industry Sector
- February 2022: The US Department of Energy announced a USD 2.91 billion investment to boost advanced battery production for electric vehicles and stationary energy storage.
- January 2022: Mercedes-Benz and ProLogium signed a technology cooperation agreement for next-generation battery cell development.
In-Depth Next-Generation Advanced Battery Industry Market Outlook
The next-generation advanced battery market presents significant long-term growth potential, driven by ongoing technological advancements, increasing demand for electric vehicles, and the growing need for sustainable energy solutions. Strategic partnerships and government support will continue to drive market expansion, creating lucrative opportunities for both established players and emerging innovators. The market is poised for continued expansion, with substantial growth projected across various segments and geographies.
Next-Generation Advanced Battery Industry Segmentation
-
1. Technology
- 1.1. Solid Electrolyte Battery
- 1.2. Magnesium Ion Battery
- 1.3. Next-generation Flow Battery
- 1.4. Metal-Air Battery
- 1.5. Lithium-Sulfur Battery
- 1.6. Other Technologies
-
2. End User
- 2.1. Consumer Electronics
- 2.2. Transportation
- 2.3. Industrial
- 2.4. Energy Storage
- 2.5. Other End Users
Next-Generation Advanced Battery Industry Segmentation By Geography
- 1. North America
- 2. Asia Pacific
- 3. Europe
- 4. South America
- 5. Middle East and Africa
Next-Generation Advanced Battery Industry REPORT HIGHLIGHTS
| Aspects | Details |
|---|---|
| Study Period | 2019-2033 |
| Base Year | 2024 |
| Estimated Year | 2025 |
| Forecast Period | 2025-2033 |
| Historical Period | 2019-2024 |
| Growth Rate | CAGR of 7.24% from 2019-2033 |
| Segmentation |
|
Table of Contents
- 1. Introduction
- 1.1. Research Scope
- 1.2. Market Segmentation
- 1.3. Research Methodology
- 1.4. Definitions and Assumptions
- 2. Executive Summary
- 2.1. Introduction
- 3. Market Dynamics
- 3.1. Introduction
- 3.2. Market Drivers
- 3.2.1. 4.; Rising Industrialization across the Globe4.; Increasing Utilization of Natural Gas
- 3.3. Market Restrains
- 3.3.1. 4.; High Cost of Installation and Maintenance
- 3.4. Market Trends
- 3.4.1. Transportation Segment Expected to Dominate the Market
- 4. Market Factor Analysis
- 4.1. Porters Five Forces
- 4.2. Supply/Value Chain
- 4.3. PESTEL analysis
- 4.4. Market Entropy
- 4.5. Patent/Trademark Analysis
- 5. Global Next-Generation Advanced Battery Industry Analysis, Insights and Forecast, 2019-2031
- 5.1. Market Analysis, Insights and Forecast - by Technology
- 5.1.1. Solid Electrolyte Battery
- 5.1.2. Magnesium Ion Battery
- 5.1.3. Next-generation Flow Battery
- 5.1.4. Metal-Air Battery
- 5.1.5. Lithium-Sulfur Battery
- 5.1.6. Other Technologies
- 5.2. Market Analysis, Insights and Forecast - by End User
- 5.2.1. Consumer Electronics
- 5.2.2. Transportation
- 5.2.3. Industrial
- 5.2.4. Energy Storage
- 5.2.5. Other End Users
- 5.3. Market Analysis, Insights and Forecast - by Region
- 5.3.1. North America
- 5.3.2. Asia Pacific
- 5.3.3. Europe
- 5.3.4. South America
- 5.3.5. Middle East and Africa
- 5.1. Market Analysis, Insights and Forecast - by Technology
- 6. North America Next-Generation Advanced Battery Industry Analysis, Insights and Forecast, 2019-2031
- 6.1. Market Analysis, Insights and Forecast - by Technology
- 6.1.1. Solid Electrolyte Battery
- 6.1.2. Magnesium Ion Battery
- 6.1.3. Next-generation Flow Battery
- 6.1.4. Metal-Air Battery
- 6.1.5. Lithium-Sulfur Battery
- 6.1.6. Other Technologies
- 6.2. Market Analysis, Insights and Forecast - by End User
- 6.2.1. Consumer Electronics
- 6.2.2. Transportation
- 6.2.3. Industrial
- 6.2.4. Energy Storage
- 6.2.5. Other End Users
- 6.1. Market Analysis, Insights and Forecast - by Technology
- 7. Asia Pacific Next-Generation Advanced Battery Industry Analysis, Insights and Forecast, 2019-2031
- 7.1. Market Analysis, Insights and Forecast - by Technology
- 7.1.1. Solid Electrolyte Battery
- 7.1.2. Magnesium Ion Battery
- 7.1.3. Next-generation Flow Battery
- 7.1.4. Metal-Air Battery
- 7.1.5. Lithium-Sulfur Battery
- 7.1.6. Other Technologies
- 7.2. Market Analysis, Insights and Forecast - by End User
- 7.2.1. Consumer Electronics
- 7.2.2. Transportation
- 7.2.3. Industrial
- 7.2.4. Energy Storage
- 7.2.5. Other End Users
- 7.1. Market Analysis, Insights and Forecast - by Technology
- 8. Europe Next-Generation Advanced Battery Industry Analysis, Insights and Forecast, 2019-2031
- 8.1. Market Analysis, Insights and Forecast - by Technology
- 8.1.1. Solid Electrolyte Battery
- 8.1.2. Magnesium Ion Battery
- 8.1.3. Next-generation Flow Battery
- 8.1.4. Metal-Air Battery
- 8.1.5. Lithium-Sulfur Battery
- 8.1.6. Other Technologies
- 8.2. Market Analysis, Insights and Forecast - by End User
- 8.2.1. Consumer Electronics
- 8.2.2. Transportation
- 8.2.3. Industrial
- 8.2.4. Energy Storage
- 8.2.5. Other End Users
- 8.1. Market Analysis, Insights and Forecast - by Technology
- 9. South America Next-Generation Advanced Battery Industry Analysis, Insights and Forecast, 2019-2031
- 9.1. Market Analysis, Insights and Forecast - by Technology
- 9.1.1. Solid Electrolyte Battery
- 9.1.2. Magnesium Ion Battery
- 9.1.3. Next-generation Flow Battery
- 9.1.4. Metal-Air Battery
- 9.1.5. Lithium-Sulfur Battery
- 9.1.6. Other Technologies
- 9.2. Market Analysis, Insights and Forecast - by End User
- 9.2.1. Consumer Electronics
- 9.2.2. Transportation
- 9.2.3. Industrial
- 9.2.4. Energy Storage
- 9.2.5. Other End Users
- 9.1. Market Analysis, Insights and Forecast - by Technology
- 10. Middle East and Africa Next-Generation Advanced Battery Industry Analysis, Insights and Forecast, 2019-2031
- 10.1. Market Analysis, Insights and Forecast - by Technology
- 10.1.1. Solid Electrolyte Battery
- 10.1.2. Magnesium Ion Battery
- 10.1.3. Next-generation Flow Battery
- 10.1.4. Metal-Air Battery
- 10.1.5. Lithium-Sulfur Battery
- 10.1.6. Other Technologies
- 10.2. Market Analysis, Insights and Forecast - by End User
- 10.2.1. Consumer Electronics
- 10.2.2. Transportation
- 10.2.3. Industrial
- 10.2.4. Energy Storage
- 10.2.5. Other End Users
- 10.1. Market Analysis, Insights and Forecast - by Technology
- 11. North America Next-Generation Advanced Battery Industry Analysis, Insights and Forecast, 2019-2031
- 11.1. Market Analysis, Insights and Forecast - By Country/Sub-region
- 11.1.1 United States
- 11.1.2 Canada
- 11.1.3 Mexico
- 12. Europe Next-Generation Advanced Battery Industry Analysis, Insights and Forecast, 2019-2031
- 12.1. Market Analysis, Insights and Forecast - By Country/Sub-region
- 12.1.1 Germany
- 12.1.2 United Kingdom
- 12.1.3 France
- 12.1.4 Spain
- 12.1.5 Italy
- 12.1.6 Spain
- 12.1.7 Belgium
- 12.1.8 Netherland
- 12.1.9 Nordics
- 12.1.10 Rest of Europe
- 13. Asia Pacific Next-Generation Advanced Battery Industry Analysis, Insights and Forecast, 2019-2031
- 13.1. Market Analysis, Insights and Forecast - By Country/Sub-region
- 13.1.1 China
- 13.1.2 Japan
- 13.1.3 India
- 13.1.4 South Korea
- 13.1.5 Southeast Asia
- 13.1.6 Australia
- 13.1.7 Indonesia
- 13.1.8 Phillipes
- 13.1.9 Singapore
- 13.1.10 Thailandc
- 13.1.11 Rest of Asia Pacific
- 14. South America Next-Generation Advanced Battery Industry Analysis, Insights and Forecast, 2019-2031
- 14.1. Market Analysis, Insights and Forecast - By Country/Sub-region
- 14.1.1 Brazil
- 14.1.2 Argentina
- 14.1.3 Peru
- 14.1.4 Chile
- 14.1.5 Colombia
- 14.1.6 Ecuador
- 14.1.7 Venezuela
- 14.1.8 Rest of South America
- 15. MEA Next-Generation Advanced Battery Industry Analysis, Insights and Forecast, 2019-2031
- 15.1. Market Analysis, Insights and Forecast - By Country/Sub-region
- 15.1.1 United Arab Emirates
- 15.1.2 Saudi Arabia
- 15.1.3 South Africa
- 15.1.4 Rest of Middle East and Africa
- 16. Competitive Analysis
- 16.1. Global Market Share Analysis 2024
- 16.2. Company Profiles
- 16.2.1 Ilika PLC
- 16.2.1.1. Overview
- 16.2.1.2. Products
- 16.2.1.3. SWOT Analysis
- 16.2.1.4. Recent Developments
- 16.2.1.5. Financials (Based on Availability)
- 16.2.2 Johnson Matthey PLC
- 16.2.2.1. Overview
- 16.2.2.2. Products
- 16.2.2.3. SWOT Analysis
- 16.2.2.4. Recent Developments
- 16.2.2.5. Financials (Based on Availability)
- 16.2.3 Saft Groupe SA
- 16.2.3.1. Overview
- 16.2.3.2. Products
- 16.2.3.3. SWOT Analysis
- 16.2.3.4. Recent Developments
- 16.2.3.5. Financials (Based on Availability)
- 16.2.4 LG Chem Ltd
- 16.2.4.1. Overview
- 16.2.4.2. Products
- 16.2.4.3. SWOT Analysis
- 16.2.4.4. Recent Developments
- 16.2.4.5. Financials (Based on Availability)
- 16.2.5 Pathion Holding Inc
- 16.2.5.1. Overview
- 16.2.5.2. Products
- 16.2.5.3. SWOT Analysis
- 16.2.5.4. Recent Developments
- 16.2.5.5. Financials (Based on Availability)
- 16.2.6 Contemporary Amperex Technology Co Ltd
- 16.2.6.1. Overview
- 16.2.6.2. Products
- 16.2.6.3. SWOT Analysis
- 16.2.6.4. Recent Developments
- 16.2.6.5. Financials (Based on Availability)
- 16.2.7 PolyPlus Battery Co Inc
- 16.2.7.1. Overview
- 16.2.7.2. Products
- 16.2.7.3. SWOT Analysis
- 16.2.7.4. Recent Developments
- 16.2.7.5. Financials (Based on Availability)
- 16.2.8 GS Yuasa Corporation
- 16.2.8.1. Overview
- 16.2.8.2. Products
- 16.2.8.3. SWOT Analysis
- 16.2.8.4. Recent Developments
- 16.2.8.5. Financials (Based on Availability)
- 16.2.9 Sion Power Corporation
- 16.2.9.1. Overview
- 16.2.9.2. Products
- 16.2.9.3. SWOT Analysis
- 16.2.9.4. Recent Developments
- 16.2.9.5. Financials (Based on Availability)
- 16.2.1 Ilika PLC
List of Figures
- Figure 1: Global Next-Generation Advanced Battery Industry Revenue Breakdown (Million, %) by Region 2024 & 2032
- Figure 2: Global Next-Generation Advanced Battery Industry Volume Breakdown (K Unit, %) by Region 2024 & 2032
- Figure 3: North America Next-Generation Advanced Battery Industry Revenue (Million), by Country 2024 & 2032
- Figure 4: North America Next-Generation Advanced Battery Industry Volume (K Unit), by Country 2024 & 2032
- Figure 5: North America Next-Generation Advanced Battery Industry Revenue Share (%), by Country 2024 & 2032
- Figure 6: North America Next-Generation Advanced Battery Industry Volume Share (%), by Country 2024 & 2032
- Figure 7: Europe Next-Generation Advanced Battery Industry Revenue (Million), by Country 2024 & 2032
- Figure 8: Europe Next-Generation Advanced Battery Industry Volume (K Unit), by Country 2024 & 2032
- Figure 9: Europe Next-Generation Advanced Battery Industry Revenue Share (%), by Country 2024 & 2032
- Figure 10: Europe Next-Generation Advanced Battery Industry Volume Share (%), by Country 2024 & 2032
- Figure 11: Asia Pacific Next-Generation Advanced Battery Industry Revenue (Million), by Country 2024 & 2032
- Figure 12: Asia Pacific Next-Generation Advanced Battery Industry Volume (K Unit), by Country 2024 & 2032
- Figure 13: Asia Pacific Next-Generation Advanced Battery Industry Revenue Share (%), by Country 2024 & 2032
- Figure 14: Asia Pacific Next-Generation Advanced Battery Industry Volume Share (%), by Country 2024 & 2032
- Figure 15: South America Next-Generation Advanced Battery Industry Revenue (Million), by Country 2024 & 2032
- Figure 16: South America Next-Generation Advanced Battery Industry Volume (K Unit), by Country 2024 & 2032
- Figure 17: South America Next-Generation Advanced Battery Industry Revenue Share (%), by Country 2024 & 2032
- Figure 18: South America Next-Generation Advanced Battery Industry Volume Share (%), by Country 2024 & 2032
- Figure 19: MEA Next-Generation Advanced Battery Industry Revenue (Million), by Country 2024 & 2032
- Figure 20: MEA Next-Generation Advanced Battery Industry Volume (K Unit), by Country 2024 & 2032
- Figure 21: MEA Next-Generation Advanced Battery Industry Revenue Share (%), by Country 2024 & 2032
- Figure 22: MEA Next-Generation Advanced Battery Industry Volume Share (%), by Country 2024 & 2032
- Figure 23: North America Next-Generation Advanced Battery Industry Revenue (Million), by Technology 2024 & 2032
- Figure 24: North America Next-Generation Advanced Battery Industry Volume (K Unit), by Technology 2024 & 2032
- Figure 25: North America Next-Generation Advanced Battery Industry Revenue Share (%), by Technology 2024 & 2032
- Figure 26: North America Next-Generation Advanced Battery Industry Volume Share (%), by Technology 2024 & 2032
- Figure 27: North America Next-Generation Advanced Battery Industry Revenue (Million), by End User 2024 & 2032
- Figure 28: North America Next-Generation Advanced Battery Industry Volume (K Unit), by End User 2024 & 2032
- Figure 29: North America Next-Generation Advanced Battery Industry Revenue Share (%), by End User 2024 & 2032
- Figure 30: North America Next-Generation Advanced Battery Industry Volume Share (%), by End User 2024 & 2032
- Figure 31: North America Next-Generation Advanced Battery Industry Revenue (Million), by Country 2024 & 2032
- Figure 32: North America Next-Generation Advanced Battery Industry Volume (K Unit), by Country 2024 & 2032
- Figure 33: North America Next-Generation Advanced Battery Industry Revenue Share (%), by Country 2024 & 2032
- Figure 34: North America Next-Generation Advanced Battery Industry Volume Share (%), by Country 2024 & 2032
- Figure 35: Asia Pacific Next-Generation Advanced Battery Industry Revenue (Million), by Technology 2024 & 2032
- Figure 36: Asia Pacific Next-Generation Advanced Battery Industry Volume (K Unit), by Technology 2024 & 2032
- Figure 37: Asia Pacific Next-Generation Advanced Battery Industry Revenue Share (%), by Technology 2024 & 2032
- Figure 38: Asia Pacific Next-Generation Advanced Battery Industry Volume Share (%), by Technology 2024 & 2032
- Figure 39: Asia Pacific Next-Generation Advanced Battery Industry Revenue (Million), by End User 2024 & 2032
- Figure 40: Asia Pacific Next-Generation Advanced Battery Industry Volume (K Unit), by End User 2024 & 2032
- Figure 41: Asia Pacific Next-Generation Advanced Battery Industry Revenue Share (%), by End User 2024 & 2032
- Figure 42: Asia Pacific Next-Generation Advanced Battery Industry Volume Share (%), by End User 2024 & 2032
- Figure 43: Asia Pacific Next-Generation Advanced Battery Industry Revenue (Million), by Country 2024 & 2032
- Figure 44: Asia Pacific Next-Generation Advanced Battery Industry Volume (K Unit), by Country 2024 & 2032
- Figure 45: Asia Pacific Next-Generation Advanced Battery Industry Revenue Share (%), by Country 2024 & 2032
- Figure 46: Asia Pacific Next-Generation Advanced Battery Industry Volume Share (%), by Country 2024 & 2032
- Figure 47: Europe Next-Generation Advanced Battery Industry Revenue (Million), by Technology 2024 & 2032
- Figure 48: Europe Next-Generation Advanced Battery Industry Volume (K Unit), by Technology 2024 & 2032
- Figure 49: Europe Next-Generation Advanced Battery Industry Revenue Share (%), by Technology 2024 & 2032
- Figure 50: Europe Next-Generation Advanced Battery Industry Volume Share (%), by Technology 2024 & 2032
- Figure 51: Europe Next-Generation Advanced Battery Industry Revenue (Million), by End User 2024 & 2032
- Figure 52: Europe Next-Generation Advanced Battery Industry Volume (K Unit), by End User 2024 & 2032
- Figure 53: Europe Next-Generation Advanced Battery Industry Revenue Share (%), by End User 2024 & 2032
- Figure 54: Europe Next-Generation Advanced Battery Industry Volume Share (%), by End User 2024 & 2032
- Figure 55: Europe Next-Generation Advanced Battery Industry Revenue (Million), by Country 2024 & 2032
- Figure 56: Europe Next-Generation Advanced Battery Industry Volume (K Unit), by Country 2024 & 2032
- Figure 57: Europe Next-Generation Advanced Battery Industry Revenue Share (%), by Country 2024 & 2032
- Figure 58: Europe Next-Generation Advanced Battery Industry Volume Share (%), by Country 2024 & 2032
- Figure 59: South America Next-Generation Advanced Battery Industry Revenue (Million), by Technology 2024 & 2032
- Figure 60: South America Next-Generation Advanced Battery Industry Volume (K Unit), by Technology 2024 & 2032
- Figure 61: South America Next-Generation Advanced Battery Industry Revenue Share (%), by Technology 2024 & 2032
- Figure 62: South America Next-Generation Advanced Battery Industry Volume Share (%), by Technology 2024 & 2032
- Figure 63: South America Next-Generation Advanced Battery Industry Revenue (Million), by End User 2024 & 2032
- Figure 64: South America Next-Generation Advanced Battery Industry Volume (K Unit), by End User 2024 & 2032
- Figure 65: South America Next-Generation Advanced Battery Industry Revenue Share (%), by End User 2024 & 2032
- Figure 66: South America Next-Generation Advanced Battery Industry Volume Share (%), by End User 2024 & 2032
- Figure 67: South America Next-Generation Advanced Battery Industry Revenue (Million), by Country 2024 & 2032
- Figure 68: South America Next-Generation Advanced Battery Industry Volume (K Unit), by Country 2024 & 2032
- Figure 69: South America Next-Generation Advanced Battery Industry Revenue Share (%), by Country 2024 & 2032
- Figure 70: South America Next-Generation Advanced Battery Industry Volume Share (%), by Country 2024 & 2032
- Figure 71: Middle East and Africa Next-Generation Advanced Battery Industry Revenue (Million), by Technology 2024 & 2032
- Figure 72: Middle East and Africa Next-Generation Advanced Battery Industry Volume (K Unit), by Technology 2024 & 2032
- Figure 73: Middle East and Africa Next-Generation Advanced Battery Industry Revenue Share (%), by Technology 2024 & 2032
- Figure 74: Middle East and Africa Next-Generation Advanced Battery Industry Volume Share (%), by Technology 2024 & 2032
- Figure 75: Middle East and Africa Next-Generation Advanced Battery Industry Revenue (Million), by End User 2024 & 2032
- Figure 76: Middle East and Africa Next-Generation Advanced Battery Industry Volume (K Unit), by End User 2024 & 2032
- Figure 77: Middle East and Africa Next-Generation Advanced Battery Industry Revenue Share (%), by End User 2024 & 2032
- Figure 78: Middle East and Africa Next-Generation Advanced Battery Industry Volume Share (%), by End User 2024 & 2032
- Figure 79: Middle East and Africa Next-Generation Advanced Battery Industry Revenue (Million), by Country 2024 & 2032
- Figure 80: Middle East and Africa Next-Generation Advanced Battery Industry Volume (K Unit), by Country 2024 & 2032
- Figure 81: Middle East and Africa Next-Generation Advanced Battery Industry Revenue Share (%), by Country 2024 & 2032
- Figure 82: Middle East and Africa Next-Generation Advanced Battery Industry Volume Share (%), by Country 2024 & 2032
List of Tables
- Table 1: Global Next-Generation Advanced Battery Industry Revenue Million Forecast, by Region 2019 & 2032
- Table 2: Global Next-Generation Advanced Battery Industry Volume K Unit Forecast, by Region 2019 & 2032
- Table 3: Global Next-Generation Advanced Battery Industry Revenue Million Forecast, by Technology 2019 & 2032
- Table 4: Global Next-Generation Advanced Battery Industry Volume K Unit Forecast, by Technology 2019 & 2032
- Table 5: Global Next-Generation Advanced Battery Industry Revenue Million Forecast, by End User 2019 & 2032
- Table 6: Global Next-Generation Advanced Battery Industry Volume K Unit Forecast, by End User 2019 & 2032
- Table 7: Global Next-Generation Advanced Battery Industry Revenue Million Forecast, by Region 2019 & 2032
- Table 8: Global Next-Generation Advanced Battery Industry Volume K Unit Forecast, by Region 2019 & 2032
- Table 9: Global Next-Generation Advanced Battery Industry Revenue Million Forecast, by Country 2019 & 2032
- Table 10: Global Next-Generation Advanced Battery Industry Volume K Unit Forecast, by Country 2019 & 2032
- Table 11: United States Next-Generation Advanced Battery Industry Revenue (Million) Forecast, by Application 2019 & 2032
- Table 12: United States Next-Generation Advanced Battery Industry Volume (K Unit) Forecast, by Application 2019 & 2032
- Table 13: Canada Next-Generation Advanced Battery Industry Revenue (Million) Forecast, by Application 2019 & 2032
- Table 14: Canada Next-Generation Advanced Battery Industry Volume (K Unit) Forecast, by Application 2019 & 2032
- Table 15: Mexico Next-Generation Advanced Battery Industry Revenue (Million) Forecast, by Application 2019 & 2032
- Table 16: Mexico Next-Generation Advanced Battery Industry Volume (K Unit) Forecast, by Application 2019 & 2032
- Table 17: Global Next-Generation Advanced Battery Industry Revenue Million Forecast, by Country 2019 & 2032
- Table 18: Global Next-Generation Advanced Battery Industry Volume K Unit Forecast, by Country 2019 & 2032
- Table 19: Germany Next-Generation Advanced Battery Industry Revenue (Million) Forecast, by Application 2019 & 2032
- Table 20: Germany Next-Generation Advanced Battery Industry Volume (K Unit) Forecast, by Application 2019 & 2032
- Table 21: United Kingdom Next-Generation Advanced Battery Industry Revenue (Million) Forecast, by Application 2019 & 2032
- Table 22: United Kingdom Next-Generation Advanced Battery Industry Volume (K Unit) Forecast, by Application 2019 & 2032
- Table 23: France Next-Generation Advanced Battery Industry Revenue (Million) Forecast, by Application 2019 & 2032
- Table 24: France Next-Generation Advanced Battery Industry Volume (K Unit) Forecast, by Application 2019 & 2032
- Table 25: Spain Next-Generation Advanced Battery Industry Revenue (Million) Forecast, by Application 2019 & 2032
- Table 26: Spain Next-Generation Advanced Battery Industry Volume (K Unit) Forecast, by Application 2019 & 2032
- Table 27: Italy Next-Generation Advanced Battery Industry Revenue (Million) Forecast, by Application 2019 & 2032
- Table 28: Italy Next-Generation Advanced Battery Industry Volume (K Unit) Forecast, by Application 2019 & 2032
- Table 29: Spain Next-Generation Advanced Battery Industry Revenue (Million) Forecast, by Application 2019 & 2032
- Table 30: Spain Next-Generation Advanced Battery Industry Volume (K Unit) Forecast, by Application 2019 & 2032
- Table 31: Belgium Next-Generation Advanced Battery Industry Revenue (Million) Forecast, by Application 2019 & 2032
- Table 32: Belgium Next-Generation Advanced Battery Industry Volume (K Unit) Forecast, by Application 2019 & 2032
- Table 33: Netherland Next-Generation Advanced Battery Industry Revenue (Million) Forecast, by Application 2019 & 2032
- Table 34: Netherland Next-Generation Advanced Battery Industry Volume (K Unit) Forecast, by Application 2019 & 2032
- Table 35: Nordics Next-Generation Advanced Battery Industry Revenue (Million) Forecast, by Application 2019 & 2032
- Table 36: Nordics Next-Generation Advanced Battery Industry Volume (K Unit) Forecast, by Application 2019 & 2032
- Table 37: Rest of Europe Next-Generation Advanced Battery Industry Revenue (Million) Forecast, by Application 2019 & 2032
- Table 38: Rest of Europe Next-Generation Advanced Battery Industry Volume (K Unit) Forecast, by Application 2019 & 2032
- Table 39: Global Next-Generation Advanced Battery Industry Revenue Million Forecast, by Country 2019 & 2032
- Table 40: Global Next-Generation Advanced Battery Industry Volume K Unit Forecast, by Country 2019 & 2032
- Table 41: China Next-Generation Advanced Battery Industry Revenue (Million) Forecast, by Application 2019 & 2032
- Table 42: China Next-Generation Advanced Battery Industry Volume (K Unit) Forecast, by Application 2019 & 2032
- Table 43: Japan Next-Generation Advanced Battery Industry Revenue (Million) Forecast, by Application 2019 & 2032
- Table 44: Japan Next-Generation Advanced Battery Industry Volume (K Unit) Forecast, by Application 2019 & 2032
- Table 45: India Next-Generation Advanced Battery Industry Revenue (Million) Forecast, by Application 2019 & 2032
- Table 46: India Next-Generation Advanced Battery Industry Volume (K Unit) Forecast, by Application 2019 & 2032
- Table 47: South Korea Next-Generation Advanced Battery Industry Revenue (Million) Forecast, by Application 2019 & 2032
- Table 48: South Korea Next-Generation Advanced Battery Industry Volume (K Unit) Forecast, by Application 2019 & 2032
- Table 49: Southeast Asia Next-Generation Advanced Battery Industry Revenue (Million) Forecast, by Application 2019 & 2032
- Table 50: Southeast Asia Next-Generation Advanced Battery Industry Volume (K Unit) Forecast, by Application 2019 & 2032
- Table 51: Australia Next-Generation Advanced Battery Industry Revenue (Million) Forecast, by Application 2019 & 2032
- Table 52: Australia Next-Generation Advanced Battery Industry Volume (K Unit) Forecast, by Application 2019 & 2032
- Table 53: Indonesia Next-Generation Advanced Battery Industry Revenue (Million) Forecast, by Application 2019 & 2032
- Table 54: Indonesia Next-Generation Advanced Battery Industry Volume (K Unit) Forecast, by Application 2019 & 2032
- Table 55: Phillipes Next-Generation Advanced Battery Industry Revenue (Million) Forecast, by Application 2019 & 2032
- Table 56: Phillipes Next-Generation Advanced Battery Industry Volume (K Unit) Forecast, by Application 2019 & 2032
- Table 57: Singapore Next-Generation Advanced Battery Industry Revenue (Million) Forecast, by Application 2019 & 2032
- Table 58: Singapore Next-Generation Advanced Battery Industry Volume (K Unit) Forecast, by Application 2019 & 2032
- Table 59: Thailandc Next-Generation Advanced Battery Industry Revenue (Million) Forecast, by Application 2019 & 2032
- Table 60: Thailandc Next-Generation Advanced Battery Industry Volume (K Unit) Forecast, by Application 2019 & 2032
- Table 61: Rest of Asia Pacific Next-Generation Advanced Battery Industry Revenue (Million) Forecast, by Application 2019 & 2032
- Table 62: Rest of Asia Pacific Next-Generation Advanced Battery Industry Volume (K Unit) Forecast, by Application 2019 & 2032
- Table 63: Global Next-Generation Advanced Battery Industry Revenue Million Forecast, by Country 2019 & 2032
- Table 64: Global Next-Generation Advanced Battery Industry Volume K Unit Forecast, by Country 2019 & 2032
- Table 65: Brazil Next-Generation Advanced Battery Industry Revenue (Million) Forecast, by Application 2019 & 2032
- Table 66: Brazil Next-Generation Advanced Battery Industry Volume (K Unit) Forecast, by Application 2019 & 2032
- Table 67: Argentina Next-Generation Advanced Battery Industry Revenue (Million) Forecast, by Application 2019 & 2032
- Table 68: Argentina Next-Generation Advanced Battery Industry Volume (K Unit) Forecast, by Application 2019 & 2032
- Table 69: Peru Next-Generation Advanced Battery Industry Revenue (Million) Forecast, by Application 2019 & 2032
- Table 70: Peru Next-Generation Advanced Battery Industry Volume (K Unit) Forecast, by Application 2019 & 2032
- Table 71: Chile Next-Generation Advanced Battery Industry Revenue (Million) Forecast, by Application 2019 & 2032
- Table 72: Chile Next-Generation Advanced Battery Industry Volume (K Unit) Forecast, by Application 2019 & 2032
- Table 73: Colombia Next-Generation Advanced Battery Industry Revenue (Million) Forecast, by Application 2019 & 2032
- Table 74: Colombia Next-Generation Advanced Battery Industry Volume (K Unit) Forecast, by Application 2019 & 2032
- Table 75: Ecuador Next-Generation Advanced Battery Industry Revenue (Million) Forecast, by Application 2019 & 2032
- Table 76: Ecuador Next-Generation Advanced Battery Industry Volume (K Unit) Forecast, by Application 2019 & 2032
- Table 77: Venezuela Next-Generation Advanced Battery Industry Revenue (Million) Forecast, by Application 2019 & 2032
- Table 78: Venezuela Next-Generation Advanced Battery Industry Volume (K Unit) Forecast, by Application 2019 & 2032
- Table 79: Rest of South America Next-Generation Advanced Battery Industry Revenue (Million) Forecast, by Application 2019 & 2032
- Table 80: Rest of South America Next-Generation Advanced Battery Industry Volume (K Unit) Forecast, by Application 2019 & 2032
- Table 81: Global Next-Generation Advanced Battery Industry Revenue Million Forecast, by Country 2019 & 2032
- Table 82: Global Next-Generation Advanced Battery Industry Volume K Unit Forecast, by Country 2019 & 2032
- Table 83: United Arab Emirates Next-Generation Advanced Battery Industry Revenue (Million) Forecast, by Application 2019 & 2032
- Table 84: United Arab Emirates Next-Generation Advanced Battery Industry Volume (K Unit) Forecast, by Application 2019 & 2032
- Table 85: Saudi Arabia Next-Generation Advanced Battery Industry Revenue (Million) Forecast, by Application 2019 & 2032
- Table 86: Saudi Arabia Next-Generation Advanced Battery Industry Volume (K Unit) Forecast, by Application 2019 & 2032
- Table 87: South Africa Next-Generation Advanced Battery Industry Revenue (Million) Forecast, by Application 2019 & 2032
- Table 88: South Africa Next-Generation Advanced Battery Industry Volume (K Unit) Forecast, by Application 2019 & 2032
- Table 89: Rest of Middle East and Africa Next-Generation Advanced Battery Industry Revenue (Million) Forecast, by Application 2019 & 2032
- Table 90: Rest of Middle East and Africa Next-Generation Advanced Battery Industry Volume (K Unit) Forecast, by Application 2019 & 2032
- Table 91: Global Next-Generation Advanced Battery Industry Revenue Million Forecast, by Technology 2019 & 2032
- Table 92: Global Next-Generation Advanced Battery Industry Volume K Unit Forecast, by Technology 2019 & 2032
- Table 93: Global Next-Generation Advanced Battery Industry Revenue Million Forecast, by End User 2019 & 2032
- Table 94: Global Next-Generation Advanced Battery Industry Volume K Unit Forecast, by End User 2019 & 2032
- Table 95: Global Next-Generation Advanced Battery Industry Revenue Million Forecast, by Country 2019 & 2032
- Table 96: Global Next-Generation Advanced Battery Industry Volume K Unit Forecast, by Country 2019 & 2032
- Table 97: Global Next-Generation Advanced Battery Industry Revenue Million Forecast, by Technology 2019 & 2032
- Table 98: Global Next-Generation Advanced Battery Industry Volume K Unit Forecast, by Technology 2019 & 2032
- Table 99: Global Next-Generation Advanced Battery Industry Revenue Million Forecast, by End User 2019 & 2032
- Table 100: Global Next-Generation Advanced Battery Industry Volume K Unit Forecast, by End User 2019 & 2032
- Table 101: Global Next-Generation Advanced Battery Industry Revenue Million Forecast, by Country 2019 & 2032
- Table 102: Global Next-Generation Advanced Battery Industry Volume K Unit Forecast, by Country 2019 & 2032
- Table 103: Global Next-Generation Advanced Battery Industry Revenue Million Forecast, by Technology 2019 & 2032
- Table 104: Global Next-Generation Advanced Battery Industry Volume K Unit Forecast, by Technology 2019 & 2032
- Table 105: Global Next-Generation Advanced Battery Industry Revenue Million Forecast, by End User 2019 & 2032
- Table 106: Global Next-Generation Advanced Battery Industry Volume K Unit Forecast, by End User 2019 & 2032
- Table 107: Global Next-Generation Advanced Battery Industry Revenue Million Forecast, by Country 2019 & 2032
- Table 108: Global Next-Generation Advanced Battery Industry Volume K Unit Forecast, by Country 2019 & 2032
- Table 109: Global Next-Generation Advanced Battery Industry Revenue Million Forecast, by Technology 2019 & 2032
- Table 110: Global Next-Generation Advanced Battery Industry Volume K Unit Forecast, by Technology 2019 & 2032
- Table 111: Global Next-Generation Advanced Battery Industry Revenue Million Forecast, by End User 2019 & 2032
- Table 112: Global Next-Generation Advanced Battery Industry Volume K Unit Forecast, by End User 2019 & 2032
- Table 113: Global Next-Generation Advanced Battery Industry Revenue Million Forecast, by Country 2019 & 2032
- Table 114: Global Next-Generation Advanced Battery Industry Volume K Unit Forecast, by Country 2019 & 2032
- Table 115: Global Next-Generation Advanced Battery Industry Revenue Million Forecast, by Technology 2019 & 2032
- Table 116: Global Next-Generation Advanced Battery Industry Volume K Unit Forecast, by Technology 2019 & 2032
- Table 117: Global Next-Generation Advanced Battery Industry Revenue Million Forecast, by End User 2019 & 2032
- Table 118: Global Next-Generation Advanced Battery Industry Volume K Unit Forecast, by End User 2019 & 2032
- Table 119: Global Next-Generation Advanced Battery Industry Revenue Million Forecast, by Country 2019 & 2032
- Table 120: Global Next-Generation Advanced Battery Industry Volume K Unit Forecast, by Country 2019 & 2032
Frequently Asked Questions
1. What is the projected Compound Annual Growth Rate (CAGR) of the Next-Generation Advanced Battery Industry?
The projected CAGR is approximately 7.24%.
2. Which companies are prominent players in the Next-Generation Advanced Battery Industry?
Key companies in the market include Ilika PLC, Johnson Matthey PLC, Saft Groupe SA, LG Chem Ltd, Pathion Holding Inc, Contemporary Amperex Technology Co Ltd, PolyPlus Battery Co Inc, GS Yuasa Corporation, Sion Power Corporation.
3. What are the main segments of the Next-Generation Advanced Battery Industry?
The market segments include Technology, End User.
4. Can you provide details about the market size?
The market size is estimated to be USD 1.87 Million as of 2022.
5. What are some drivers contributing to market growth?
4.; Rising Industrialization across the Globe4.; Increasing Utilization of Natural Gas.
6. What are the notable trends driving market growth?
Transportation Segment Expected to Dominate the Market.
7. Are there any restraints impacting market growth?
4.; High Cost of Installation and Maintenance.
8. Can you provide examples of recent developments in the market?
In February 2022, the US Department of Energy announced that it would provide USD 2.91 billion to boost the production of advanced batteries used in stationary energy storage systems and electric vehicles, as directed by the Bipartisan Infrastructure Law.
9. What pricing options are available for accessing the report?
Pricing options include single-user, multi-user, and enterprise licenses priced at USD 4750, USD 5250, and USD 8750 respectively.
10. Is the market size provided in terms of value or volume?
The market size is provided in terms of value, measured in Million and volume, measured in K Unit.
11. Are there any specific market keywords associated with the report?
Yes, the market keyword associated with the report is "Next-Generation Advanced Battery Industry," which aids in identifying and referencing the specific market segment covered.
12. How do I determine which pricing option suits my needs best?
The pricing options vary based on user requirements and access needs. Individual users may opt for single-user licenses, while businesses requiring broader access may choose multi-user or enterprise licenses for cost-effective access to the report.
13. Are there any additional resources or data provided in the Next-Generation Advanced Battery Industry report?
While the report offers comprehensive insights, it's advisable to review the specific contents or supplementary materials provided to ascertain if additional resources or data are available.
14. How can I stay updated on further developments or reports in the Next-Generation Advanced Battery Industry?
To stay informed about further developments, trends, and reports in the Next-Generation Advanced Battery Industry, consider subscribing to industry newsletters, following relevant companies and organizations, or regularly checking reputable industry news sources and publications.
Methodology
Step 1 - Identification of Relevant Samples Size from Population Database


Step 2 - Approaches for Defining Global Market Size (Value, Volume* & Price*)

Note*: In applicable scenarios
Step 3 - Data Sources
Primary Research
- Web Analytics
- Survey Reports
- Research Institute
- Latest Research Reports
- Opinion Leaders
Secondary Research
- Annual Reports
- White Paper
- Latest Press Release
- Industry Association
- Paid Database
- Investor Presentations

Step 4 - Data Triangulation
Involves using different sources of information in order to increase the validity of a study
These sources are likely to be stakeholders in a program - participants, other researchers, program staff, other community members, and so on.
Then we put all data in single framework & apply various statistical tools to find out the dynamic on the market.
During the analysis stage, feedback from the stakeholder groups would be compared to determine areas of agreement as well as areas of divergence


