
Key Insights
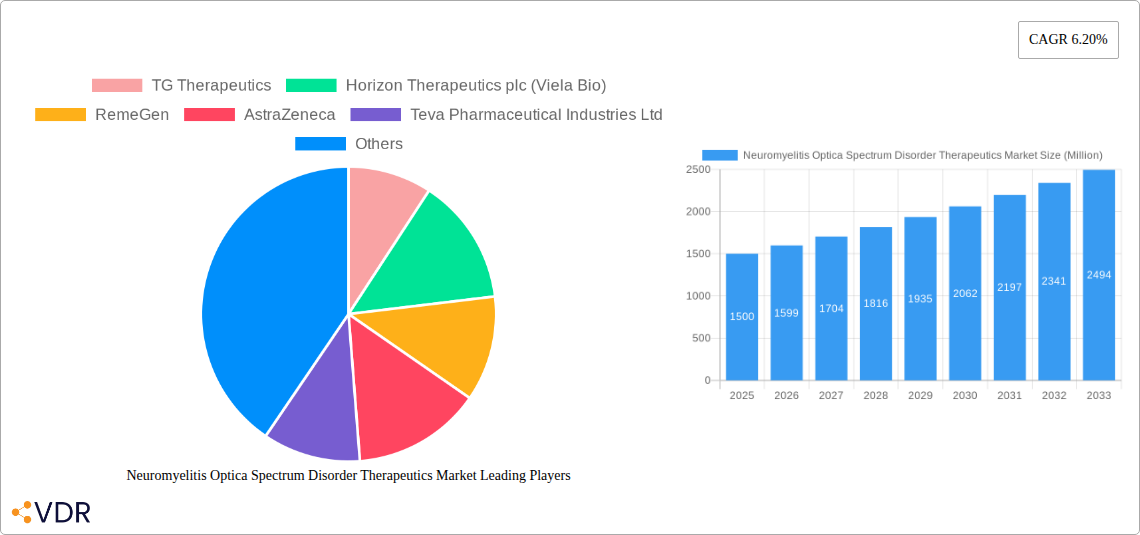
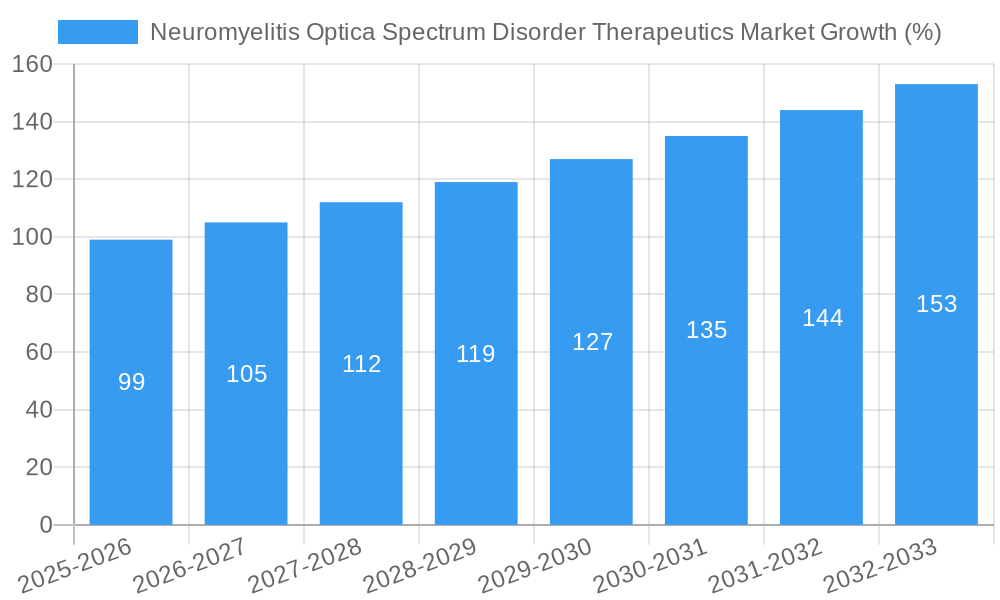
The Neuromyelitis Optica Spectrum Disorder (NMOSD) Therapeutics market is experiencing robust growth, projected to reach a substantial size over the forecast period (2025-2033). A CAGR of 6.20% indicates a steadily expanding market driven by several key factors. Increasing prevalence of NMOSD, coupled with a growing awareness and understanding of the disease, are major contributors to this growth. Furthermore, advancements in therapeutic options, particularly the development and approval of more effective monoclonal antibody drugs and other targeted therapies, are significantly impacting market expansion. The availability of improved diagnostic tools also plays a crucial role, enabling earlier and more accurate diagnosis, leading to timely intervention and improved patient outcomes. While challenges remain, such as high treatment costs and potential side effects associated with certain therapies, the overall market trajectory is positive, fueled by ongoing research and development efforts focused on novel treatment modalities.
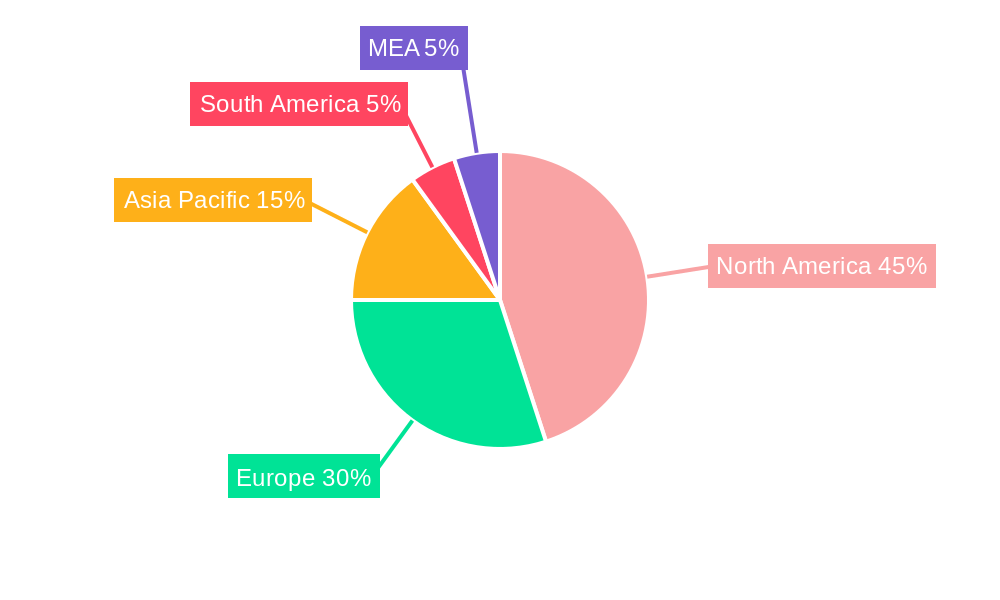
Market segmentation reveals that monoclonal antibody drugs currently dominate the NMOSD therapeutics market, capturing a significant share. However, other treatment modalities like immunosuppressive agents and plasma exchange therapy also hold substantial market value and are expected to witness considerable growth in the coming years. The geographic distribution of the market shows a significant concentration in North America and Europe, driven by established healthcare infrastructure, higher diagnostic rates, and greater access to advanced therapies. However, emerging markets in the Asia-Pacific region are also showing significant promise, exhibiting high growth potential due to increasing awareness, rising healthcare spending, and growing patient populations. Key players in this competitive landscape include TG Therapeutics, Horizon Therapeutics plc (Viela Bio), RemeGen, AstraZeneca, and others, continuously striving to innovate and expand their market presence through research and development, strategic partnerships, and market penetration strategies. The forecast period will witness heightened competition, driven by new drug approvals, improved treatment efficacy, and a continued focus on patient needs.
Neuromyelitis Optica Spectrum Disorder (NMOSD) Therapeutics Market: A Comprehensive Report (2019-2033)
This comprehensive report provides an in-depth analysis of the Neuromyelitis Optica Spectrum Disorder (NMOSD) Therapeutics market, encompassing market dynamics, growth trends, regional insights, product landscapes, and key player strategies. The study period covers 2019-2033, with 2025 as the base and estimated year. The report segments the market by treatment type: Monoclonal Antibody Drugs, Immunosuppressive Agents, Plasma Exchange Therapy, and Other Treatments, offering a granular understanding of this rapidly evolving therapeutic area within the broader neurological disorders market. The market size in 2025 is estimated at $XX Million and is projected to reach $XX Million by 2033, exhibiting a CAGR of XX%.
Neuromyelitis Optica Spectrum Disorder Therapeutics Market Dynamics & Structure
This section analyzes the market's competitive landscape, including market concentration, technological innovations, regulatory frameworks, and competitive substitutes. It also explores end-user demographics and merger & acquisition (M&A) activity within the NMOSD therapeutics sector.
- Market Concentration: The NMOSD therapeutics market is characterized by [Describe market concentration – e.g., moderately concentrated with a few dominant players]. The leading companies hold approximately XX% of the market share collectively.
- Technological Innovation: Key drivers include advancements in [Mention specific technologies - e.g., monoclonal antibody development, targeted therapies]. However, challenges exist in [Mention challenges – e.g., overcoming the blood-brain barrier, achieving personalized medicine].
- Regulatory Frameworks: Regulatory approvals and reimbursement policies significantly influence market growth. [Describe regulatory landscape – e.g., stringent approval processes can delay market entry, while favorable reimbursement policies can accelerate adoption].
- Competitive Product Substitutes: Existing treatments and emerging therapies pose competitive challenges. [Describe competitive landscape – e.g., alternative treatments may offer similar efficacy with lower cost].
- End-User Demographics: The target patient population primarily consists of [Describe patient demographics – e.g., individuals diagnosed with NMOSD, specific age groups, geographic distribution].
- M&A Trends: The NMOSD therapeutics market has witnessed [Describe M&A activity – e.g., a moderate level of M&A activity, with [Number] deals recorded during the historical period (2019-2024). This reflects a strategic effort by larger pharmaceutical companies to expand their portfolios and gain access to innovative technologies].
Neuromyelitis Optica Spectrum Disorder Therapeutics Market Growth Trends & Insights
This section provides a detailed analysis of market size evolution, adoption rates, technological disruptions, and shifts in consumer behavior using [mention data source or methodology]. It leverages comprehensive market data to provide insights into the market's trajectory and future potential. The analysis covers historical data (2019-2024), the base year (2025), and forecasts for the future (2025-2033). [Detailed 600-word analysis of market size evolution, adoption rates, technological disruptions, and consumer behavior shifts with specific metrics (e.g., CAGR, market penetration) would be included here.]
Dominant Regions, Countries, or Segments in Neuromyelitis Optica Spectrum Disorder Therapeutics Market
This section identifies the leading region, country, or segment driving market growth. The analysis focuses on market share and growth potential for each segment (Monoclonal Antibody Drugs, Immunosuppressive Agents, Plasma Exchange Therapy, and Other Treatments) and highlights key drivers.
- North America: [Analyze market dominance factors for North America: high healthcare expenditure, advanced healthcare infrastructure, early adoption of new therapies, robust regulatory frameworks].
- Europe: [Analyze market dominance factors for Europe: increasing prevalence of NMOSD, expanding healthcare expenditure, government initiatives supporting innovative therapies].
- Asia Pacific: [Analyze market dominance factors for Asia Pacific: rising healthcare awareness, increasing disposable incomes, growing demand for advanced therapies, government healthcare initiatives]. [Detailed 600-word analysis of the dominant regions and segments with bullet points highlighting key drivers and paragraphs analyzing dominance factors, including market share and growth potential, would be included here.]
Neuromyelitis Optica Spectrum Disorder Therapeutics Market Product Landscape
This section details product innovations, applications, and performance metrics. [100-150 word paragraph detailing product innovations, applications, performance metrics, unique selling propositions, and technological advancements would be included here.]
Key Drivers, Barriers & Challenges in Neuromyelitis Optica Spectrum Disorder Therapeutics Market
This section outlines the primary forces driving market growth and the key challenges and restraints.
Key Drivers: [150-word paragraph or bullet points outlining technological, economic, and policy-driven factors propelling market growth with specific examples].
Key Challenges and Restraints: [150-word paragraph or list addressing supply chain issues, regulatory hurdles, and competitive pressures with quantifiable impacts].
Emerging Opportunities in Neuromyelitis Optica Spectrum Disorder Therapeutics Market
This section highlights emerging trends and opportunities in the NMOSD therapeutics market. [150-word paragraph or list focusing on untapped markets, innovative applications, or evolving consumer preferences].
Growth Accelerators in the Neuromyelitis Optica Spectrum Disorder Therapeutics Market Industry
This section discusses catalysts driving long-term growth. [150-word paragraph emphasizing technological breakthroughs, strategic partnerships, or market expansion strategies].
Key Players Shaping the Neuromyelitis Optica Spectrum Disorder Therapeutics Market Market
- TG Therapeutics
- Horizon Therapeutics plc (Viela Bio)
- RemeGen
- AstraZeneca
- Teva Pharmaceutical Industries Ltd
- Harbour BioMed
- Opexa Therapeutics
- Mitsubishi Tanabe Pharma
- Hoffmann-La Roche Ltd
- Horizon Therapeutics plc
Notable Milestones in Neuromyelitis Optica Spectrum Disorder Therapeutics Market Sector
[List of notable milestones with year/month, emphasizing their impact on market dynamics (e.g., product launches, mergers) would be included here].
In-Depth Neuromyelitis Optica Spectrum Disorder Therapeutics Market Market Outlook
This section summarizes growth accelerators and focuses on future market potential and strategic opportunities. [150-word paragraph summarizing growth accelerators, focusing on future market potential and strategic opportunities].
Neuromyelitis Optica Spectrum Disorder Therapeutics Market Segmentation
-
1. Treatment
- 1.1. Monoclonal Antibody Drugs
- 1.2. Immunosuppressive Agents
- 1.3. Plasma Exchange Therapy
- 1.4. Other Treatments
Neuromyelitis Optica Spectrum Disorder Therapeutics Market Segmentation By Geography
-
1. North America
- 1.1. United States
- 1.2. Canada
- 1.3. Mexico
-
2. Europe
- 2.1. Germany
- 2.2. United Kingdom
- 2.3. France
- 2.4. Italy
- 2.5. Spain
- 2.6. Rest of Europe
-
3. Asia Pacific
- 3.1. China
- 3.2. Japan
- 3.3. India
- 3.4. Australia
- 3.5. South Korea
- 3.6. Rest of Asia Pacific
- 4. Rest of the World
Neuromyelitis Optica Spectrum Disorder Therapeutics Market REPORT HIGHLIGHTS
| Aspects | Details |
|---|---|
| Study Period | 2019-2033 |
| Base Year | 2024 |
| Estimated Year | 2025 |
| Forecast Period | 2025-2033 |
| Historical Period | 2019-2024 |
| Growth Rate | CAGR of 6.20% from 2019-2033 |
| Segmentation |
|
Table of Contents
- 1. Introduction
- 1.1. Research Scope
- 1.2. Market Segmentation
- 1.3. Research Methodology
- 1.4. Definitions and Assumptions
- 2. Executive Summary
- 2.1. Introduction
- 3. Market Dynamics
- 3.1. Introduction
- 3.2. Market Drivers
- 3.2.1 Increasing Incidence of Neuromyelitis Optica Spectrum Disorder; Increasing Research and Development Activities
- 3.2.2 Product Approvals and Rising Demand for Better Treatment Options
- 3.3. Market Restrains
- 3.3.1. High Cost of Therapy for Neuromyelitis Optica Spectrum Disorder
- 3.4. Market Trends
- 3.4.1. Monoclonal Antibody Drugs Segment Expects to Register a High CAGR in the Forecast Period
- 4. Market Factor Analysis
- 4.1. Porters Five Forces
- 4.2. Supply/Value Chain
- 4.3. PESTEL analysis
- 4.4. Market Entropy
- 4.5. Patent/Trademark Analysis
- 5. Global Neuromyelitis Optica Spectrum Disorder Therapeutics Market Analysis, Insights and Forecast, 2019-2031
- 5.1. Market Analysis, Insights and Forecast - by Treatment
- 5.1.1. Monoclonal Antibody Drugs
- 5.1.2. Immunosuppressive Agents
- 5.1.3. Plasma Exchange Therapy
- 5.1.4. Other Treatments
- 5.2. Market Analysis, Insights and Forecast - by Region
- 5.2.1. North America
- 5.2.2. Europe
- 5.2.3. Asia Pacific
- 5.2.4. Rest of the World
- 5.1. Market Analysis, Insights and Forecast - by Treatment
- 6. North America Neuromyelitis Optica Spectrum Disorder Therapeutics Market Analysis, Insights and Forecast, 2019-2031
- 6.1. Market Analysis, Insights and Forecast - by Treatment
- 6.1.1. Monoclonal Antibody Drugs
- 6.1.2. Immunosuppressive Agents
- 6.1.3. Plasma Exchange Therapy
- 6.1.4. Other Treatments
- 6.1. Market Analysis, Insights and Forecast - by Treatment
- 7. Europe Neuromyelitis Optica Spectrum Disorder Therapeutics Market Analysis, Insights and Forecast, 2019-2031
- 7.1. Market Analysis, Insights and Forecast - by Treatment
- 7.1.1. Monoclonal Antibody Drugs
- 7.1.2. Immunosuppressive Agents
- 7.1.3. Plasma Exchange Therapy
- 7.1.4. Other Treatments
- 7.1. Market Analysis, Insights and Forecast - by Treatment
- 8. Asia Pacific Neuromyelitis Optica Spectrum Disorder Therapeutics Market Analysis, Insights and Forecast, 2019-2031
- 8.1. Market Analysis, Insights and Forecast - by Treatment
- 8.1.1. Monoclonal Antibody Drugs
- 8.1.2. Immunosuppressive Agents
- 8.1.3. Plasma Exchange Therapy
- 8.1.4. Other Treatments
- 8.1. Market Analysis, Insights and Forecast - by Treatment
- 9. Rest of the World Neuromyelitis Optica Spectrum Disorder Therapeutics Market Analysis, Insights and Forecast, 2019-2031
- 9.1. Market Analysis, Insights and Forecast - by Treatment
- 9.1.1. Monoclonal Antibody Drugs
- 9.1.2. Immunosuppressive Agents
- 9.1.3. Plasma Exchange Therapy
- 9.1.4. Other Treatments
- 9.1. Market Analysis, Insights and Forecast - by Treatment
- 10. North America Neuromyelitis Optica Spectrum Disorder Therapeutics Market Analysis, Insights and Forecast, 2019-2031
- 10.1. Market Analysis, Insights and Forecast - By Country/Sub-region
- 10.1.1 United States
- 10.1.2 Canada
- 10.1.3 Mexico
- 11. Europe Neuromyelitis Optica Spectrum Disorder Therapeutics Market Analysis, Insights and Forecast, 2019-2031
- 11.1. Market Analysis, Insights and Forecast - By Country/Sub-region
- 11.1.1 Germany
- 11.1.2 United Kingdom
- 11.1.3 France
- 11.1.4 Spain
- 11.1.5 Italy
- 11.1.6 Spain
- 11.1.7 Belgium
- 11.1.8 Netherland
- 11.1.9 Nordics
- 11.1.10 Rest of Europe
- 12. Asia Pacific Neuromyelitis Optica Spectrum Disorder Therapeutics Market Analysis, Insights and Forecast, 2019-2031
- 12.1. Market Analysis, Insights and Forecast - By Country/Sub-region
- 12.1.1 China
- 12.1.2 Japan
- 12.1.3 India
- 12.1.4 South Korea
- 12.1.5 Southeast Asia
- 12.1.6 Australia
- 12.1.7 Indonesia
- 12.1.8 Phillipes
- 12.1.9 Singapore
- 12.1.10 Thailandc
- 12.1.11 Rest of Asia Pacific
- 13. South America Neuromyelitis Optica Spectrum Disorder Therapeutics Market Analysis, Insights and Forecast, 2019-2031
- 13.1. Market Analysis, Insights and Forecast - By Country/Sub-region
- 13.1.1 Brazil
- 13.1.2 Argentina
- 13.1.3 Peru
- 13.1.4 Chile
- 13.1.5 Colombia
- 13.1.6 Ecuador
- 13.1.7 Venezuela
- 13.1.8 Rest of South America
- 14. North America Neuromyelitis Optica Spectrum Disorder Therapeutics Market Analysis, Insights and Forecast, 2019-2031
- 14.1. Market Analysis, Insights and Forecast - By Country/Sub-region
- 14.1.1 United States
- 14.1.2 Canada
- 14.1.3 Mexico
- 15. MEA Neuromyelitis Optica Spectrum Disorder Therapeutics Market Analysis, Insights and Forecast, 2019-2031
- 15.1. Market Analysis, Insights and Forecast - By Country/Sub-region
- 15.1.1 United Arab Emirates
- 15.1.2 Saudi Arabia
- 15.1.3 South Africa
- 15.1.4 Rest of Middle East and Africa
- 16. Competitive Analysis
- 16.1. Global Market Share Analysis 2024
- 16.2. Company Profiles
- 16.2.1 TG Therapeutics
- 16.2.1.1. Overview
- 16.2.1.2. Products
- 16.2.1.3. SWOT Analysis
- 16.2.1.4. Recent Developments
- 16.2.1.5. Financials (Based on Availability)
- 16.2.2 Horizon Therapeutics plc (Viela Bio)
- 16.2.2.1. Overview
- 16.2.2.2. Products
- 16.2.2.3. SWOT Analysis
- 16.2.2.4. Recent Developments
- 16.2.2.5. Financials (Based on Availability)
- 16.2.3 RemeGen
- 16.2.3.1. Overview
- 16.2.3.2. Products
- 16.2.3.3. SWOT Analysis
- 16.2.3.4. Recent Developments
- 16.2.3.5. Financials (Based on Availability)
- 16.2.4 AstraZeneca
- 16.2.4.1. Overview
- 16.2.4.2. Products
- 16.2.4.3. SWOT Analysis
- 16.2.4.4. Recent Developments
- 16.2.4.5. Financials (Based on Availability)
- 16.2.5 Teva Pharmaceutical Industries Ltd
- 16.2.5.1. Overview
- 16.2.5.2. Products
- 16.2.5.3. SWOT Analysis
- 16.2.5.4. Recent Developments
- 16.2.5.5. Financials (Based on Availability)
- 16.2.6 Harbour BioMed
- 16.2.6.1. Overview
- 16.2.6.2. Products
- 16.2.6.3. SWOT Analysis
- 16.2.6.4. Recent Developments
- 16.2.6.5. Financials (Based on Availability)
- 16.2.7 Opexa Therapeutics
- 16.2.7.1. Overview
- 16.2.7.2. Products
- 16.2.7.3. SWOT Analysis
- 16.2.7.4. Recent Developments
- 16.2.7.5. Financials (Based on Availability)
- 16.2.8 Mitsubishi Tanabe Pharma
- 16.2.8.1. Overview
- 16.2.8.2. Products
- 16.2.8.3. SWOT Analysis
- 16.2.8.4. Recent Developments
- 16.2.8.5. Financials (Based on Availability)
- 16.2.9 Hoffmann-La Roche Ltd
- 16.2.9.1. Overview
- 16.2.9.2. Products
- 16.2.9.3. SWOT Analysis
- 16.2.9.4. Recent Developments
- 16.2.9.5. Financials (Based on Availability)
- 16.2.10 Horizon Therapeutics plc
- 16.2.10.1. Overview
- 16.2.10.2. Products
- 16.2.10.3. SWOT Analysis
- 16.2.10.4. Recent Developments
- 16.2.10.5. Financials (Based on Availability)
- 16.2.1 TG Therapeutics
List of Figures
- Figure 1: Global Neuromyelitis Optica Spectrum Disorder Therapeutics Market Revenue Breakdown (Million, %) by Region 2024 & 2032
- Figure 2: Global Neuromyelitis Optica Spectrum Disorder Therapeutics Market Volume Breakdown (K Unit, %) by Region 2024 & 2032
- Figure 3: North America Neuromyelitis Optica Spectrum Disorder Therapeutics Market Revenue (Million), by Country 2024 & 2032
- Figure 4: North America Neuromyelitis Optica Spectrum Disorder Therapeutics Market Volume (K Unit), by Country 2024 & 2032
- Figure 5: North America Neuromyelitis Optica Spectrum Disorder Therapeutics Market Revenue Share (%), by Country 2024 & 2032
- Figure 6: North America Neuromyelitis Optica Spectrum Disorder Therapeutics Market Volume Share (%), by Country 2024 & 2032
- Figure 7: Europe Neuromyelitis Optica Spectrum Disorder Therapeutics Market Revenue (Million), by Country 2024 & 2032
- Figure 8: Europe Neuromyelitis Optica Spectrum Disorder Therapeutics Market Volume (K Unit), by Country 2024 & 2032
- Figure 9: Europe Neuromyelitis Optica Spectrum Disorder Therapeutics Market Revenue Share (%), by Country 2024 & 2032
- Figure 10: Europe Neuromyelitis Optica Spectrum Disorder Therapeutics Market Volume Share (%), by Country 2024 & 2032
- Figure 11: Asia Pacific Neuromyelitis Optica Spectrum Disorder Therapeutics Market Revenue (Million), by Country 2024 & 2032
- Figure 12: Asia Pacific Neuromyelitis Optica Spectrum Disorder Therapeutics Market Volume (K Unit), by Country 2024 & 2032
- Figure 13: Asia Pacific Neuromyelitis Optica Spectrum Disorder Therapeutics Market Revenue Share (%), by Country 2024 & 2032
- Figure 14: Asia Pacific Neuromyelitis Optica Spectrum Disorder Therapeutics Market Volume Share (%), by Country 2024 & 2032
- Figure 15: South America Neuromyelitis Optica Spectrum Disorder Therapeutics Market Revenue (Million), by Country 2024 & 2032
- Figure 16: South America Neuromyelitis Optica Spectrum Disorder Therapeutics Market Volume (K Unit), by Country 2024 & 2032
- Figure 17: South America Neuromyelitis Optica Spectrum Disorder Therapeutics Market Revenue Share (%), by Country 2024 & 2032
- Figure 18: South America Neuromyelitis Optica Spectrum Disorder Therapeutics Market Volume Share (%), by Country 2024 & 2032
- Figure 19: North America Neuromyelitis Optica Spectrum Disorder Therapeutics Market Revenue (Million), by Country 2024 & 2032
- Figure 20: North America Neuromyelitis Optica Spectrum Disorder Therapeutics Market Volume (K Unit), by Country 2024 & 2032
- Figure 21: North America Neuromyelitis Optica Spectrum Disorder Therapeutics Market Revenue Share (%), by Country 2024 & 2032
- Figure 22: North America Neuromyelitis Optica Spectrum Disorder Therapeutics Market Volume Share (%), by Country 2024 & 2032
- Figure 23: MEA Neuromyelitis Optica Spectrum Disorder Therapeutics Market Revenue (Million), by Country 2024 & 2032
- Figure 24: MEA Neuromyelitis Optica Spectrum Disorder Therapeutics Market Volume (K Unit), by Country 2024 & 2032
- Figure 25: MEA Neuromyelitis Optica Spectrum Disorder Therapeutics Market Revenue Share (%), by Country 2024 & 2032
- Figure 26: MEA Neuromyelitis Optica Spectrum Disorder Therapeutics Market Volume Share (%), by Country 2024 & 2032
- Figure 27: North America Neuromyelitis Optica Spectrum Disorder Therapeutics Market Revenue (Million), by Treatment 2024 & 2032
- Figure 28: North America Neuromyelitis Optica Spectrum Disorder Therapeutics Market Volume (K Unit), by Treatment 2024 & 2032
- Figure 29: North America Neuromyelitis Optica Spectrum Disorder Therapeutics Market Revenue Share (%), by Treatment 2024 & 2032
- Figure 30: North America Neuromyelitis Optica Spectrum Disorder Therapeutics Market Volume Share (%), by Treatment 2024 & 2032
- Figure 31: North America Neuromyelitis Optica Spectrum Disorder Therapeutics Market Revenue (Million), by Country 2024 & 2032
- Figure 32: North America Neuromyelitis Optica Spectrum Disorder Therapeutics Market Volume (K Unit), by Country 2024 & 2032
- Figure 33: North America Neuromyelitis Optica Spectrum Disorder Therapeutics Market Revenue Share (%), by Country 2024 & 2032
- Figure 34: North America Neuromyelitis Optica Spectrum Disorder Therapeutics Market Volume Share (%), by Country 2024 & 2032
- Figure 35: Europe Neuromyelitis Optica Spectrum Disorder Therapeutics Market Revenue (Million), by Treatment 2024 & 2032
- Figure 36: Europe Neuromyelitis Optica Spectrum Disorder Therapeutics Market Volume (K Unit), by Treatment 2024 & 2032
- Figure 37: Europe Neuromyelitis Optica Spectrum Disorder Therapeutics Market Revenue Share (%), by Treatment 2024 & 2032
- Figure 38: Europe Neuromyelitis Optica Spectrum Disorder Therapeutics Market Volume Share (%), by Treatment 2024 & 2032
- Figure 39: Europe Neuromyelitis Optica Spectrum Disorder Therapeutics Market Revenue (Million), by Country 2024 & 2032
- Figure 40: Europe Neuromyelitis Optica Spectrum Disorder Therapeutics Market Volume (K Unit), by Country 2024 & 2032
- Figure 41: Europe Neuromyelitis Optica Spectrum Disorder Therapeutics Market Revenue Share (%), by Country 2024 & 2032
- Figure 42: Europe Neuromyelitis Optica Spectrum Disorder Therapeutics Market Volume Share (%), by Country 2024 & 2032
- Figure 43: Asia Pacific Neuromyelitis Optica Spectrum Disorder Therapeutics Market Revenue (Million), by Treatment 2024 & 2032
- Figure 44: Asia Pacific Neuromyelitis Optica Spectrum Disorder Therapeutics Market Volume (K Unit), by Treatment 2024 & 2032
- Figure 45: Asia Pacific Neuromyelitis Optica Spectrum Disorder Therapeutics Market Revenue Share (%), by Treatment 2024 & 2032
- Figure 46: Asia Pacific Neuromyelitis Optica Spectrum Disorder Therapeutics Market Volume Share (%), by Treatment 2024 & 2032
- Figure 47: Asia Pacific Neuromyelitis Optica Spectrum Disorder Therapeutics Market Revenue (Million), by Country 2024 & 2032
- Figure 48: Asia Pacific Neuromyelitis Optica Spectrum Disorder Therapeutics Market Volume (K Unit), by Country 2024 & 2032
- Figure 49: Asia Pacific Neuromyelitis Optica Spectrum Disorder Therapeutics Market Revenue Share (%), by Country 2024 & 2032
- Figure 50: Asia Pacific Neuromyelitis Optica Spectrum Disorder Therapeutics Market Volume Share (%), by Country 2024 & 2032
- Figure 51: Rest of the World Neuromyelitis Optica Spectrum Disorder Therapeutics Market Revenue (Million), by Treatment 2024 & 2032
- Figure 52: Rest of the World Neuromyelitis Optica Spectrum Disorder Therapeutics Market Volume (K Unit), by Treatment 2024 & 2032
- Figure 53: Rest of the World Neuromyelitis Optica Spectrum Disorder Therapeutics Market Revenue Share (%), by Treatment 2024 & 2032
- Figure 54: Rest of the World Neuromyelitis Optica Spectrum Disorder Therapeutics Market Volume Share (%), by Treatment 2024 & 2032
- Figure 55: Rest of the World Neuromyelitis Optica Spectrum Disorder Therapeutics Market Revenue (Million), by Country 2024 & 2032
- Figure 56: Rest of the World Neuromyelitis Optica Spectrum Disorder Therapeutics Market Volume (K Unit), by Country 2024 & 2032
- Figure 57: Rest of the World Neuromyelitis Optica Spectrum Disorder Therapeutics Market Revenue Share (%), by Country 2024 & 2032
- Figure 58: Rest of the World Neuromyelitis Optica Spectrum Disorder Therapeutics Market Volume Share (%), by Country 2024 & 2032
List of Tables
- Table 1: Global Neuromyelitis Optica Spectrum Disorder Therapeutics Market Revenue Million Forecast, by Region 2019 & 2032
- Table 2: Global Neuromyelitis Optica Spectrum Disorder Therapeutics Market Volume K Unit Forecast, by Region 2019 & 2032
- Table 3: Global Neuromyelitis Optica Spectrum Disorder Therapeutics Market Revenue Million Forecast, by Treatment 2019 & 2032
- Table 4: Global Neuromyelitis Optica Spectrum Disorder Therapeutics Market Volume K Unit Forecast, by Treatment 2019 & 2032
- Table 5: Global Neuromyelitis Optica Spectrum Disorder Therapeutics Market Revenue Million Forecast, by Region 2019 & 2032
- Table 6: Global Neuromyelitis Optica Spectrum Disorder Therapeutics Market Volume K Unit Forecast, by Region 2019 & 2032
- Table 7: Global Neuromyelitis Optica Spectrum Disorder Therapeutics Market Revenue Million Forecast, by Country 2019 & 2032
- Table 8: Global Neuromyelitis Optica Spectrum Disorder Therapeutics Market Volume K Unit Forecast, by Country 2019 & 2032
- Table 9: United States Neuromyelitis Optica Spectrum Disorder Therapeutics Market Revenue (Million) Forecast, by Application 2019 & 2032
- Table 10: United States Neuromyelitis Optica Spectrum Disorder Therapeutics Market Volume (K Unit) Forecast, by Application 2019 & 2032
- Table 11: Canada Neuromyelitis Optica Spectrum Disorder Therapeutics Market Revenue (Million) Forecast, by Application 2019 & 2032
- Table 12: Canada Neuromyelitis Optica Spectrum Disorder Therapeutics Market Volume (K Unit) Forecast, by Application 2019 & 2032
- Table 13: Mexico Neuromyelitis Optica Spectrum Disorder Therapeutics Market Revenue (Million) Forecast, by Application 2019 & 2032
- Table 14: Mexico Neuromyelitis Optica Spectrum Disorder Therapeutics Market Volume (K Unit) Forecast, by Application 2019 & 2032
- Table 15: Global Neuromyelitis Optica Spectrum Disorder Therapeutics Market Revenue Million Forecast, by Country 2019 & 2032
- Table 16: Global Neuromyelitis Optica Spectrum Disorder Therapeutics Market Volume K Unit Forecast, by Country 2019 & 2032
- Table 17: Germany Neuromyelitis Optica Spectrum Disorder Therapeutics Market Revenue (Million) Forecast, by Application 2019 & 2032
- Table 18: Germany Neuromyelitis Optica Spectrum Disorder Therapeutics Market Volume (K Unit) Forecast, by Application 2019 & 2032
- Table 19: United Kingdom Neuromyelitis Optica Spectrum Disorder Therapeutics Market Revenue (Million) Forecast, by Application 2019 & 2032
- Table 20: United Kingdom Neuromyelitis Optica Spectrum Disorder Therapeutics Market Volume (K Unit) Forecast, by Application 2019 & 2032
- Table 21: France Neuromyelitis Optica Spectrum Disorder Therapeutics Market Revenue (Million) Forecast, by Application 2019 & 2032
- Table 22: France Neuromyelitis Optica Spectrum Disorder Therapeutics Market Volume (K Unit) Forecast, by Application 2019 & 2032
- Table 23: Spain Neuromyelitis Optica Spectrum Disorder Therapeutics Market Revenue (Million) Forecast, by Application 2019 & 2032
- Table 24: Spain Neuromyelitis Optica Spectrum Disorder Therapeutics Market Volume (K Unit) Forecast, by Application 2019 & 2032
- Table 25: Italy Neuromyelitis Optica Spectrum Disorder Therapeutics Market Revenue (Million) Forecast, by Application 2019 & 2032
- Table 26: Italy Neuromyelitis Optica Spectrum Disorder Therapeutics Market Volume (K Unit) Forecast, by Application 2019 & 2032
- Table 27: Spain Neuromyelitis Optica Spectrum Disorder Therapeutics Market Revenue (Million) Forecast, by Application 2019 & 2032
- Table 28: Spain Neuromyelitis Optica Spectrum Disorder Therapeutics Market Volume (K Unit) Forecast, by Application 2019 & 2032
- Table 29: Belgium Neuromyelitis Optica Spectrum Disorder Therapeutics Market Revenue (Million) Forecast, by Application 2019 & 2032
- Table 30: Belgium Neuromyelitis Optica Spectrum Disorder Therapeutics Market Volume (K Unit) Forecast, by Application 2019 & 2032
- Table 31: Netherland Neuromyelitis Optica Spectrum Disorder Therapeutics Market Revenue (Million) Forecast, by Application 2019 & 2032
- Table 32: Netherland Neuromyelitis Optica Spectrum Disorder Therapeutics Market Volume (K Unit) Forecast, by Application 2019 & 2032
- Table 33: Nordics Neuromyelitis Optica Spectrum Disorder Therapeutics Market Revenue (Million) Forecast, by Application 2019 & 2032
- Table 34: Nordics Neuromyelitis Optica Spectrum Disorder Therapeutics Market Volume (K Unit) Forecast, by Application 2019 & 2032
- Table 35: Rest of Europe Neuromyelitis Optica Spectrum Disorder Therapeutics Market Revenue (Million) Forecast, by Application 2019 & 2032
- Table 36: Rest of Europe Neuromyelitis Optica Spectrum Disorder Therapeutics Market Volume (K Unit) Forecast, by Application 2019 & 2032
- Table 37: Global Neuromyelitis Optica Spectrum Disorder Therapeutics Market Revenue Million Forecast, by Country 2019 & 2032
- Table 38: Global Neuromyelitis Optica Spectrum Disorder Therapeutics Market Volume K Unit Forecast, by Country 2019 & 2032
- Table 39: China Neuromyelitis Optica Spectrum Disorder Therapeutics Market Revenue (Million) Forecast, by Application 2019 & 2032
- Table 40: China Neuromyelitis Optica Spectrum Disorder Therapeutics Market Volume (K Unit) Forecast, by Application 2019 & 2032
- Table 41: Japan Neuromyelitis Optica Spectrum Disorder Therapeutics Market Revenue (Million) Forecast, by Application 2019 & 2032
- Table 42: Japan Neuromyelitis Optica Spectrum Disorder Therapeutics Market Volume (K Unit) Forecast, by Application 2019 & 2032
- Table 43: India Neuromyelitis Optica Spectrum Disorder Therapeutics Market Revenue (Million) Forecast, by Application 2019 & 2032
- Table 44: India Neuromyelitis Optica Spectrum Disorder Therapeutics Market Volume (K Unit) Forecast, by Application 2019 & 2032
- Table 45: South Korea Neuromyelitis Optica Spectrum Disorder Therapeutics Market Revenue (Million) Forecast, by Application 2019 & 2032
- Table 46: South Korea Neuromyelitis Optica Spectrum Disorder Therapeutics Market Volume (K Unit) Forecast, by Application 2019 & 2032
- Table 47: Southeast Asia Neuromyelitis Optica Spectrum Disorder Therapeutics Market Revenue (Million) Forecast, by Application 2019 & 2032
- Table 48: Southeast Asia Neuromyelitis Optica Spectrum Disorder Therapeutics Market Volume (K Unit) Forecast, by Application 2019 & 2032
- Table 49: Australia Neuromyelitis Optica Spectrum Disorder Therapeutics Market Revenue (Million) Forecast, by Application 2019 & 2032
- Table 50: Australia Neuromyelitis Optica Spectrum Disorder Therapeutics Market Volume (K Unit) Forecast, by Application 2019 & 2032
- Table 51: Indonesia Neuromyelitis Optica Spectrum Disorder Therapeutics Market Revenue (Million) Forecast, by Application 2019 & 2032
- Table 52: Indonesia Neuromyelitis Optica Spectrum Disorder Therapeutics Market Volume (K Unit) Forecast, by Application 2019 & 2032
- Table 53: Phillipes Neuromyelitis Optica Spectrum Disorder Therapeutics Market Revenue (Million) Forecast, by Application 2019 & 2032
- Table 54: Phillipes Neuromyelitis Optica Spectrum Disorder Therapeutics Market Volume (K Unit) Forecast, by Application 2019 & 2032
- Table 55: Singapore Neuromyelitis Optica Spectrum Disorder Therapeutics Market Revenue (Million) Forecast, by Application 2019 & 2032
- Table 56: Singapore Neuromyelitis Optica Spectrum Disorder Therapeutics Market Volume (K Unit) Forecast, by Application 2019 & 2032
- Table 57: Thailandc Neuromyelitis Optica Spectrum Disorder Therapeutics Market Revenue (Million) Forecast, by Application 2019 & 2032
- Table 58: Thailandc Neuromyelitis Optica Spectrum Disorder Therapeutics Market Volume (K Unit) Forecast, by Application 2019 & 2032
- Table 59: Rest of Asia Pacific Neuromyelitis Optica Spectrum Disorder Therapeutics Market Revenue (Million) Forecast, by Application 2019 & 2032
- Table 60: Rest of Asia Pacific Neuromyelitis Optica Spectrum Disorder Therapeutics Market Volume (K Unit) Forecast, by Application 2019 & 2032
- Table 61: Global Neuromyelitis Optica Spectrum Disorder Therapeutics Market Revenue Million Forecast, by Country 2019 & 2032
- Table 62: Global Neuromyelitis Optica Spectrum Disorder Therapeutics Market Volume K Unit Forecast, by Country 2019 & 2032
- Table 63: Brazil Neuromyelitis Optica Spectrum Disorder Therapeutics Market Revenue (Million) Forecast, by Application 2019 & 2032
- Table 64: Brazil Neuromyelitis Optica Spectrum Disorder Therapeutics Market Volume (K Unit) Forecast, by Application 2019 & 2032
- Table 65: Argentina Neuromyelitis Optica Spectrum Disorder Therapeutics Market Revenue (Million) Forecast, by Application 2019 & 2032
- Table 66: Argentina Neuromyelitis Optica Spectrum Disorder Therapeutics Market Volume (K Unit) Forecast, by Application 2019 & 2032
- Table 67: Peru Neuromyelitis Optica Spectrum Disorder Therapeutics Market Revenue (Million) Forecast, by Application 2019 & 2032
- Table 68: Peru Neuromyelitis Optica Spectrum Disorder Therapeutics Market Volume (K Unit) Forecast, by Application 2019 & 2032
- Table 69: Chile Neuromyelitis Optica Spectrum Disorder Therapeutics Market Revenue (Million) Forecast, by Application 2019 & 2032
- Table 70: Chile Neuromyelitis Optica Spectrum Disorder Therapeutics Market Volume (K Unit) Forecast, by Application 2019 & 2032
- Table 71: Colombia Neuromyelitis Optica Spectrum Disorder Therapeutics Market Revenue (Million) Forecast, by Application 2019 & 2032
- Table 72: Colombia Neuromyelitis Optica Spectrum Disorder Therapeutics Market Volume (K Unit) Forecast, by Application 2019 & 2032
- Table 73: Ecuador Neuromyelitis Optica Spectrum Disorder Therapeutics Market Revenue (Million) Forecast, by Application 2019 & 2032
- Table 74: Ecuador Neuromyelitis Optica Spectrum Disorder Therapeutics Market Volume (K Unit) Forecast, by Application 2019 & 2032
- Table 75: Venezuela Neuromyelitis Optica Spectrum Disorder Therapeutics Market Revenue (Million) Forecast, by Application 2019 & 2032
- Table 76: Venezuela Neuromyelitis Optica Spectrum Disorder Therapeutics Market Volume (K Unit) Forecast, by Application 2019 & 2032
- Table 77: Rest of South America Neuromyelitis Optica Spectrum Disorder Therapeutics Market Revenue (Million) Forecast, by Application 2019 & 2032
- Table 78: Rest of South America Neuromyelitis Optica Spectrum Disorder Therapeutics Market Volume (K Unit) Forecast, by Application 2019 & 2032
- Table 79: Global Neuromyelitis Optica Spectrum Disorder Therapeutics Market Revenue Million Forecast, by Country 2019 & 2032
- Table 80: Global Neuromyelitis Optica Spectrum Disorder Therapeutics Market Volume K Unit Forecast, by Country 2019 & 2032
- Table 81: United States Neuromyelitis Optica Spectrum Disorder Therapeutics Market Revenue (Million) Forecast, by Application 2019 & 2032
- Table 82: United States Neuromyelitis Optica Spectrum Disorder Therapeutics Market Volume (K Unit) Forecast, by Application 2019 & 2032
- Table 83: Canada Neuromyelitis Optica Spectrum Disorder Therapeutics Market Revenue (Million) Forecast, by Application 2019 & 2032
- Table 84: Canada Neuromyelitis Optica Spectrum Disorder Therapeutics Market Volume (K Unit) Forecast, by Application 2019 & 2032
- Table 85: Mexico Neuromyelitis Optica Spectrum Disorder Therapeutics Market Revenue (Million) Forecast, by Application 2019 & 2032
- Table 86: Mexico Neuromyelitis Optica Spectrum Disorder Therapeutics Market Volume (K Unit) Forecast, by Application 2019 & 2032
- Table 87: Global Neuromyelitis Optica Spectrum Disorder Therapeutics Market Revenue Million Forecast, by Country 2019 & 2032
- Table 88: Global Neuromyelitis Optica Spectrum Disorder Therapeutics Market Volume K Unit Forecast, by Country 2019 & 2032
- Table 89: United Arab Emirates Neuromyelitis Optica Spectrum Disorder Therapeutics Market Revenue (Million) Forecast, by Application 2019 & 2032
- Table 90: United Arab Emirates Neuromyelitis Optica Spectrum Disorder Therapeutics Market Volume (K Unit) Forecast, by Application 2019 & 2032
- Table 91: Saudi Arabia Neuromyelitis Optica Spectrum Disorder Therapeutics Market Revenue (Million) Forecast, by Application 2019 & 2032
- Table 92: Saudi Arabia Neuromyelitis Optica Spectrum Disorder Therapeutics Market Volume (K Unit) Forecast, by Application 2019 & 2032
- Table 93: South Africa Neuromyelitis Optica Spectrum Disorder Therapeutics Market Revenue (Million) Forecast, by Application 2019 & 2032
- Table 94: South Africa Neuromyelitis Optica Spectrum Disorder Therapeutics Market Volume (K Unit) Forecast, by Application 2019 & 2032
- Table 95: Rest of Middle East and Africa Neuromyelitis Optica Spectrum Disorder Therapeutics Market Revenue (Million) Forecast, by Application 2019 & 2032
- Table 96: Rest of Middle East and Africa Neuromyelitis Optica Spectrum Disorder Therapeutics Market Volume (K Unit) Forecast, by Application 2019 & 2032
- Table 97: Global Neuromyelitis Optica Spectrum Disorder Therapeutics Market Revenue Million Forecast, by Treatment 2019 & 2032
- Table 98: Global Neuromyelitis Optica Spectrum Disorder Therapeutics Market Volume K Unit Forecast, by Treatment 2019 & 2032
- Table 99: Global Neuromyelitis Optica Spectrum Disorder Therapeutics Market Revenue Million Forecast, by Country 2019 & 2032
- Table 100: Global Neuromyelitis Optica Spectrum Disorder Therapeutics Market Volume K Unit Forecast, by Country 2019 & 2032
- Table 101: United States Neuromyelitis Optica Spectrum Disorder Therapeutics Market Revenue (Million) Forecast, by Application 2019 & 2032
- Table 102: United States Neuromyelitis Optica Spectrum Disorder Therapeutics Market Volume (K Unit) Forecast, by Application 2019 & 2032
- Table 103: Canada Neuromyelitis Optica Spectrum Disorder Therapeutics Market Revenue (Million) Forecast, by Application 2019 & 2032
- Table 104: Canada Neuromyelitis Optica Spectrum Disorder Therapeutics Market Volume (K Unit) Forecast, by Application 2019 & 2032
- Table 105: Mexico Neuromyelitis Optica Spectrum Disorder Therapeutics Market Revenue (Million) Forecast, by Application 2019 & 2032
- Table 106: Mexico Neuromyelitis Optica Spectrum Disorder Therapeutics Market Volume (K Unit) Forecast, by Application 2019 & 2032
- Table 107: Global Neuromyelitis Optica Spectrum Disorder Therapeutics Market Revenue Million Forecast, by Treatment 2019 & 2032
- Table 108: Global Neuromyelitis Optica Spectrum Disorder Therapeutics Market Volume K Unit Forecast, by Treatment 2019 & 2032
- Table 109: Global Neuromyelitis Optica Spectrum Disorder Therapeutics Market Revenue Million Forecast, by Country 2019 & 2032
- Table 110: Global Neuromyelitis Optica Spectrum Disorder Therapeutics Market Volume K Unit Forecast, by Country 2019 & 2032
- Table 111: Germany Neuromyelitis Optica Spectrum Disorder Therapeutics Market Revenue (Million) Forecast, by Application 2019 & 2032
- Table 112: Germany Neuromyelitis Optica Spectrum Disorder Therapeutics Market Volume (K Unit) Forecast, by Application 2019 & 2032
- Table 113: United Kingdom Neuromyelitis Optica Spectrum Disorder Therapeutics Market Revenue (Million) Forecast, by Application 2019 & 2032
- Table 114: United Kingdom Neuromyelitis Optica Spectrum Disorder Therapeutics Market Volume (K Unit) Forecast, by Application 2019 & 2032
- Table 115: France Neuromyelitis Optica Spectrum Disorder Therapeutics Market Revenue (Million) Forecast, by Application 2019 & 2032
- Table 116: France Neuromyelitis Optica Spectrum Disorder Therapeutics Market Volume (K Unit) Forecast, by Application 2019 & 2032
- Table 117: Italy Neuromyelitis Optica Spectrum Disorder Therapeutics Market Revenue (Million) Forecast, by Application 2019 & 2032
- Table 118: Italy Neuromyelitis Optica Spectrum Disorder Therapeutics Market Volume (K Unit) Forecast, by Application 2019 & 2032
- Table 119: Spain Neuromyelitis Optica Spectrum Disorder Therapeutics Market Revenue (Million) Forecast, by Application 2019 & 2032
- Table 120: Spain Neuromyelitis Optica Spectrum Disorder Therapeutics Market Volume (K Unit) Forecast, by Application 2019 & 2032
- Table 121: Rest of Europe Neuromyelitis Optica Spectrum Disorder Therapeutics Market Revenue (Million) Forecast, by Application 2019 & 2032
- Table 122: Rest of Europe Neuromyelitis Optica Spectrum Disorder Therapeutics Market Volume (K Unit) Forecast, by Application 2019 & 2032
- Table 123: Global Neuromyelitis Optica Spectrum Disorder Therapeutics Market Revenue Million Forecast, by Treatment 2019 & 2032
- Table 124: Global Neuromyelitis Optica Spectrum Disorder Therapeutics Market Volume K Unit Forecast, by Treatment 2019 & 2032
- Table 125: Global Neuromyelitis Optica Spectrum Disorder Therapeutics Market Revenue Million Forecast, by Country 2019 & 2032
- Table 126: Global Neuromyelitis Optica Spectrum Disorder Therapeutics Market Volume K Unit Forecast, by Country 2019 & 2032
- Table 127: China Neuromyelitis Optica Spectrum Disorder Therapeutics Market Revenue (Million) Forecast, by Application 2019 & 2032
- Table 128: China Neuromyelitis Optica Spectrum Disorder Therapeutics Market Volume (K Unit) Forecast, by Application 2019 & 2032
- Table 129: Japan Neuromyelitis Optica Spectrum Disorder Therapeutics Market Revenue (Million) Forecast, by Application 2019 & 2032
- Table 130: Japan Neuromyelitis Optica Spectrum Disorder Therapeutics Market Volume (K Unit) Forecast, by Application 2019 & 2032
- Table 131: India Neuromyelitis Optica Spectrum Disorder Therapeutics Market Revenue (Million) Forecast, by Application 2019 & 2032
- Table 132: India Neuromyelitis Optica Spectrum Disorder Therapeutics Market Volume (K Unit) Forecast, by Application 2019 & 2032
- Table 133: Australia Neuromyelitis Optica Spectrum Disorder Therapeutics Market Revenue (Million) Forecast, by Application 2019 & 2032
- Table 134: Australia Neuromyelitis Optica Spectrum Disorder Therapeutics Market Volume (K Unit) Forecast, by Application 2019 & 2032
- Table 135: South Korea Neuromyelitis Optica Spectrum Disorder Therapeutics Market Revenue (Million) Forecast, by Application 2019 & 2032
- Table 136: South Korea Neuromyelitis Optica Spectrum Disorder Therapeutics Market Volume (K Unit) Forecast, by Application 2019 & 2032
- Table 137: Rest of Asia Pacific Neuromyelitis Optica Spectrum Disorder Therapeutics Market Revenue (Million) Forecast, by Application 2019 & 2032
- Table 138: Rest of Asia Pacific Neuromyelitis Optica Spectrum Disorder Therapeutics Market Volume (K Unit) Forecast, by Application 2019 & 2032
- Table 139: Global Neuromyelitis Optica Spectrum Disorder Therapeutics Market Revenue Million Forecast, by Treatment 2019 & 2032
- Table 140: Global Neuromyelitis Optica Spectrum Disorder Therapeutics Market Volume K Unit Forecast, by Treatment 2019 & 2032
- Table 141: Global Neuromyelitis Optica Spectrum Disorder Therapeutics Market Revenue Million Forecast, by Country 2019 & 2032
- Table 142: Global Neuromyelitis Optica Spectrum Disorder Therapeutics Market Volume K Unit Forecast, by Country 2019 & 2032
Frequently Asked Questions
1. What is the projected Compound Annual Growth Rate (CAGR) of the Neuromyelitis Optica Spectrum Disorder Therapeutics Market?
The projected CAGR is approximately 6.20%.
2. Which companies are prominent players in the Neuromyelitis Optica Spectrum Disorder Therapeutics Market?
Key companies in the market include TG Therapeutics, Horizon Therapeutics plc (Viela Bio), RemeGen, AstraZeneca, Teva Pharmaceutical Industries Ltd, Harbour BioMed, Opexa Therapeutics, Mitsubishi Tanabe Pharma, Hoffmann-La Roche Ltd, Horizon Therapeutics plc.
3. What are the main segments of the Neuromyelitis Optica Spectrum Disorder Therapeutics Market?
The market segments include Treatment.
4. Can you provide details about the market size?
The market size is estimated to be USD XX Million as of 2022.
5. What are some drivers contributing to market growth?
Increasing Incidence of Neuromyelitis Optica Spectrum Disorder; Increasing Research and Development Activities. Product Approvals and Rising Demand for Better Treatment Options.
6. What are the notable trends driving market growth?
Monoclonal Antibody Drugs Segment Expects to Register a High CAGR in the Forecast Period.
7. Are there any restraints impacting market growth?
High Cost of Therapy for Neuromyelitis Optica Spectrum Disorder.
8. Can you provide examples of recent developments in the market?
N/A
9. What pricing options are available for accessing the report?
Pricing options include single-user, multi-user, and enterprise licenses priced at USD 4750, USD 5250, and USD 8750 respectively.
10. Is the market size provided in terms of value or volume?
The market size is provided in terms of value, measured in Million and volume, measured in K Unit.
11. Are there any specific market keywords associated with the report?
Yes, the market keyword associated with the report is "Neuromyelitis Optica Spectrum Disorder Therapeutics Market," which aids in identifying and referencing the specific market segment covered.
12. How do I determine which pricing option suits my needs best?
The pricing options vary based on user requirements and access needs. Individual users may opt for single-user licenses, while businesses requiring broader access may choose multi-user or enterprise licenses for cost-effective access to the report.
13. Are there any additional resources or data provided in the Neuromyelitis Optica Spectrum Disorder Therapeutics Market report?
While the report offers comprehensive insights, it's advisable to review the specific contents or supplementary materials provided to ascertain if additional resources or data are available.
14. How can I stay updated on further developments or reports in the Neuromyelitis Optica Spectrum Disorder Therapeutics Market?
To stay informed about further developments, trends, and reports in the Neuromyelitis Optica Spectrum Disorder Therapeutics Market, consider subscribing to industry newsletters, following relevant companies and organizations, or regularly checking reputable industry news sources and publications.
Methodology
Step 1 - Identification of Relevant Samples Size from Population Database


Step 2 - Approaches for Defining Global Market Size (Value, Volume* & Price*)

Note*: In applicable scenarios
Step 3 - Data Sources
Primary Research
- Web Analytics
- Survey Reports
- Research Institute
- Latest Research Reports
- Opinion Leaders
Secondary Research
- Annual Reports
- White Paper
- Latest Press Release
- Industry Association
- Paid Database
- Investor Presentations

Step 4 - Data Triangulation
Involves using different sources of information in order to increase the validity of a study
These sources are likely to be stakeholders in a program - participants, other researchers, program staff, other community members, and so on.
Then we put all data in single framework & apply various statistical tools to find out the dynamic on the market.
During the analysis stage, feedback from the stakeholder groups would be compared to determine areas of agreement as well as areas of divergence


