
Key Insights
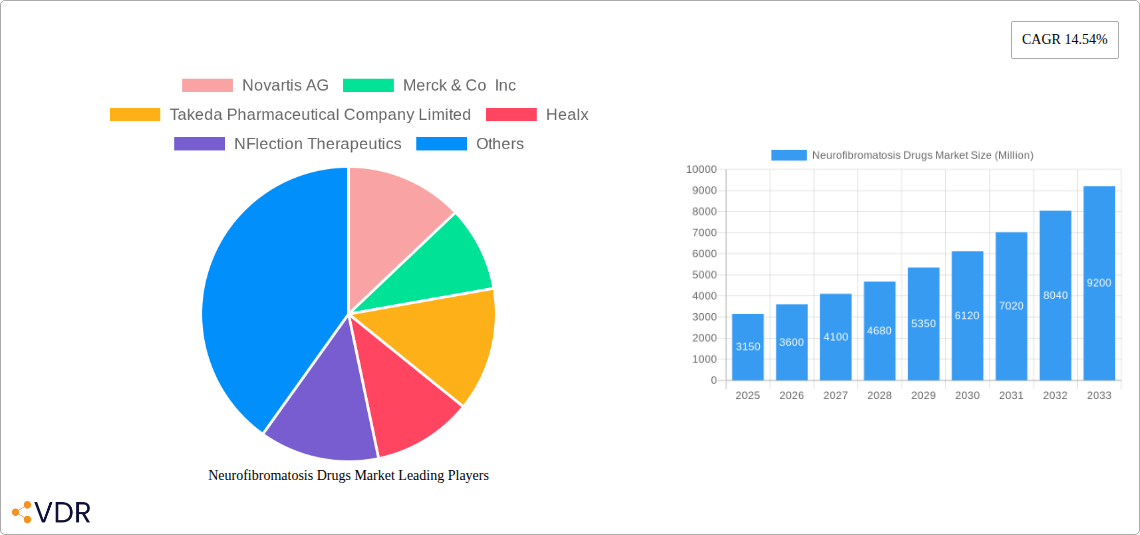
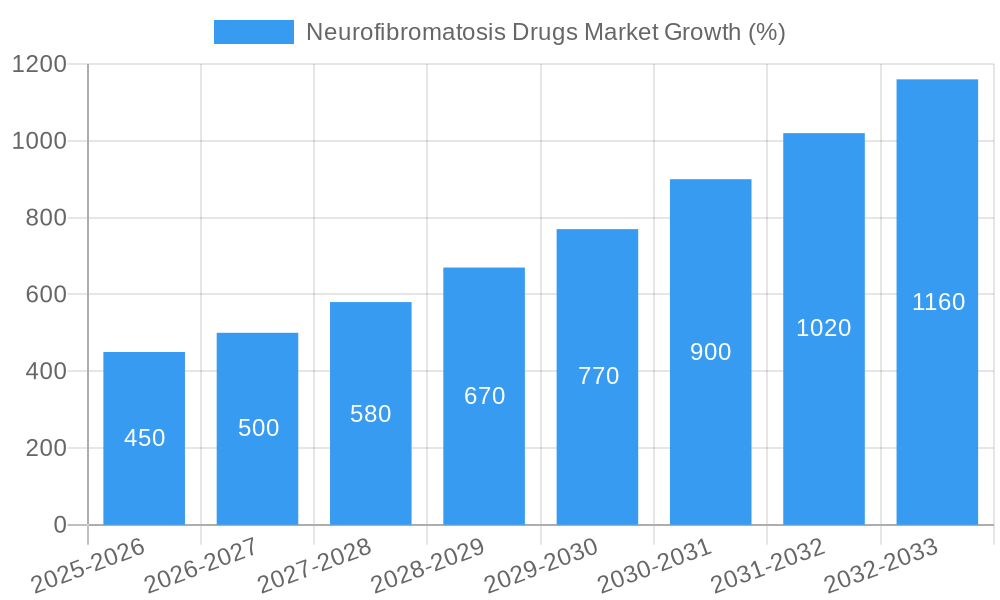
The Neurofibromatosis (NF) drugs market, valued at $3.15 billion in 2025, is projected to experience robust growth, driven by increasing prevalence of NF1, NF2, and Schwannomatosis, coupled with ongoing research and development efforts focused on novel therapies. The market's Compound Annual Growth Rate (CAGR) of 14.54% from 2025 to 2033 indicates significant future expansion. Key drivers include a growing understanding of NF genetics and pathogenesis, leading to the development of targeted therapies, and an increasing demand for effective treatment options to manage the diverse symptoms associated with these conditions, ranging from benign tumors to severe neurological complications. The market is segmented by disease type (NF1, NF2, Schwannomatosis) and end-user (hospital pharmacies, drug stores, online pharmacies). Major players such as Novartis, Merck, Takeda, and others are actively involved in clinical trials and drug development, further fueling market expansion. The North American market currently holds a significant share, attributed to advanced healthcare infrastructure and higher disease prevalence, although other regions, especially Europe and Asia Pacific, are expected to witness substantial growth due to increasing awareness and improved healthcare access. Challenges include the relatively low prevalence of NF compared to other neurological disorders, the complexity of disease heterogeneity, and the long development timelines associated with orphan drug development.
The substantial investment in research and development by pharmaceutical companies underscores the market's potential. The pipeline includes various therapies targeting different aspects of NF, including tumor growth inhibition, symptom management, and disease progression slowing. Successful development and regulatory approval of these therapies will substantially impact market growth in the forecast period. The increasing adoption of online pharmacies is also likely to contribute to market expansion, providing convenient access to medications for patients. However, regulatory hurdles and pricing complexities associated with orphan drugs could pose challenges to market penetration. The competitive landscape is marked by a combination of established pharmaceutical companies and emerging biotech firms, creating a dynamic environment characterized by both innovation and competition.
Neurofibromatosis Drugs Market: A Comprehensive Report (2019-2033)
This comprehensive report provides a detailed analysis of the Neurofibromatosis Drugs Market, encompassing market dynamics, growth trends, regional segmentation, product landscape, key players, and future outlook. The study period spans from 2019 to 2033, with 2025 serving as the base and estimated year. The report caters to industry professionals, investors, and researchers seeking in-depth insights into this evolving pharmaceutical market segment. The parent market is the Rare Disease Drugs Market and the child market is the Neurofibromatosis Drugs Market.
Neurofibromatosis Drugs Market Market Dynamics & Structure
The Neurofibromatosis Drugs market is characterized by a moderately concentrated landscape, with key players like Novartis AG, Merck & Co Inc, and Takeda Pharmaceutical Company Limited holding significant market share (estimated at xx% combined in 2025). Technological innovation, particularly in targeted therapies and AI-driven drug discovery, is a major driver. Regulatory frameworks, including expedited approval pathways for orphan drugs, influence market entry and growth. Competitive substitutes are limited, creating opportunities for novel therapies. The end-user demographic primarily comprises hospitals and specialized clinics. M&A activity has been moderate, with xx deals recorded in the historical period (2019-2024), indicating a strategic focus on portfolio expansion and pipeline development.
- Market Concentration: Moderately concentrated, with top 3 players holding xx% market share (2025).
- Technological Innovation: AI-powered drug discovery and targeted therapies are key drivers.
- Regulatory Framework: Expedited approval pathways for orphan drugs influence market dynamics.
- Competitive Landscape: Limited substitutes create opportunities for novel therapies.
- End-User Demographics: Primarily hospitals and specialized clinics.
- M&A Activity: xx deals in 2019-2024, driven by portfolio expansion and pipeline development.
Neurofibromatosis Drugs Market Growth Trends & Insights
The Neurofibromatosis Drugs Market is projected to experience significant growth during the forecast period (2025-2033), with a CAGR of xx%. This growth is fueled by increasing prevalence of neurofibromatosis types (NF1, NF2, and Schwannomatosis), rising awareness among patients and healthcare professionals, and ongoing investments in research and development. The market penetration is expected to increase from xx% in 2025 to xx% by 2033, driven by technological advancements in drug delivery systems and enhanced efficacy of treatment options. Adoption rates are expected to grow steadily across different geographic regions as access to advanced healthcare facilities improves. Shifting consumer behavior towards personalized medicine and a preference for targeted therapies further contributes to market expansion. Technological disruptions, particularly the implementation of AI and machine learning in drug discovery, have accelerated the development pipeline, leading to the introduction of novel therapeutics.
Dominant Regions, Countries, or Segments in Neurofibromatosis Drugs Market
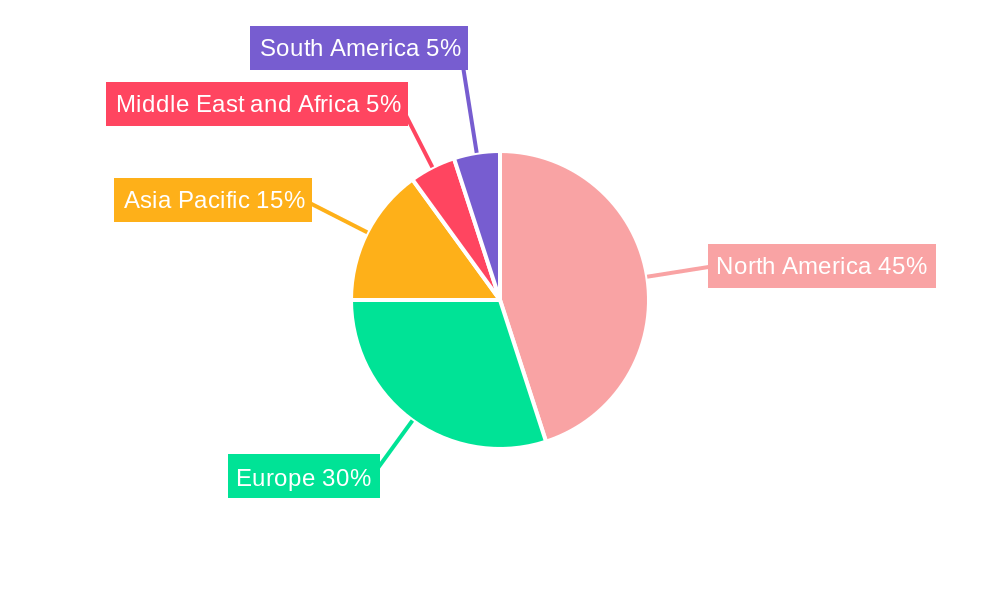
The North American region is expected to dominate the Neurofibromatosis Drugs Market throughout the forecast period, owing to factors such as higher healthcare expenditure, robust research infrastructure, and the presence of key market players. Within North America, the United States holds the largest market share due to a higher prevalence of NF1 and NF2 cases.
Disease Type: NF1 holds the largest market segment, driven by its higher prevalence.
End User: Hospital pharmacies are the dominant end-user segment due to their role in providing specialized treatments.
- North America: Highest market share driven by high healthcare expenditure and research infrastructure.
- Europe: Significant market presence due to rising awareness and improving healthcare access.
- Asia-Pacific: Market growth driven by increasing healthcare investments and rising prevalence.
- NF1 Dominance: Largest market segment due to higher prevalence compared to NF2 and Schwannomatosis.
- Hospital Pharmacies: Primary end-user segment due to the specialized nature of neurofibromatosis treatments.
Neurofibromatosis Drugs Market Product Landscape
The Neurofibromatosis Drugs market features a range of therapies, including targeted agents, supportive care medications, and investigational drugs in various clinical trial phases. Product innovation is heavily focused on improving efficacy, reducing adverse effects, and extending treatment options to address unmet needs. Key performance metrics include efficacy rates, response duration, and tolerability profiles. Unique selling propositions often center on improved targeted delivery, reduced toxicity, and enhanced patient outcomes. Technological advancements like advanced drug delivery systems and personalized medicine approaches are enhancing product development.
Key Drivers, Barriers & Challenges in Neurofibromatosis Drugs Market
Key Drivers:
- Increasing prevalence of NF1, NF2, and Schwannomatosis.
- Growing investments in R&D by pharmaceutical companies.
- Technological advancements in drug discovery and development.
- Favorable regulatory policies for orphan drugs.
Challenges & Restraints:
- High cost of drug development and treatment.
- Limited treatment options for certain neurofibromatosis subtypes.
- Challenges in clinical trial recruitment due to the rarity of these diseases.
- Potential side effects of existing and novel therapies.
Emerging Opportunities in Neurofibromatosis Drugs Market
- Untapped Markets: Expanding market penetration in emerging economies.
- Innovative Applications: Development of combination therapies and personalized medicine approaches.
- Evolving Consumer Preferences: Focus on improved patient adherence and quality of life.
Growth Accelerators in the Neurofibromatosis Drugs Market Industry
The Neurofibromatosis Drugs market is poised for accelerated growth due to several factors, including breakthroughs in targeted therapies, strategic partnerships between pharmaceutical companies and research institutions, and expansion into underserved markets. Continued investment in clinical trials and the development of novel treatment modalities will significantly influence market expansion. Strategic collaborations and the development of innovative clinical trial designs will play a vital role in enhancing market growth.
Key Players Shaping the Neurofibromatosis Drugs Market Market
- Novartis AG
- Merck & Co Inc
- Takeda Pharmaceutical Company Limited
- Healx
- NFlection Therapeutics
- Recursion Pharmaceuticals
- SpringWorks Therapeutics
- AstraZeneca Pharmaceuticals
- Fosun Pharmaceutical
- Pfizer Inc
Notable Milestones in Neurofibromatosis Drugs Market Sector
- March 2024: SpringWorks Therapeutics initiated a new drug application for mirdametinib in pediatric and adult patients with neurofibromatosis type 1-associated plexiform neurofibromas.
- April 2024: Healx entered an investment agreement with the Children's Tumor Foundation (CTF) to support the advancement of its AI-powered neurofibromatosis strategy, including its lead molecule, HLX-1502, which is about to enter a Phase 2 clinical trial.
In-Depth Neurofibromatosis Drugs Market Market Outlook
The Neurofibromatosis Drugs Market is projected to experience robust growth in the coming years, driven by ongoing innovation in targeted therapies and a growing understanding of the underlying biology of neurofibromatosis. Strategic partnerships and investments in R&D will further accelerate market expansion. The focus on personalized medicine and improved patient outcomes presents significant opportunities for market players to develop and commercialize innovative treatment solutions. The market’s future success hinges on overcoming challenges related to clinical trial recruitment and addressing unmet medical needs in specific neurofibromatosis subtypes. The market presents substantial potential for growth, making it an attractive area of investment for pharmaceutical companies and other stakeholders.
Neurofibromatosis Drugs Market Segmentation
-
1. Disease Type
- 1.1. Neurofibromatosis Type 1 (NF1)
- 1.2. Neurofibromatosis Type 2 (NF2)
- 1.3. Schwannomatosis
-
2. End User
- 2.1. Hospital Pharmacies
- 2.2. Drug Stores
- 2.3. Online Pharmacies
Neurofibromatosis Drugs Market Segmentation By Geography
-
1. North America
- 1.1. United States
- 1.2. Canada
- 1.3. Mexico
-
2. Europe
- 2.1. Germany
- 2.2. United Kingdom
- 2.3. France
- 2.4. Italy
- 2.5. Spain
- 2.6. Rest of Europe
-
3. Asia Pacific
- 3.1. China
- 3.2. Japan
- 3.3. India
- 3.4. Australia
- 3.5. South Korea
- 3.6. Rest of Asia Pacific
-
4. Middle East and Africa
- 4.1. GCC
- 4.2. South Africa
- 4.3. Rest of Middle East and Africa
-
5. South America
- 5.1. Brazil
- 5.2. Argentina
- 5.3. Rest of South America
Neurofibromatosis Drugs Market REPORT HIGHLIGHTS
| Aspects | Details |
|---|---|
| Study Period | 2019-2033 |
| Base Year | 2024 |
| Estimated Year | 2025 |
| Forecast Period | 2025-2033 |
| Historical Period | 2019-2024 |
| Growth Rate | CAGR of 14.54% from 2019-2033 |
| Segmentation |
|
Table of Contents
- 1. Introduction
- 1.1. Research Scope
- 1.2. Market Segmentation
- 1.3. Research Methodology
- 1.4. Definitions and Assumptions
- 2. Executive Summary
- 2.1. Introduction
- 3. Market Dynamics
- 3.1. Introduction
- 3.2. Market Drivers
- 3.2.1. Increased Focus on Research and Development of Novel Therapies; Support from Regulatory Authorities
- 3.3. Market Restrains
- 3.3.1. Difficulty in Conducting Clinical Trials for Pediatric Population; Low treatment Rate in Developing Countries due to Lack of Treatment Options
- 3.4. Market Trends
- 3.4.1. Neurofibromatosis Type 1 (NF1) is Expected to Show Healthy Market Growth During the Forecast Period
- 4. Market Factor Analysis
- 4.1. Porters Five Forces
- 4.2. Supply/Value Chain
- 4.3. PESTEL analysis
- 4.4. Market Entropy
- 4.5. Patent/Trademark Analysis
- 5. Global Neurofibromatosis Drugs Market Analysis, Insights and Forecast, 2019-2031
- 5.1. Market Analysis, Insights and Forecast - by Disease Type
- 5.1.1. Neurofibromatosis Type 1 (NF1)
- 5.1.2. Neurofibromatosis Type 2 (NF2)
- 5.1.3. Schwannomatosis
- 5.2. Market Analysis, Insights and Forecast - by End User
- 5.2.1. Hospital Pharmacies
- 5.2.2. Drug Stores
- 5.2.3. Online Pharmacies
- 5.3. Market Analysis, Insights and Forecast - by Region
- 5.3.1. North America
- 5.3.2. Europe
- 5.3.3. Asia Pacific
- 5.3.4. Middle East and Africa
- 5.3.5. South America
- 5.1. Market Analysis, Insights and Forecast - by Disease Type
- 6. North America Neurofibromatosis Drugs Market Analysis, Insights and Forecast, 2019-2031
- 6.1. Market Analysis, Insights and Forecast - by Disease Type
- 6.1.1. Neurofibromatosis Type 1 (NF1)
- 6.1.2. Neurofibromatosis Type 2 (NF2)
- 6.1.3. Schwannomatosis
- 6.2. Market Analysis, Insights and Forecast - by End User
- 6.2.1. Hospital Pharmacies
- 6.2.2. Drug Stores
- 6.2.3. Online Pharmacies
- 6.1. Market Analysis, Insights and Forecast - by Disease Type
- 7. Europe Neurofibromatosis Drugs Market Analysis, Insights and Forecast, 2019-2031
- 7.1. Market Analysis, Insights and Forecast - by Disease Type
- 7.1.1. Neurofibromatosis Type 1 (NF1)
- 7.1.2. Neurofibromatosis Type 2 (NF2)
- 7.1.3. Schwannomatosis
- 7.2. Market Analysis, Insights and Forecast - by End User
- 7.2.1. Hospital Pharmacies
- 7.2.2. Drug Stores
- 7.2.3. Online Pharmacies
- 7.1. Market Analysis, Insights and Forecast - by Disease Type
- 8. Asia Pacific Neurofibromatosis Drugs Market Analysis, Insights and Forecast, 2019-2031
- 8.1. Market Analysis, Insights and Forecast - by Disease Type
- 8.1.1. Neurofibromatosis Type 1 (NF1)
- 8.1.2. Neurofibromatosis Type 2 (NF2)
- 8.1.3. Schwannomatosis
- 8.2. Market Analysis, Insights and Forecast - by End User
- 8.2.1. Hospital Pharmacies
- 8.2.2. Drug Stores
- 8.2.3. Online Pharmacies
- 8.1. Market Analysis, Insights and Forecast - by Disease Type
- 9. Middle East and Africa Neurofibromatosis Drugs Market Analysis, Insights and Forecast, 2019-2031
- 9.1. Market Analysis, Insights and Forecast - by Disease Type
- 9.1.1. Neurofibromatosis Type 1 (NF1)
- 9.1.2. Neurofibromatosis Type 2 (NF2)
- 9.1.3. Schwannomatosis
- 9.2. Market Analysis, Insights and Forecast - by End User
- 9.2.1. Hospital Pharmacies
- 9.2.2. Drug Stores
- 9.2.3. Online Pharmacies
- 9.1. Market Analysis, Insights and Forecast - by Disease Type
- 10. South America Neurofibromatosis Drugs Market Analysis, Insights and Forecast, 2019-2031
- 10.1. Market Analysis, Insights and Forecast - by Disease Type
- 10.1.1. Neurofibromatosis Type 1 (NF1)
- 10.1.2. Neurofibromatosis Type 2 (NF2)
- 10.1.3. Schwannomatosis
- 10.2. Market Analysis, Insights and Forecast - by End User
- 10.2.1. Hospital Pharmacies
- 10.2.2. Drug Stores
- 10.2.3. Online Pharmacies
- 10.1. Market Analysis, Insights and Forecast - by Disease Type
- 11. North America Neurofibromatosis Drugs Market Analysis, Insights and Forecast, 2019-2031
- 11.1. Market Analysis, Insights and Forecast - By Country/Sub-region
- 11.1.1. undefined
- 12. Europe Neurofibromatosis Drugs Market Analysis, Insights and Forecast, 2019-2031
- 12.1. Market Analysis, Insights and Forecast - By Country/Sub-region
- 12.1.1. undefined
- 13. Asia Pacific Neurofibromatosis Drugs Market Analysis, Insights and Forecast, 2019-2031
- 13.1. Market Analysis, Insights and Forecast - By Country/Sub-region
- 13.1.1. undefined
- 14. Middle East and Africa Neurofibromatosis Drugs Market Analysis, Insights and Forecast, 2019-2031
- 14.1. Market Analysis, Insights and Forecast - By Country/Sub-region
- 14.1.1. undefined
- 15. South America Neurofibromatosis Drugs Market Analysis, Insights and Forecast, 2019-2031
- 15.1. Market Analysis, Insights and Forecast - By Country/Sub-region
- 15.1.1. undefined
- 16. Competitive Analysis
- 16.1. Global Market Share Analysis 2024
- 16.2. Company Profiles
- 16.2.1 Novartis AG
- 16.2.1.1. Overview
- 16.2.1.2. Products
- 16.2.1.3. SWOT Analysis
- 16.2.1.4. Recent Developments
- 16.2.1.5. Financials (Based on Availability)
- 16.2.2 Merck & Co Inc
- 16.2.2.1. Overview
- 16.2.2.2. Products
- 16.2.2.3. SWOT Analysis
- 16.2.2.4. Recent Developments
- 16.2.2.5. Financials (Based on Availability)
- 16.2.3 Takeda Pharmaceutical Company Limited
- 16.2.3.1. Overview
- 16.2.3.2. Products
- 16.2.3.3. SWOT Analysis
- 16.2.3.4. Recent Developments
- 16.2.3.5. Financials (Based on Availability)
- 16.2.4 Healx
- 16.2.4.1. Overview
- 16.2.4.2. Products
- 16.2.4.3. SWOT Analysis
- 16.2.4.4. Recent Developments
- 16.2.4.5. Financials (Based on Availability)
- 16.2.5 NFlection Therapeutics
- 16.2.5.1. Overview
- 16.2.5.2. Products
- 16.2.5.3. SWOT Analysis
- 16.2.5.4. Recent Developments
- 16.2.5.5. Financials (Based on Availability)
- 16.2.6 Recursion Pharmaceuticals
- 16.2.6.1. Overview
- 16.2.6.2. Products
- 16.2.6.3. SWOT Analysis
- 16.2.6.4. Recent Developments
- 16.2.6.5. Financials (Based on Availability)
- 16.2.7 SpringWorks Therapeutics
- 16.2.7.1. Overview
- 16.2.7.2. Products
- 16.2.7.3. SWOT Analysis
- 16.2.7.4. Recent Developments
- 16.2.7.5. Financials (Based on Availability)
- 16.2.8 AstraZeneca Pharmaceuticals
- 16.2.8.1. Overview
- 16.2.8.2. Products
- 16.2.8.3. SWOT Analysis
- 16.2.8.4. Recent Developments
- 16.2.8.5. Financials (Based on Availability)
- 16.2.9 Fosun Pharmaceutical
- 16.2.9.1. Overview
- 16.2.9.2. Products
- 16.2.9.3. SWOT Analysis
- 16.2.9.4. Recent Developments
- 16.2.9.5. Financials (Based on Availability)
- 16.2.10 Pfizer Inc
- 16.2.10.1. Overview
- 16.2.10.2. Products
- 16.2.10.3. SWOT Analysis
- 16.2.10.4. Recent Developments
- 16.2.10.5. Financials (Based on Availability)
- 16.2.1 Novartis AG
List of Figures
- Figure 1: Global Neurofibromatosis Drugs Market Revenue Breakdown (Million, %) by Region 2024 & 2032
- Figure 2: Global Neurofibromatosis Drugs Market Volume Breakdown (K Unit, %) by Region 2024 & 2032
- Figure 3: North America Neurofibromatosis Drugs Market Revenue (Million), by Country 2024 & 2032
- Figure 4: North America Neurofibromatosis Drugs Market Volume (K Unit), by Country 2024 & 2032
- Figure 5: North America Neurofibromatosis Drugs Market Revenue Share (%), by Country 2024 & 2032
- Figure 6: North America Neurofibromatosis Drugs Market Volume Share (%), by Country 2024 & 2032
- Figure 7: Europe Neurofibromatosis Drugs Market Revenue (Million), by Country 2024 & 2032
- Figure 8: Europe Neurofibromatosis Drugs Market Volume (K Unit), by Country 2024 & 2032
- Figure 9: Europe Neurofibromatosis Drugs Market Revenue Share (%), by Country 2024 & 2032
- Figure 10: Europe Neurofibromatosis Drugs Market Volume Share (%), by Country 2024 & 2032
- Figure 11: Asia Pacific Neurofibromatosis Drugs Market Revenue (Million), by Country 2024 & 2032
- Figure 12: Asia Pacific Neurofibromatosis Drugs Market Volume (K Unit), by Country 2024 & 2032
- Figure 13: Asia Pacific Neurofibromatosis Drugs Market Revenue Share (%), by Country 2024 & 2032
- Figure 14: Asia Pacific Neurofibromatosis Drugs Market Volume Share (%), by Country 2024 & 2032
- Figure 15: Middle East and Africa Neurofibromatosis Drugs Market Revenue (Million), by Country 2024 & 2032
- Figure 16: Middle East and Africa Neurofibromatosis Drugs Market Volume (K Unit), by Country 2024 & 2032
- Figure 17: Middle East and Africa Neurofibromatosis Drugs Market Revenue Share (%), by Country 2024 & 2032
- Figure 18: Middle East and Africa Neurofibromatosis Drugs Market Volume Share (%), by Country 2024 & 2032
- Figure 19: South America Neurofibromatosis Drugs Market Revenue (Million), by Country 2024 & 2032
- Figure 20: South America Neurofibromatosis Drugs Market Volume (K Unit), by Country 2024 & 2032
- Figure 21: South America Neurofibromatosis Drugs Market Revenue Share (%), by Country 2024 & 2032
- Figure 22: South America Neurofibromatosis Drugs Market Volume Share (%), by Country 2024 & 2032
- Figure 23: North America Neurofibromatosis Drugs Market Revenue (Million), by Disease Type 2024 & 2032
- Figure 24: North America Neurofibromatosis Drugs Market Volume (K Unit), by Disease Type 2024 & 2032
- Figure 25: North America Neurofibromatosis Drugs Market Revenue Share (%), by Disease Type 2024 & 2032
- Figure 26: North America Neurofibromatosis Drugs Market Volume Share (%), by Disease Type 2024 & 2032
- Figure 27: North America Neurofibromatosis Drugs Market Revenue (Million), by End User 2024 & 2032
- Figure 28: North America Neurofibromatosis Drugs Market Volume (K Unit), by End User 2024 & 2032
- Figure 29: North America Neurofibromatosis Drugs Market Revenue Share (%), by End User 2024 & 2032
- Figure 30: North America Neurofibromatosis Drugs Market Volume Share (%), by End User 2024 & 2032
- Figure 31: North America Neurofibromatosis Drugs Market Revenue (Million), by Country 2024 & 2032
- Figure 32: North America Neurofibromatosis Drugs Market Volume (K Unit), by Country 2024 & 2032
- Figure 33: North America Neurofibromatosis Drugs Market Revenue Share (%), by Country 2024 & 2032
- Figure 34: North America Neurofibromatosis Drugs Market Volume Share (%), by Country 2024 & 2032
- Figure 35: Europe Neurofibromatosis Drugs Market Revenue (Million), by Disease Type 2024 & 2032
- Figure 36: Europe Neurofibromatosis Drugs Market Volume (K Unit), by Disease Type 2024 & 2032
- Figure 37: Europe Neurofibromatosis Drugs Market Revenue Share (%), by Disease Type 2024 & 2032
- Figure 38: Europe Neurofibromatosis Drugs Market Volume Share (%), by Disease Type 2024 & 2032
- Figure 39: Europe Neurofibromatosis Drugs Market Revenue (Million), by End User 2024 & 2032
- Figure 40: Europe Neurofibromatosis Drugs Market Volume (K Unit), by End User 2024 & 2032
- Figure 41: Europe Neurofibromatosis Drugs Market Revenue Share (%), by End User 2024 & 2032
- Figure 42: Europe Neurofibromatosis Drugs Market Volume Share (%), by End User 2024 & 2032
- Figure 43: Europe Neurofibromatosis Drugs Market Revenue (Million), by Country 2024 & 2032
- Figure 44: Europe Neurofibromatosis Drugs Market Volume (K Unit), by Country 2024 & 2032
- Figure 45: Europe Neurofibromatosis Drugs Market Revenue Share (%), by Country 2024 & 2032
- Figure 46: Europe Neurofibromatosis Drugs Market Volume Share (%), by Country 2024 & 2032
- Figure 47: Asia Pacific Neurofibromatosis Drugs Market Revenue (Million), by Disease Type 2024 & 2032
- Figure 48: Asia Pacific Neurofibromatosis Drugs Market Volume (K Unit), by Disease Type 2024 & 2032
- Figure 49: Asia Pacific Neurofibromatosis Drugs Market Revenue Share (%), by Disease Type 2024 & 2032
- Figure 50: Asia Pacific Neurofibromatosis Drugs Market Volume Share (%), by Disease Type 2024 & 2032
- Figure 51: Asia Pacific Neurofibromatosis Drugs Market Revenue (Million), by End User 2024 & 2032
- Figure 52: Asia Pacific Neurofibromatosis Drugs Market Volume (K Unit), by End User 2024 & 2032
- Figure 53: Asia Pacific Neurofibromatosis Drugs Market Revenue Share (%), by End User 2024 & 2032
- Figure 54: Asia Pacific Neurofibromatosis Drugs Market Volume Share (%), by End User 2024 & 2032
- Figure 55: Asia Pacific Neurofibromatosis Drugs Market Revenue (Million), by Country 2024 & 2032
- Figure 56: Asia Pacific Neurofibromatosis Drugs Market Volume (K Unit), by Country 2024 & 2032
- Figure 57: Asia Pacific Neurofibromatosis Drugs Market Revenue Share (%), by Country 2024 & 2032
- Figure 58: Asia Pacific Neurofibromatosis Drugs Market Volume Share (%), by Country 2024 & 2032
- Figure 59: Middle East and Africa Neurofibromatosis Drugs Market Revenue (Million), by Disease Type 2024 & 2032
- Figure 60: Middle East and Africa Neurofibromatosis Drugs Market Volume (K Unit), by Disease Type 2024 & 2032
- Figure 61: Middle East and Africa Neurofibromatosis Drugs Market Revenue Share (%), by Disease Type 2024 & 2032
- Figure 62: Middle East and Africa Neurofibromatosis Drugs Market Volume Share (%), by Disease Type 2024 & 2032
- Figure 63: Middle East and Africa Neurofibromatosis Drugs Market Revenue (Million), by End User 2024 & 2032
- Figure 64: Middle East and Africa Neurofibromatosis Drugs Market Volume (K Unit), by End User 2024 & 2032
- Figure 65: Middle East and Africa Neurofibromatosis Drugs Market Revenue Share (%), by End User 2024 & 2032
- Figure 66: Middle East and Africa Neurofibromatosis Drugs Market Volume Share (%), by End User 2024 & 2032
- Figure 67: Middle East and Africa Neurofibromatosis Drugs Market Revenue (Million), by Country 2024 & 2032
- Figure 68: Middle East and Africa Neurofibromatosis Drugs Market Volume (K Unit), by Country 2024 & 2032
- Figure 69: Middle East and Africa Neurofibromatosis Drugs Market Revenue Share (%), by Country 2024 & 2032
- Figure 70: Middle East and Africa Neurofibromatosis Drugs Market Volume Share (%), by Country 2024 & 2032
- Figure 71: South America Neurofibromatosis Drugs Market Revenue (Million), by Disease Type 2024 & 2032
- Figure 72: South America Neurofibromatosis Drugs Market Volume (K Unit), by Disease Type 2024 & 2032
- Figure 73: South America Neurofibromatosis Drugs Market Revenue Share (%), by Disease Type 2024 & 2032
- Figure 74: South America Neurofibromatosis Drugs Market Volume Share (%), by Disease Type 2024 & 2032
- Figure 75: South America Neurofibromatosis Drugs Market Revenue (Million), by End User 2024 & 2032
- Figure 76: South America Neurofibromatosis Drugs Market Volume (K Unit), by End User 2024 & 2032
- Figure 77: South America Neurofibromatosis Drugs Market Revenue Share (%), by End User 2024 & 2032
- Figure 78: South America Neurofibromatosis Drugs Market Volume Share (%), by End User 2024 & 2032
- Figure 79: South America Neurofibromatosis Drugs Market Revenue (Million), by Country 2024 & 2032
- Figure 80: South America Neurofibromatosis Drugs Market Volume (K Unit), by Country 2024 & 2032
- Figure 81: South America Neurofibromatosis Drugs Market Revenue Share (%), by Country 2024 & 2032
- Figure 82: South America Neurofibromatosis Drugs Market Volume Share (%), by Country 2024 & 2032
List of Tables
- Table 1: Global Neurofibromatosis Drugs Market Revenue Million Forecast, by Region 2019 & 2032
- Table 2: Global Neurofibromatosis Drugs Market Volume K Unit Forecast, by Region 2019 & 2032
- Table 3: Global Neurofibromatosis Drugs Market Revenue Million Forecast, by Disease Type 2019 & 2032
- Table 4: Global Neurofibromatosis Drugs Market Volume K Unit Forecast, by Disease Type 2019 & 2032
- Table 5: Global Neurofibromatosis Drugs Market Revenue Million Forecast, by End User 2019 & 2032
- Table 6: Global Neurofibromatosis Drugs Market Volume K Unit Forecast, by End User 2019 & 2032
- Table 7: Global Neurofibromatosis Drugs Market Revenue Million Forecast, by Region 2019 & 2032
- Table 8: Global Neurofibromatosis Drugs Market Volume K Unit Forecast, by Region 2019 & 2032
- Table 9: Global Neurofibromatosis Drugs Market Revenue Million Forecast, by Country 2019 & 2032
- Table 10: Global Neurofibromatosis Drugs Market Volume K Unit Forecast, by Country 2019 & 2032
- Table 11: Global Neurofibromatosis Drugs Market Revenue Million Forecast, by Country 2019 & 2032
- Table 12: Global Neurofibromatosis Drugs Market Volume K Unit Forecast, by Country 2019 & 2032
- Table 13: Global Neurofibromatosis Drugs Market Revenue Million Forecast, by Country 2019 & 2032
- Table 14: Global Neurofibromatosis Drugs Market Volume K Unit Forecast, by Country 2019 & 2032
- Table 15: Global Neurofibromatosis Drugs Market Revenue Million Forecast, by Country 2019 & 2032
- Table 16: Global Neurofibromatosis Drugs Market Volume K Unit Forecast, by Country 2019 & 2032
- Table 17: Global Neurofibromatosis Drugs Market Revenue Million Forecast, by Country 2019 & 2032
- Table 18: Global Neurofibromatosis Drugs Market Volume K Unit Forecast, by Country 2019 & 2032
- Table 19: Global Neurofibromatosis Drugs Market Revenue Million Forecast, by Disease Type 2019 & 2032
- Table 20: Global Neurofibromatosis Drugs Market Volume K Unit Forecast, by Disease Type 2019 & 2032
- Table 21: Global Neurofibromatosis Drugs Market Revenue Million Forecast, by End User 2019 & 2032
- Table 22: Global Neurofibromatosis Drugs Market Volume K Unit Forecast, by End User 2019 & 2032
- Table 23: Global Neurofibromatosis Drugs Market Revenue Million Forecast, by Country 2019 & 2032
- Table 24: Global Neurofibromatosis Drugs Market Volume K Unit Forecast, by Country 2019 & 2032
- Table 25: United States Neurofibromatosis Drugs Market Revenue (Million) Forecast, by Application 2019 & 2032
- Table 26: United States Neurofibromatosis Drugs Market Volume (K Unit) Forecast, by Application 2019 & 2032
- Table 27: Canada Neurofibromatosis Drugs Market Revenue (Million) Forecast, by Application 2019 & 2032
- Table 28: Canada Neurofibromatosis Drugs Market Volume (K Unit) Forecast, by Application 2019 & 2032
- Table 29: Mexico Neurofibromatosis Drugs Market Revenue (Million) Forecast, by Application 2019 & 2032
- Table 30: Mexico Neurofibromatosis Drugs Market Volume (K Unit) Forecast, by Application 2019 & 2032
- Table 31: Global Neurofibromatosis Drugs Market Revenue Million Forecast, by Disease Type 2019 & 2032
- Table 32: Global Neurofibromatosis Drugs Market Volume K Unit Forecast, by Disease Type 2019 & 2032
- Table 33: Global Neurofibromatosis Drugs Market Revenue Million Forecast, by End User 2019 & 2032
- Table 34: Global Neurofibromatosis Drugs Market Volume K Unit Forecast, by End User 2019 & 2032
- Table 35: Global Neurofibromatosis Drugs Market Revenue Million Forecast, by Country 2019 & 2032
- Table 36: Global Neurofibromatosis Drugs Market Volume K Unit Forecast, by Country 2019 & 2032
- Table 37: Germany Neurofibromatosis Drugs Market Revenue (Million) Forecast, by Application 2019 & 2032
- Table 38: Germany Neurofibromatosis Drugs Market Volume (K Unit) Forecast, by Application 2019 & 2032
- Table 39: United Kingdom Neurofibromatosis Drugs Market Revenue (Million) Forecast, by Application 2019 & 2032
- Table 40: United Kingdom Neurofibromatosis Drugs Market Volume (K Unit) Forecast, by Application 2019 & 2032
- Table 41: France Neurofibromatosis Drugs Market Revenue (Million) Forecast, by Application 2019 & 2032
- Table 42: France Neurofibromatosis Drugs Market Volume (K Unit) Forecast, by Application 2019 & 2032
- Table 43: Italy Neurofibromatosis Drugs Market Revenue (Million) Forecast, by Application 2019 & 2032
- Table 44: Italy Neurofibromatosis Drugs Market Volume (K Unit) Forecast, by Application 2019 & 2032
- Table 45: Spain Neurofibromatosis Drugs Market Revenue (Million) Forecast, by Application 2019 & 2032
- Table 46: Spain Neurofibromatosis Drugs Market Volume (K Unit) Forecast, by Application 2019 & 2032
- Table 47: Rest of Europe Neurofibromatosis Drugs Market Revenue (Million) Forecast, by Application 2019 & 2032
- Table 48: Rest of Europe Neurofibromatosis Drugs Market Volume (K Unit) Forecast, by Application 2019 & 2032
- Table 49: Global Neurofibromatosis Drugs Market Revenue Million Forecast, by Disease Type 2019 & 2032
- Table 50: Global Neurofibromatosis Drugs Market Volume K Unit Forecast, by Disease Type 2019 & 2032
- Table 51: Global Neurofibromatosis Drugs Market Revenue Million Forecast, by End User 2019 & 2032
- Table 52: Global Neurofibromatosis Drugs Market Volume K Unit Forecast, by End User 2019 & 2032
- Table 53: Global Neurofibromatosis Drugs Market Revenue Million Forecast, by Country 2019 & 2032
- Table 54: Global Neurofibromatosis Drugs Market Volume K Unit Forecast, by Country 2019 & 2032
- Table 55: China Neurofibromatosis Drugs Market Revenue (Million) Forecast, by Application 2019 & 2032
- Table 56: China Neurofibromatosis Drugs Market Volume (K Unit) Forecast, by Application 2019 & 2032
- Table 57: Japan Neurofibromatosis Drugs Market Revenue (Million) Forecast, by Application 2019 & 2032
- Table 58: Japan Neurofibromatosis Drugs Market Volume (K Unit) Forecast, by Application 2019 & 2032
- Table 59: India Neurofibromatosis Drugs Market Revenue (Million) Forecast, by Application 2019 & 2032
- Table 60: India Neurofibromatosis Drugs Market Volume (K Unit) Forecast, by Application 2019 & 2032
- Table 61: Australia Neurofibromatosis Drugs Market Revenue (Million) Forecast, by Application 2019 & 2032
- Table 62: Australia Neurofibromatosis Drugs Market Volume (K Unit) Forecast, by Application 2019 & 2032
- Table 63: South Korea Neurofibromatosis Drugs Market Revenue (Million) Forecast, by Application 2019 & 2032
- Table 64: South Korea Neurofibromatosis Drugs Market Volume (K Unit) Forecast, by Application 2019 & 2032
- Table 65: Rest of Asia Pacific Neurofibromatosis Drugs Market Revenue (Million) Forecast, by Application 2019 & 2032
- Table 66: Rest of Asia Pacific Neurofibromatosis Drugs Market Volume (K Unit) Forecast, by Application 2019 & 2032
- Table 67: Global Neurofibromatosis Drugs Market Revenue Million Forecast, by Disease Type 2019 & 2032
- Table 68: Global Neurofibromatosis Drugs Market Volume K Unit Forecast, by Disease Type 2019 & 2032
- Table 69: Global Neurofibromatosis Drugs Market Revenue Million Forecast, by End User 2019 & 2032
- Table 70: Global Neurofibromatosis Drugs Market Volume K Unit Forecast, by End User 2019 & 2032
- Table 71: Global Neurofibromatosis Drugs Market Revenue Million Forecast, by Country 2019 & 2032
- Table 72: Global Neurofibromatosis Drugs Market Volume K Unit Forecast, by Country 2019 & 2032
- Table 73: GCC Neurofibromatosis Drugs Market Revenue (Million) Forecast, by Application 2019 & 2032
- Table 74: GCC Neurofibromatosis Drugs Market Volume (K Unit) Forecast, by Application 2019 & 2032
- Table 75: South Africa Neurofibromatosis Drugs Market Revenue (Million) Forecast, by Application 2019 & 2032
- Table 76: South Africa Neurofibromatosis Drugs Market Volume (K Unit) Forecast, by Application 2019 & 2032
- Table 77: Rest of Middle East and Africa Neurofibromatosis Drugs Market Revenue (Million) Forecast, by Application 2019 & 2032
- Table 78: Rest of Middle East and Africa Neurofibromatosis Drugs Market Volume (K Unit) Forecast, by Application 2019 & 2032
- Table 79: Global Neurofibromatosis Drugs Market Revenue Million Forecast, by Disease Type 2019 & 2032
- Table 80: Global Neurofibromatosis Drugs Market Volume K Unit Forecast, by Disease Type 2019 & 2032
- Table 81: Global Neurofibromatosis Drugs Market Revenue Million Forecast, by End User 2019 & 2032
- Table 82: Global Neurofibromatosis Drugs Market Volume K Unit Forecast, by End User 2019 & 2032
- Table 83: Global Neurofibromatosis Drugs Market Revenue Million Forecast, by Country 2019 & 2032
- Table 84: Global Neurofibromatosis Drugs Market Volume K Unit Forecast, by Country 2019 & 2032
- Table 85: Brazil Neurofibromatosis Drugs Market Revenue (Million) Forecast, by Application 2019 & 2032
- Table 86: Brazil Neurofibromatosis Drugs Market Volume (K Unit) Forecast, by Application 2019 & 2032
- Table 87: Argentina Neurofibromatosis Drugs Market Revenue (Million) Forecast, by Application 2019 & 2032
- Table 88: Argentina Neurofibromatosis Drugs Market Volume (K Unit) Forecast, by Application 2019 & 2032
- Table 89: Rest of South America Neurofibromatosis Drugs Market Revenue (Million) Forecast, by Application 2019 & 2032
- Table 90: Rest of South America Neurofibromatosis Drugs Market Volume (K Unit) Forecast, by Application 2019 & 2032
Frequently Asked Questions
1. What is the projected Compound Annual Growth Rate (CAGR) of the Neurofibromatosis Drugs Market?
The projected CAGR is approximately 14.54%.
2. Which companies are prominent players in the Neurofibromatosis Drugs Market?
Key companies in the market include Novartis AG, Merck & Co Inc, Takeda Pharmaceutical Company Limited, Healx, NFlection Therapeutics, Recursion Pharmaceuticals, SpringWorks Therapeutics, AstraZeneca Pharmaceuticals, Fosun Pharmaceutical, Pfizer Inc.
3. What are the main segments of the Neurofibromatosis Drugs Market?
The market segments include Disease Type, End User.
4. Can you provide details about the market size?
The market size is estimated to be USD 3.15 Million as of 2022.
5. What are some drivers contributing to market growth?
Increased Focus on Research and Development of Novel Therapies; Support from Regulatory Authorities.
6. What are the notable trends driving market growth?
Neurofibromatosis Type 1 (NF1) is Expected to Show Healthy Market Growth During the Forecast Period.
7. Are there any restraints impacting market growth?
Difficulty in Conducting Clinical Trials for Pediatric Population; Low treatment Rate in Developing Countries due to Lack of Treatment Options.
8. Can you provide examples of recent developments in the market?
April 2024: Healx entered an investment agreement with the Children's Tumor Foundation (CTF). This partnership will support the advancement of Healx's AI-powered neurofibromatosis strategy, including its lead molecule, HLX-1502, which is about to enter a Phase 2 clinical trial.
9. What pricing options are available for accessing the report?
Pricing options include single-user, multi-user, and enterprise licenses priced at USD 4750, USD 5250, and USD 8750 respectively.
10. Is the market size provided in terms of value or volume?
The market size is provided in terms of value, measured in Million and volume, measured in K Unit.
11. Are there any specific market keywords associated with the report?
Yes, the market keyword associated with the report is "Neurofibromatosis Drugs Market," which aids in identifying and referencing the specific market segment covered.
12. How do I determine which pricing option suits my needs best?
The pricing options vary based on user requirements and access needs. Individual users may opt for single-user licenses, while businesses requiring broader access may choose multi-user or enterprise licenses for cost-effective access to the report.
13. Are there any additional resources or data provided in the Neurofibromatosis Drugs Market report?
While the report offers comprehensive insights, it's advisable to review the specific contents or supplementary materials provided to ascertain if additional resources or data are available.
14. How can I stay updated on further developments or reports in the Neurofibromatosis Drugs Market?
To stay informed about further developments, trends, and reports in the Neurofibromatosis Drugs Market, consider subscribing to industry newsletters, following relevant companies and organizations, or regularly checking reputable industry news sources and publications.
Methodology
Step 1 - Identification of Relevant Samples Size from Population Database


Step 2 - Approaches for Defining Global Market Size (Value, Volume* & Price*)

Note*: In applicable scenarios
Step 3 - Data Sources
Primary Research
- Web Analytics
- Survey Reports
- Research Institute
- Latest Research Reports
- Opinion Leaders
Secondary Research
- Annual Reports
- White Paper
- Latest Press Release
- Industry Association
- Paid Database
- Investor Presentations

Step 4 - Data Triangulation
Involves using different sources of information in order to increase the validity of a study
These sources are likely to be stakeholders in a program - participants, other researchers, program staff, other community members, and so on.
Then we put all data in single framework & apply various statistical tools to find out the dynamic on the market.
During the analysis stage, feedback from the stakeholder groups would be compared to determine areas of agreement as well as areas of divergence


