
Key Insights
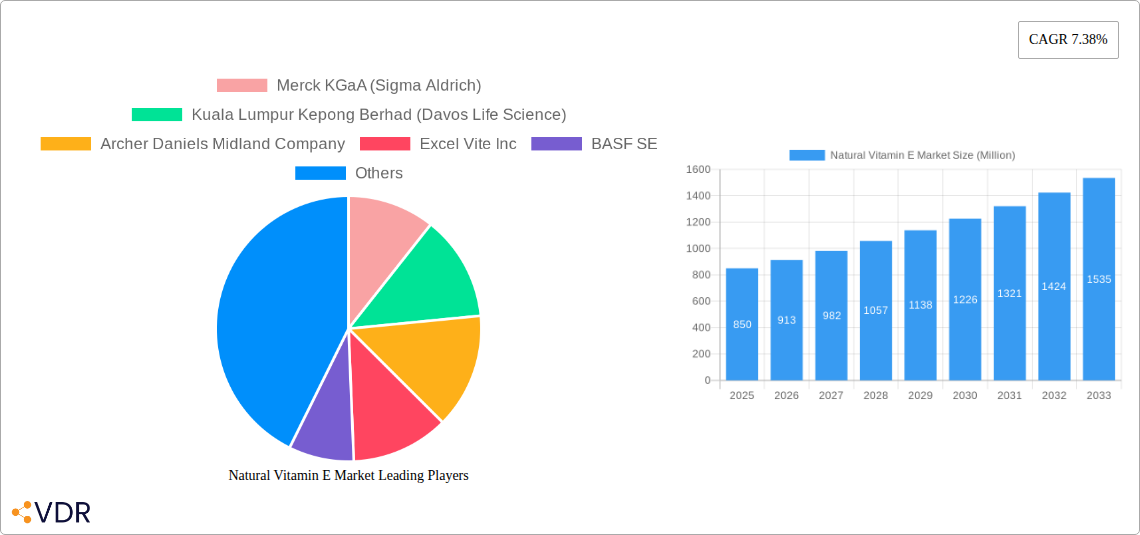
The global natural vitamin E market, valued at $850 million in 2025, is projected to experience robust growth, exhibiting a Compound Annual Growth Rate (CAGR) of 7.38% from 2025 to 2033. This expansion is driven by several key factors. The increasing awareness of the health benefits associated with natural vitamin E, particularly its antioxidant and anti-inflammatory properties, fuels demand across various applications. The rising prevalence of chronic diseases, coupled with a growing preference for natural and clean-label ingredients in food and personal care products, further stimulates market growth. The dietary supplements segment currently dominates the market, benefiting from the escalating demand for nutritional supplements to support overall well-being. However, significant growth is also anticipated in the fortified/functional food and beverage sector, as manufacturers increasingly incorporate natural vitamin E to enhance product value and appeal to health-conscious consumers. The burgeoning beauty and personal care industry also presents a lucrative opportunity, with natural vitamin E finding increasing use in skincare and haircare products.
Leading players like Merck KGaA (Sigma Aldrich), BASF SE, and Archer Daniels Midland Company are actively shaping the market landscape through strategic expansions, product innovations, and acquisitions. Geographic growth is expected to be diverse, with North America and Europe holding substantial market shares due to high consumer awareness and established distribution networks. However, Asia Pacific, particularly China and India, presents a significant growth potential driven by increasing disposable incomes, rising health consciousness, and expanding industrial applications in the food and beverage industries. While challenges such as price fluctuations in raw materials and stringent regulatory requirements exist, the overall market outlook remains positive, indicating considerable potential for investment and expansion throughout the forecast period.
Natural Vitamin E Market: A Comprehensive Report (2019-2033)
This comprehensive report provides a detailed analysis of the Natural Vitamin E Market, encompassing market dynamics, growth trends, regional analysis, product landscape, key players, and future outlook. The study period covers 2019-2033, with 2025 as the base year and a forecast period of 2025-2033. The report segments the market by product type (Tocopherols, Tocotrienols) and application (Dietary Supplements, Fortified/Functional Food and Beverage, Beauty and Personal Care Products, Pharmaceuticals, Animal Feed), offering granular insights into each segment's performance and growth potential. The global market size is expected to reach xx Million units by 2033.
Natural Vitamin E Market Dynamics & Structure
The Natural Vitamin E market is characterized by a moderately concentrated landscape with key players like Merck KGaA (Sigma Aldrich), Kuala Lumpur Kepong Berhad (Davos Life Science), Archer Daniels Midland Company, and BASF SE holding significant market share. Technological innovations in extraction and purification methods, coupled with increasing demand for natural and clean-label ingredients, are major growth drivers. Stringent regulatory frameworks governing food and supplement safety influence market dynamics. The market also witnesses competitive pressure from synthetic Vitamin E substitutes. The prevalence of health-conscious consumers and growing demand for functional foods and beverages fuels market expansion. M&A activity, exemplified by Kensing LLC's acquisition of Vitae Naturals, reflects the industry's consolidation trend.
- Market Concentration: Moderately concentrated, with top 5 players holding approximately xx% market share in 2024.
- Technological Innovation: Focus on sustainable and efficient extraction methods, leading to improved product quality and reduced costs.
- Regulatory Landscape: Stringent regulations regarding purity and labeling influence market dynamics. Compliance costs can act as a barrier for smaller players.
- Competitive Substitutes: Synthetic Vitamin E poses competitive pressure due to lower cost, but consumer preference for natural products mitigates this to some extent.
- End-User Demographics: Growing health-conscious population and rising disposable incomes drive demand across various applications.
- M&A Trends: Increasing consolidation through acquisitions and mergers to enhance market share and product portfolio. Approximately xx M&A deals were recorded between 2019 and 2024.
Natural Vitamin E Market Growth Trends & Insights
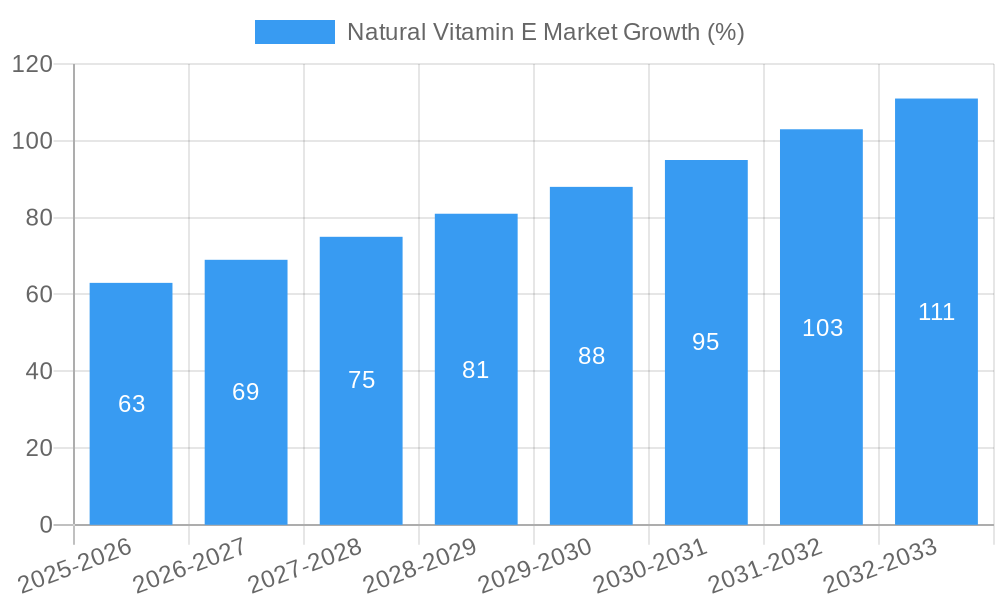
The Natural Vitamin E market has experienced robust growth in recent years, driven by increasing consumer awareness of the health benefits of antioxidants and the growing popularity of dietary supplements and functional foods. The market size, currently valued at xx Million units in 2025, is projected to experience a CAGR of xx% during the forecast period (2025-2033). This growth is fueled by several factors, including the increasing prevalence of chronic diseases, a shift towards preventative healthcare, and a growing preference for natural and organic products. Technological advancements in extraction and purification methods have improved the quality and affordability of natural Vitamin E, further stimulating market expansion. Changing consumer behavior, with increasing demand for convenience and personalization, is driving product innovation in formats like capsules, gummies, and functional beverages. Market penetration in developing economies presents significant growth opportunities.
Dominant Regions, Countries, or Segments in Natural Vitamin E Market
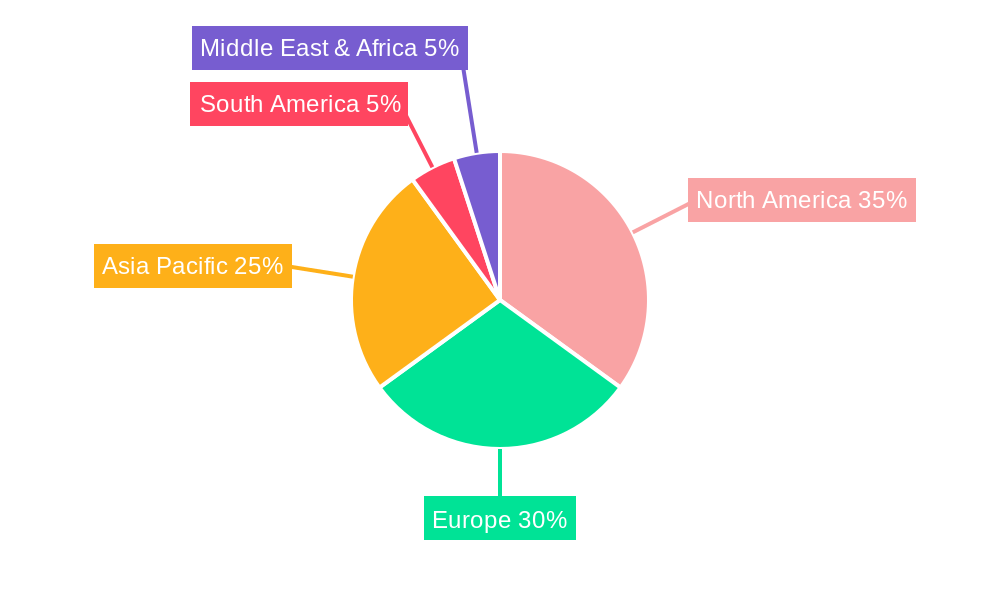
North America and Europe currently dominate the Natural Vitamin E market, driven by high consumer awareness of health benefits and strong regulatory frameworks. However, Asia-Pacific is expected to witness significant growth due to rapid economic development, rising disposable incomes, and increasing health consciousness. Within product types, Tocopherols currently hold the largest market share, but Tocotrienols are experiencing rapid growth driven by their unique health benefits. The dietary supplements segment is the largest application area, followed by fortified/functional food and beverages.
- North America: High consumer awareness of health benefits, strong regulatory framework, and well-established distribution channels contribute to its dominance.
- Europe: Similar factors as North America drive market growth, with a focus on clean-label products.
- Asia-Pacific: Rapid economic growth, rising disposable incomes, and increasing health consciousness fuel significant growth potential.
- Product Type: Tocopherols dominate due to higher availability and lower cost. However, Tocotrienols demonstrate the highest growth rate.
- Application: Dietary supplements hold the largest market share, followed by fortified food and beverages. Beauty and personal care applications are also witnessing substantial growth.
Natural Vitamin E Market Product Landscape
The Natural Vitamin E product landscape is characterized by a wide range of formulations, including oils, powders, and capsules, tailored to various applications. Technological advancements in extraction methods have led to higher purity and potency, resulting in enhanced product efficacy. Companies are focusing on developing unique selling propositions based on sustainable sourcing, organic certification, and improved bioavailability. Innovative product formats, such as functional foods and beverages incorporating natural Vitamin E, are gaining popularity.
Key Drivers, Barriers & Challenges in Natural Vitamin E Market
Key Drivers:
- Growing consumer awareness of health benefits of antioxidants.
- Increasing demand for natural and organic ingredients.
- Rise in prevalence of chronic diseases.
- Expanding applications in food, beverages, cosmetics, and pharmaceuticals.
Key Barriers & Challenges:
- Fluctuations in raw material prices.
- Stringent regulatory requirements for food and supplements.
- Competition from synthetic Vitamin E.
- Supply chain disruptions impacting availability and pricing. Estimated impact on market growth: xx% in 2024 due to supply chain issues.
Emerging Opportunities in Natural Vitamin E Market
- Growing demand for personalized nutrition and functional foods.
- Expansion into untapped markets in developing economies.
- Development of novel delivery systems for enhanced bioavailability.
- Growing interest in Tocotrienols due to their unique health benefits.
Growth Accelerators in the Natural Vitamin E Market Industry
Strategic partnerships and collaborations are driving market growth. Technological breakthroughs, such as the development of sustainable extraction methods and improved purification technologies, are enhancing product quality and reducing costs. Expansion into new geographical markets and applications, such as animal feed and cosmetics, are also fueling market expansion.
Key Players Shaping the Natural Vitamin E Market Market
- Merck KGaA (Sigma Aldrich)
- Kuala Lumpur Kepong Berhad (Davos Life Science)
- Archer Daniels Midland Company
- Excel Vite Inc
- BASF SE
- Brenntag AG
- Orah Nutrichem Pvt Ltd
- One Rock Capital Partners LLC (Kensing LLC)
- Parachem Fine & Specialty Chemicals
- Koninklijke Dsm N V
Notable Milestones in Natural Vitamin E Market Sector
- June 2022: Kensing LLC acquires Vitae Naturals, expanding its natural Vitamin E portfolio.
- February 2022: Orah Nutrichem Pvt Ltd launches ORAH Vit E, a tocotrienol-based antioxidant.
- December 2021: Kensing partners with Azelis for improved distribution in Europe, Middle East, and Africa.
- June 2021: One Rock Capital acquires BASF's specialty chemical facility, boosting natural Vitamin E production capacity.
In-Depth Natural Vitamin E Market Market Outlook
The Natural Vitamin E market is poised for continued growth driven by increasing consumer demand for natural and healthy products. Strategic partnerships, technological advancements, and market expansion into new geographical regions and applications will further propel market growth. The focus on sustainable sourcing and environmentally friendly production processes will also become increasingly important in shaping the future of the market. The long-term outlook for the Natural Vitamin E market is highly positive, with significant opportunities for companies that can successfully innovate, adapt, and meet the evolving needs of consumers.
Natural Vitamin E Market Segmentation
-
1. Product Type
- 1.1. Tocopherols
- 1.2. Tocotrienols
-
2. Application
- 2.1. Dietary Supplements
- 2.2. Fortified/Functional Food and Beverage
- 2.3. Beauty and Personal Care Products
- 2.4. Pharmaceuticals
- 2.5. Animal Feed
Natural Vitamin E Market Segmentation By Geography
-
1. North America
- 1.1. United States
- 1.2. Canada
- 1.3. Mexico
- 1.4. Rest of North America
-
2. Europe
- 2.1. Spain
- 2.2. United Kingdom
- 2.3. Germany
- 2.4. France
- 2.5. Italy
- 2.6. Rest of Europe
-
3. Asia Pacific
- 3.1. China
- 3.2. Japan
- 3.3. India
- 3.4. Australia
- 3.5. Rest of Asia Pacific
-
4. South America
- 4.1. Brazil
- 4.2. Argentina
- 4.3. Rest of South America
-
5. Middle East and Africa
- 5.1. Saudi Arabia
- 5.2. South Africa
- 5.3. Rest of Middle East and Africa
Natural Vitamin E Market REPORT HIGHLIGHTS
| Aspects | Details |
|---|---|
| Study Period | 2019-2033 |
| Base Year | 2024 |
| Estimated Year | 2025 |
| Forecast Period | 2025-2033 |
| Historical Period | 2019-2024 |
| Growth Rate | CAGR of 7.38% from 2019-2033 |
| Segmentation |
|
Table of Contents
- 1. Introduction
- 1.1. Research Scope
- 1.2. Market Segmentation
- 1.3. Research Methodology
- 1.4. Definitions and Assumptions
- 2. Executive Summary
- 2.1. Introduction
- 3. Market Dynamics
- 3.1. Introduction
- 3.2. Market Drivers
- 3.2.1. Awareness of Health Benefits Associated with Tocotrienol; Escalating Demand for Anti-Aging Products Containing Tocotrienol
- 3.3. Market Restrains
- 3.3.1. Availability of Substitutes
- 3.4. Market Trends
- 3.4.1. Substantial Growth of Global Health and Wellness Industry
- 4. Market Factor Analysis
- 4.1. Porters Five Forces
- 4.2. Supply/Value Chain
- 4.3. PESTEL analysis
- 4.4. Market Entropy
- 4.5. Patent/Trademark Analysis
- 5. Global Natural Vitamin E Market Analysis, Insights and Forecast, 2019-2031
- 5.1. Market Analysis, Insights and Forecast - by Product Type
- 5.1.1. Tocopherols
- 5.1.2. Tocotrienols
- 5.2. Market Analysis, Insights and Forecast - by Application
- 5.2.1. Dietary Supplements
- 5.2.2. Fortified/Functional Food and Beverage
- 5.2.3. Beauty and Personal Care Products
- 5.2.4. Pharmaceuticals
- 5.2.5. Animal Feed
- 5.3. Market Analysis, Insights and Forecast - by Region
- 5.3.1. North America
- 5.3.2. Europe
- 5.3.3. Asia Pacific
- 5.3.4. South America
- 5.3.5. Middle East and Africa
- 5.1. Market Analysis, Insights and Forecast - by Product Type
- 6. North America Natural Vitamin E Market Analysis, Insights and Forecast, 2019-2031
- 6.1. Market Analysis, Insights and Forecast - by Product Type
- 6.1.1. Tocopherols
- 6.1.2. Tocotrienols
- 6.2. Market Analysis, Insights and Forecast - by Application
- 6.2.1. Dietary Supplements
- 6.2.2. Fortified/Functional Food and Beverage
- 6.2.3. Beauty and Personal Care Products
- 6.2.4. Pharmaceuticals
- 6.2.5. Animal Feed
- 6.1. Market Analysis, Insights and Forecast - by Product Type
- 7. Europe Natural Vitamin E Market Analysis, Insights and Forecast, 2019-2031
- 7.1. Market Analysis, Insights and Forecast - by Product Type
- 7.1.1. Tocopherols
- 7.1.2. Tocotrienols
- 7.2. Market Analysis, Insights and Forecast - by Application
- 7.2.1. Dietary Supplements
- 7.2.2. Fortified/Functional Food and Beverage
- 7.2.3. Beauty and Personal Care Products
- 7.2.4. Pharmaceuticals
- 7.2.5. Animal Feed
- 7.1. Market Analysis, Insights and Forecast - by Product Type
- 8. Asia Pacific Natural Vitamin E Market Analysis, Insights and Forecast, 2019-2031
- 8.1. Market Analysis, Insights and Forecast - by Product Type
- 8.1.1. Tocopherols
- 8.1.2. Tocotrienols
- 8.2. Market Analysis, Insights and Forecast - by Application
- 8.2.1. Dietary Supplements
- 8.2.2. Fortified/Functional Food and Beverage
- 8.2.3. Beauty and Personal Care Products
- 8.2.4. Pharmaceuticals
- 8.2.5. Animal Feed
- 8.1. Market Analysis, Insights and Forecast - by Product Type
- 9. South America Natural Vitamin E Market Analysis, Insights and Forecast, 2019-2031
- 9.1. Market Analysis, Insights and Forecast - by Product Type
- 9.1.1. Tocopherols
- 9.1.2. Tocotrienols
- 9.2. Market Analysis, Insights and Forecast - by Application
- 9.2.1. Dietary Supplements
- 9.2.2. Fortified/Functional Food and Beverage
- 9.2.3. Beauty and Personal Care Products
- 9.2.4. Pharmaceuticals
- 9.2.5. Animal Feed
- 9.1. Market Analysis, Insights and Forecast - by Product Type
- 10. Middle East and Africa Natural Vitamin E Market Analysis, Insights and Forecast, 2019-2031
- 10.1. Market Analysis, Insights and Forecast - by Product Type
- 10.1.1. Tocopherols
- 10.1.2. Tocotrienols
- 10.2. Market Analysis, Insights and Forecast - by Application
- 10.2.1. Dietary Supplements
- 10.2.2. Fortified/Functional Food and Beverage
- 10.2.3. Beauty and Personal Care Products
- 10.2.4. Pharmaceuticals
- 10.2.5. Animal Feed
- 10.1. Market Analysis, Insights and Forecast - by Product Type
- 11. North America Natural Vitamin E Market Analysis, Insights and Forecast, 2019-2031
- 11.1. Market Analysis, Insights and Forecast - By Country/Sub-region
- 11.1.1 United States
- 11.1.2 Canada
- 11.1.3 Mexico
- 11.1.4 Rest of North America
- 12. Europe Natural Vitamin E Market Analysis, Insights and Forecast, 2019-2031
- 12.1. Market Analysis, Insights and Forecast - By Country/Sub-region
- 12.1.1 Spain
- 12.1.2 United Kingdom
- 12.1.3 Germany
- 12.1.4 France
- 12.1.5 Italy
- 12.1.6 Rest of Europe
- 13. Asia Pacific Natural Vitamin E Market Analysis, Insights and Forecast, 2019-2031
- 13.1. Market Analysis, Insights and Forecast - By Country/Sub-region
- 13.1.1 China
- 13.1.2 Japan
- 13.1.3 India
- 13.1.4 Australia
- 13.1.5 Rest of Asia Pacific
- 14. South America Natural Vitamin E Market Analysis, Insights and Forecast, 2019-2031
- 14.1. Market Analysis, Insights and Forecast - By Country/Sub-region
- 14.1.1 Brazil
- 14.1.2 Argentina
- 14.1.3 Rest of South America
- 15. Middle East & Africa Natural Vitamin E Market Analysis, Insights and Forecast, 2019-2031
- 15.1. Market Analysis, Insights and Forecast - By Country/Sub-region
- 15.1.1 UAE
- 15.1.2 South Africa
- 15.1.3 Saudi Arabia
- 15.1.4 Rest of MEA
- 16. Competitive Analysis
- 16.1. Global Market Share Analysis 2024
- 16.2. Company Profiles
- 16.2.1 Merck KGaA (Sigma Aldrich)
- 16.2.1.1. Overview
- 16.2.1.2. Products
- 16.2.1.3. SWOT Analysis
- 16.2.1.4. Recent Developments
- 16.2.1.5. Financials (Based on Availability)
- 16.2.2 Kuala Lumpur Kepong Berhad (Davos Life Science)
- 16.2.2.1. Overview
- 16.2.2.2. Products
- 16.2.2.3. SWOT Analysis
- 16.2.2.4. Recent Developments
- 16.2.2.5. Financials (Based on Availability)
- 16.2.3 Archer Daniels Midland Company
- 16.2.3.1. Overview
- 16.2.3.2. Products
- 16.2.3.3. SWOT Analysis
- 16.2.3.4. Recent Developments
- 16.2.3.5. Financials (Based on Availability)
- 16.2.4 Excel Vite Inc
- 16.2.4.1. Overview
- 16.2.4.2. Products
- 16.2.4.3. SWOT Analysis
- 16.2.4.4. Recent Developments
- 16.2.4.5. Financials (Based on Availability)
- 16.2.5 BASF SE
- 16.2.5.1. Overview
- 16.2.5.2. Products
- 16.2.5.3. SWOT Analysis
- 16.2.5.4. Recent Developments
- 16.2.5.5. Financials (Based on Availability)
- 16.2.6 Brenntag AG
- 16.2.6.1. Overview
- 16.2.6.2. Products
- 16.2.6.3. SWOT Analysis
- 16.2.6.4. Recent Developments
- 16.2.6.5. Financials (Based on Availability)
- 16.2.7 Orah Nutrichem Pvt Ltd
- 16.2.7.1. Overview
- 16.2.7.2. Products
- 16.2.7.3. SWOT Analysis
- 16.2.7.4. Recent Developments
- 16.2.7.5. Financials (Based on Availability)
- 16.2.8 One Rock Capital Partners LLC (Kensing LLC)*List Not Exhaustive
- 16.2.8.1. Overview
- 16.2.8.2. Products
- 16.2.8.3. SWOT Analysis
- 16.2.8.4. Recent Developments
- 16.2.8.5. Financials (Based on Availability)
- 16.2.9 Parachem Fine & Specialty Chemicals
- 16.2.9.1. Overview
- 16.2.9.2. Products
- 16.2.9.3. SWOT Analysis
- 16.2.9.4. Recent Developments
- 16.2.9.5. Financials (Based on Availability)
- 16.2.10 Koninklijke Dsm N V
- 16.2.10.1. Overview
- 16.2.10.2. Products
- 16.2.10.3. SWOT Analysis
- 16.2.10.4. Recent Developments
- 16.2.10.5. Financials (Based on Availability)
- 16.2.1 Merck KGaA (Sigma Aldrich)
List of Figures
- Figure 1: Global Natural Vitamin E Market Revenue Breakdown (Million, %) by Region 2024 & 2032
- Figure 2: North America Natural Vitamin E Market Revenue (Million), by Country 2024 & 2032
- Figure 3: North America Natural Vitamin E Market Revenue Share (%), by Country 2024 & 2032
- Figure 4: Europe Natural Vitamin E Market Revenue (Million), by Country 2024 & 2032
- Figure 5: Europe Natural Vitamin E Market Revenue Share (%), by Country 2024 & 2032
- Figure 6: Asia Pacific Natural Vitamin E Market Revenue (Million), by Country 2024 & 2032
- Figure 7: Asia Pacific Natural Vitamin E Market Revenue Share (%), by Country 2024 & 2032
- Figure 8: South America Natural Vitamin E Market Revenue (Million), by Country 2024 & 2032
- Figure 9: South America Natural Vitamin E Market Revenue Share (%), by Country 2024 & 2032
- Figure 10: Middle East & Africa Natural Vitamin E Market Revenue (Million), by Country 2024 & 2032
- Figure 11: Middle East & Africa Natural Vitamin E Market Revenue Share (%), by Country 2024 & 2032
- Figure 12: North America Natural Vitamin E Market Revenue (Million), by Product Type 2024 & 2032
- Figure 13: North America Natural Vitamin E Market Revenue Share (%), by Product Type 2024 & 2032
- Figure 14: North America Natural Vitamin E Market Revenue (Million), by Application 2024 & 2032
- Figure 15: North America Natural Vitamin E Market Revenue Share (%), by Application 2024 & 2032
- Figure 16: North America Natural Vitamin E Market Revenue (Million), by Country 2024 & 2032
- Figure 17: North America Natural Vitamin E Market Revenue Share (%), by Country 2024 & 2032
- Figure 18: Europe Natural Vitamin E Market Revenue (Million), by Product Type 2024 & 2032
- Figure 19: Europe Natural Vitamin E Market Revenue Share (%), by Product Type 2024 & 2032
- Figure 20: Europe Natural Vitamin E Market Revenue (Million), by Application 2024 & 2032
- Figure 21: Europe Natural Vitamin E Market Revenue Share (%), by Application 2024 & 2032
- Figure 22: Europe Natural Vitamin E Market Revenue (Million), by Country 2024 & 2032
- Figure 23: Europe Natural Vitamin E Market Revenue Share (%), by Country 2024 & 2032
- Figure 24: Asia Pacific Natural Vitamin E Market Revenue (Million), by Product Type 2024 & 2032
- Figure 25: Asia Pacific Natural Vitamin E Market Revenue Share (%), by Product Type 2024 & 2032
- Figure 26: Asia Pacific Natural Vitamin E Market Revenue (Million), by Application 2024 & 2032
- Figure 27: Asia Pacific Natural Vitamin E Market Revenue Share (%), by Application 2024 & 2032
- Figure 28: Asia Pacific Natural Vitamin E Market Revenue (Million), by Country 2024 & 2032
- Figure 29: Asia Pacific Natural Vitamin E Market Revenue Share (%), by Country 2024 & 2032
- Figure 30: South America Natural Vitamin E Market Revenue (Million), by Product Type 2024 & 2032
- Figure 31: South America Natural Vitamin E Market Revenue Share (%), by Product Type 2024 & 2032
- Figure 32: South America Natural Vitamin E Market Revenue (Million), by Application 2024 & 2032
- Figure 33: South America Natural Vitamin E Market Revenue Share (%), by Application 2024 & 2032
- Figure 34: South America Natural Vitamin E Market Revenue (Million), by Country 2024 & 2032
- Figure 35: South America Natural Vitamin E Market Revenue Share (%), by Country 2024 & 2032
- Figure 36: Middle East and Africa Natural Vitamin E Market Revenue (Million), by Product Type 2024 & 2032
- Figure 37: Middle East and Africa Natural Vitamin E Market Revenue Share (%), by Product Type 2024 & 2032
- Figure 38: Middle East and Africa Natural Vitamin E Market Revenue (Million), by Application 2024 & 2032
- Figure 39: Middle East and Africa Natural Vitamin E Market Revenue Share (%), by Application 2024 & 2032
- Figure 40: Middle East and Africa Natural Vitamin E Market Revenue (Million), by Country 2024 & 2032
- Figure 41: Middle East and Africa Natural Vitamin E Market Revenue Share (%), by Country 2024 & 2032
List of Tables
- Table 1: Global Natural Vitamin E Market Revenue Million Forecast, by Region 2019 & 2032
- Table 2: Global Natural Vitamin E Market Revenue Million Forecast, by Product Type 2019 & 2032
- Table 3: Global Natural Vitamin E Market Revenue Million Forecast, by Application 2019 & 2032
- Table 4: Global Natural Vitamin E Market Revenue Million Forecast, by Region 2019 & 2032
- Table 5: Global Natural Vitamin E Market Revenue Million Forecast, by Country 2019 & 2032
- Table 6: United States Natural Vitamin E Market Revenue (Million) Forecast, by Application 2019 & 2032
- Table 7: Canada Natural Vitamin E Market Revenue (Million) Forecast, by Application 2019 & 2032
- Table 8: Mexico Natural Vitamin E Market Revenue (Million) Forecast, by Application 2019 & 2032
- Table 9: Rest of North America Natural Vitamin E Market Revenue (Million) Forecast, by Application 2019 & 2032
- Table 10: Global Natural Vitamin E Market Revenue Million Forecast, by Country 2019 & 2032
- Table 11: Spain Natural Vitamin E Market Revenue (Million) Forecast, by Application 2019 & 2032
- Table 12: United Kingdom Natural Vitamin E Market Revenue (Million) Forecast, by Application 2019 & 2032
- Table 13: Germany Natural Vitamin E Market Revenue (Million) Forecast, by Application 2019 & 2032
- Table 14: France Natural Vitamin E Market Revenue (Million) Forecast, by Application 2019 & 2032
- Table 15: Italy Natural Vitamin E Market Revenue (Million) Forecast, by Application 2019 & 2032
- Table 16: Rest of Europe Natural Vitamin E Market Revenue (Million) Forecast, by Application 2019 & 2032
- Table 17: Global Natural Vitamin E Market Revenue Million Forecast, by Country 2019 & 2032
- Table 18: China Natural Vitamin E Market Revenue (Million) Forecast, by Application 2019 & 2032
- Table 19: Japan Natural Vitamin E Market Revenue (Million) Forecast, by Application 2019 & 2032
- Table 20: India Natural Vitamin E Market Revenue (Million) Forecast, by Application 2019 & 2032
- Table 21: Australia Natural Vitamin E Market Revenue (Million) Forecast, by Application 2019 & 2032
- Table 22: Rest of Asia Pacific Natural Vitamin E Market Revenue (Million) Forecast, by Application 2019 & 2032
- Table 23: Global Natural Vitamin E Market Revenue Million Forecast, by Country 2019 & 2032
- Table 24: Brazil Natural Vitamin E Market Revenue (Million) Forecast, by Application 2019 & 2032
- Table 25: Argentina Natural Vitamin E Market Revenue (Million) Forecast, by Application 2019 & 2032
- Table 26: Rest of South America Natural Vitamin E Market Revenue (Million) Forecast, by Application 2019 & 2032
- Table 27: Global Natural Vitamin E Market Revenue Million Forecast, by Country 2019 & 2032
- Table 28: UAE Natural Vitamin E Market Revenue (Million) Forecast, by Application 2019 & 2032
- Table 29: South Africa Natural Vitamin E Market Revenue (Million) Forecast, by Application 2019 & 2032
- Table 30: Saudi Arabia Natural Vitamin E Market Revenue (Million) Forecast, by Application 2019 & 2032
- Table 31: Rest of MEA Natural Vitamin E Market Revenue (Million) Forecast, by Application 2019 & 2032
- Table 32: Global Natural Vitamin E Market Revenue Million Forecast, by Product Type 2019 & 2032
- Table 33: Global Natural Vitamin E Market Revenue Million Forecast, by Application 2019 & 2032
- Table 34: Global Natural Vitamin E Market Revenue Million Forecast, by Country 2019 & 2032
- Table 35: United States Natural Vitamin E Market Revenue (Million) Forecast, by Application 2019 & 2032
- Table 36: Canada Natural Vitamin E Market Revenue (Million) Forecast, by Application 2019 & 2032
- Table 37: Mexico Natural Vitamin E Market Revenue (Million) Forecast, by Application 2019 & 2032
- Table 38: Rest of North America Natural Vitamin E Market Revenue (Million) Forecast, by Application 2019 & 2032
- Table 39: Global Natural Vitamin E Market Revenue Million Forecast, by Product Type 2019 & 2032
- Table 40: Global Natural Vitamin E Market Revenue Million Forecast, by Application 2019 & 2032
- Table 41: Global Natural Vitamin E Market Revenue Million Forecast, by Country 2019 & 2032
- Table 42: Spain Natural Vitamin E Market Revenue (Million) Forecast, by Application 2019 & 2032
- Table 43: United Kingdom Natural Vitamin E Market Revenue (Million) Forecast, by Application 2019 & 2032
- Table 44: Germany Natural Vitamin E Market Revenue (Million) Forecast, by Application 2019 & 2032
- Table 45: France Natural Vitamin E Market Revenue (Million) Forecast, by Application 2019 & 2032
- Table 46: Italy Natural Vitamin E Market Revenue (Million) Forecast, by Application 2019 & 2032
- Table 47: Rest of Europe Natural Vitamin E Market Revenue (Million) Forecast, by Application 2019 & 2032
- Table 48: Global Natural Vitamin E Market Revenue Million Forecast, by Product Type 2019 & 2032
- Table 49: Global Natural Vitamin E Market Revenue Million Forecast, by Application 2019 & 2032
- Table 50: Global Natural Vitamin E Market Revenue Million Forecast, by Country 2019 & 2032
- Table 51: China Natural Vitamin E Market Revenue (Million) Forecast, by Application 2019 & 2032
- Table 52: Japan Natural Vitamin E Market Revenue (Million) Forecast, by Application 2019 & 2032
- Table 53: India Natural Vitamin E Market Revenue (Million) Forecast, by Application 2019 & 2032
- Table 54: Australia Natural Vitamin E Market Revenue (Million) Forecast, by Application 2019 & 2032
- Table 55: Rest of Asia Pacific Natural Vitamin E Market Revenue (Million) Forecast, by Application 2019 & 2032
- Table 56: Global Natural Vitamin E Market Revenue Million Forecast, by Product Type 2019 & 2032
- Table 57: Global Natural Vitamin E Market Revenue Million Forecast, by Application 2019 & 2032
- Table 58: Global Natural Vitamin E Market Revenue Million Forecast, by Country 2019 & 2032
- Table 59: Brazil Natural Vitamin E Market Revenue (Million) Forecast, by Application 2019 & 2032
- Table 60: Argentina Natural Vitamin E Market Revenue (Million) Forecast, by Application 2019 & 2032
- Table 61: Rest of South America Natural Vitamin E Market Revenue (Million) Forecast, by Application 2019 & 2032
- Table 62: Global Natural Vitamin E Market Revenue Million Forecast, by Product Type 2019 & 2032
- Table 63: Global Natural Vitamin E Market Revenue Million Forecast, by Application 2019 & 2032
- Table 64: Global Natural Vitamin E Market Revenue Million Forecast, by Country 2019 & 2032
- Table 65: Saudi Arabia Natural Vitamin E Market Revenue (Million) Forecast, by Application 2019 & 2032
- Table 66: South Africa Natural Vitamin E Market Revenue (Million) Forecast, by Application 2019 & 2032
- Table 67: Rest of Middle East and Africa Natural Vitamin E Market Revenue (Million) Forecast, by Application 2019 & 2032
Frequently Asked Questions
1. What is the projected Compound Annual Growth Rate (CAGR) of the Natural Vitamin E Market?
The projected CAGR is approximately 7.38%.
2. Which companies are prominent players in the Natural Vitamin E Market?
Key companies in the market include Merck KGaA (Sigma Aldrich), Kuala Lumpur Kepong Berhad (Davos Life Science), Archer Daniels Midland Company, Excel Vite Inc, BASF SE, Brenntag AG, Orah Nutrichem Pvt Ltd, One Rock Capital Partners LLC (Kensing LLC)*List Not Exhaustive, Parachem Fine & Specialty Chemicals, Koninklijke Dsm N V.
3. What are the main segments of the Natural Vitamin E Market?
The market segments include Product Type, Application.
4. Can you provide details about the market size?
The market size is estimated to be USD 0.85 Million as of 2022.
5. What are some drivers contributing to market growth?
Awareness of Health Benefits Associated with Tocotrienol; Escalating Demand for Anti-Aging Products Containing Tocotrienol.
6. What are the notable trends driving market growth?
Substantial Growth of Global Health and Wellness Industry.
7. Are there any restraints impacting market growth?
Availability of Substitutes.
8. Can you provide examples of recent developments in the market?
June 2022: Kensing, LLC, a renowned manufacturer specializing in natural vitamin E, plant sterols, and high-purity surfactants, and a portfolio company of One Rock Capital Partners, LLC, has recently completed the acquisition of Vitae Naturals. Vitae Naturals, a prominent producer of plant sterol esters and non-GMO natural vitamin E derivatives, caters to a diverse range of industries, including food, nutrition, and skincare.
9. What pricing options are available for accessing the report?
Pricing options include single-user, multi-user, and enterprise licenses priced at USD 4750, USD 5250, and USD 8750 respectively.
10. Is the market size provided in terms of value or volume?
The market size is provided in terms of value, measured in Million.
11. Are there any specific market keywords associated with the report?
Yes, the market keyword associated with the report is "Natural Vitamin E Market," which aids in identifying and referencing the specific market segment covered.
12. How do I determine which pricing option suits my needs best?
The pricing options vary based on user requirements and access needs. Individual users may opt for single-user licenses, while businesses requiring broader access may choose multi-user or enterprise licenses for cost-effective access to the report.
13. Are there any additional resources or data provided in the Natural Vitamin E Market report?
While the report offers comprehensive insights, it's advisable to review the specific contents or supplementary materials provided to ascertain if additional resources or data are available.
14. How can I stay updated on further developments or reports in the Natural Vitamin E Market?
To stay informed about further developments, trends, and reports in the Natural Vitamin E Market, consider subscribing to industry newsletters, following relevant companies and organizations, or regularly checking reputable industry news sources and publications.
Methodology
Step 1 - Identification of Relevant Samples Size from Population Database


Step 2 - Approaches for Defining Global Market Size (Value, Volume* & Price*)

Note*: In applicable scenarios
Step 3 - Data Sources
Primary Research
- Web Analytics
- Survey Reports
- Research Institute
- Latest Research Reports
- Opinion Leaders
Secondary Research
- Annual Reports
- White Paper
- Latest Press Release
- Industry Association
- Paid Database
- Investor Presentations

Step 4 - Data Triangulation
Involves using different sources of information in order to increase the validity of a study
These sources are likely to be stakeholders in a program - participants, other researchers, program staff, other community members, and so on.
Then we put all data in single framework & apply various statistical tools to find out the dynamic on the market.
During the analysis stage, feedback from the stakeholder groups would be compared to determine areas of agreement as well as areas of divergence


