
Key Insights
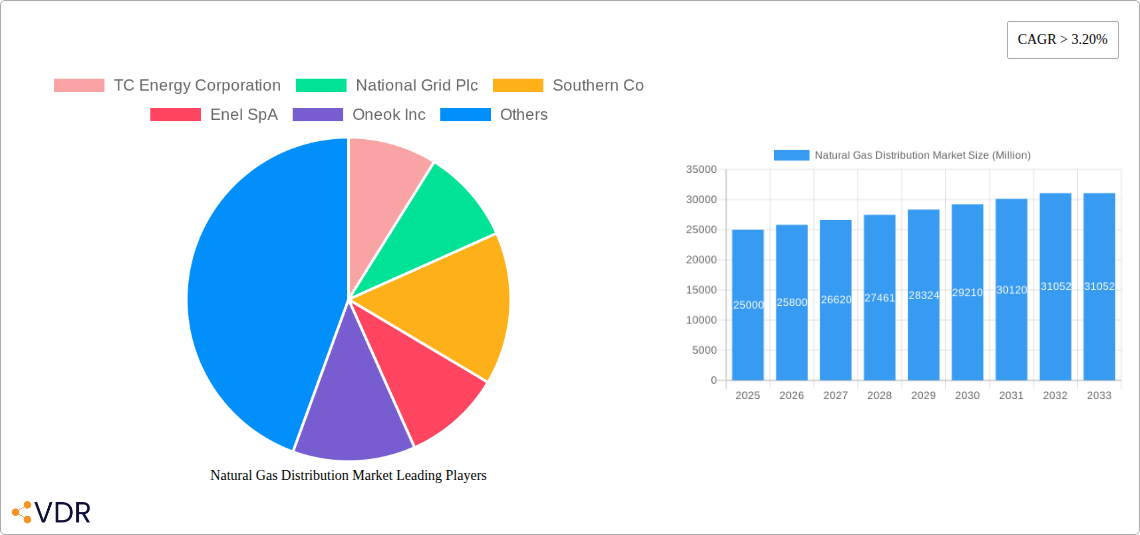
The global natural gas distribution market is experiencing robust growth, driven by increasing energy demand, particularly in rapidly developing economies across Asia-Pacific and the Middle East. A compound annual growth rate (CAGR) exceeding 3.20% from 2025 to 2033 signifies a significant expansion of this market, estimated to be valued at several billion dollars in 2025. Key drivers include the rising adoption of natural gas as a cleaner alternative to traditional fossil fuels for residential, commercial, and industrial applications. The industrial sector, in particular, is a major consumer, fueled by its use in manufacturing processes and power generation. Government initiatives promoting energy diversification and reduced carbon emissions are also bolstering market growth. The expansion of pipeline infrastructure to reach previously underserved regions further contributes to this expansion. While challenges exist, including fluctuating natural gas prices and the need for substantial investments in infrastructure modernization and maintenance, the long-term outlook remains positive, with diverse segments like compressed natural gas (CNG) and pipeline natural gas (PNG) driving further segmentation and specialization within the market.
The market segmentation reveals strong growth potential across various end-user industries. The residential and commercial building sectors are seeing increased demand for natural gas heating and cooking solutions, while the transportation sector's uptake of CNG is contributing significantly. Geographical analysis points to North America and Europe as mature markets, with significant growth opportunities predicted in the Asia-Pacific region, fueled by industrialization and population growth. Major players like TC Energy Corporation, National Grid Plc, and others are investing heavily in expanding their infrastructure and services to capitalize on this growth, leading to increased competition and innovation. The forecast period of 2025-2033 presents a window for strategic market entrants and further consolidation among existing players. The market's sustained growth is expected to lead to further innovation in distribution technologies and enhance efficiency in the supply chain.
Natural Gas Distribution Market Report: 2019-2033 Forecast
This comprehensive report provides an in-depth analysis of the global Natural Gas Distribution Market, encompassing its parent market (Energy Sector) and child markets (Compressed Natural Gas (CNG) and Pipeline Natural Gas (PNG) distribution). The study period covers 2019-2033, with a base year of 2025 and a forecast period of 2025-2033. This report is crucial for industry professionals, investors, and strategists seeking a clear understanding of this dynamic market. The market size is projected to reach xx Million by 2033.
Natural Gas Distribution Market Dynamics & Structure
This section analyzes the market structure, focusing on concentration levels, innovation drivers, regulatory landscapes, and competitive dynamics. We examine the influence of substitute products, end-user demographics (Industrial, Power Sector, Residential & Commercial Buildings, Transportation), and the impact of mergers and acquisitions (M&A) activity. Quantitative data, including market share breakdowns and M&A deal volume trends (xx deals in 2024), are presented alongside qualitative assessments of innovation barriers.
- Market Concentration: The market exhibits a moderately concentrated structure, with a few major players holding significant shares. The Herfindahl-Hirschman Index (HHI) is estimated at xx in 2025.
- Technological Innovation: The sector is driven by advancements in pipeline technology, smart metering, and digitalization for optimized distribution and reduced losses. However, high initial investment costs pose a significant barrier.
- Regulatory Framework: Stringent environmental regulations and safety standards influence market dynamics. Changes in government policies regarding carbon emissions directly impact investment decisions and expansion plans.
- Competitive Substitutes: Renewable energy sources (solar, wind) and electricity pose increasing competition, particularly in the power sector and transportation segments.
- M&A Activity: Consolidation is expected to continue, driven by the need for economies of scale and expansion into new geographical markets.
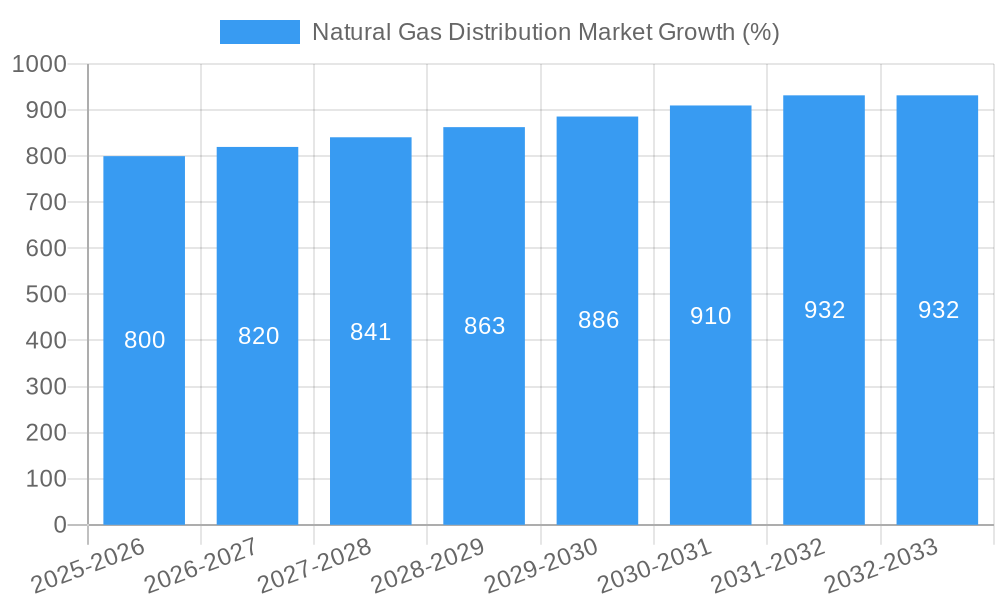
Natural Gas Distribution Market Growth Trends & Insights
This section provides a detailed analysis of market size evolution, adoption rates across different end-user segments, technological disruptions, and shifts in consumer behavior from 2019 to 2033. Key metrics like Compound Annual Growth Rate (CAGR) and market penetration rates are used to illustrate market trends. The analysis incorporates both historical data (2019-2024) and future projections (2025-2033). The market is expected to witness a CAGR of xx% during the forecast period, driven by increasing industrialization and urbanization in developing economies.
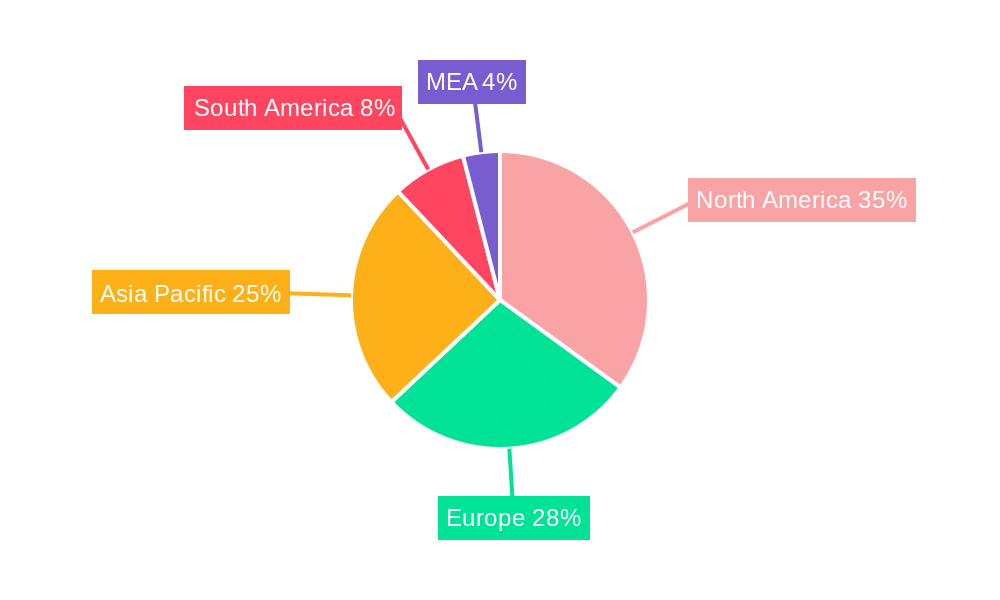
Dominant Regions, Countries, or Segments in Natural Gas Distribution Market
This section pinpoints the leading regions, countries, and end-user/type segments driving market growth. We analyze market share, growth potential, and key drivers for each segment, including economic policies and infrastructure development. North America is identified as the largest market in 2025, followed by Europe and Asia-Pacific.
- North America: Strong industrial demand and established infrastructure contribute to this region's dominance.
- Europe: Stringent environmental regulations are influencing the transition towards cleaner energy sources, impacting growth.
- Asia-Pacific: Rapid industrialization and urbanization in countries like China and India are fueling significant market expansion.
- End-User Segments: The industrial sector is the largest end-user, followed by the power sector, with residential and commercial buildings showing steady growth. CNG shows faster growth than PNG in transportation sector.
Natural Gas Distribution Market Product Landscape
This section provides an overview of product innovations, applications, and performance metrics within the natural gas distribution market. Key innovations include advanced pipeline materials, smart grid technologies, and the increasing integration of renewable gas sources into the distribution network. These advancements improve efficiency, reliability, and safety. The focus is on enhancing operational efficiency and reducing environmental impact.
Key Drivers, Barriers & Challenges in Natural Gas Distribution Market
This section outlines the key drivers and challenges impacting market growth.
Key Drivers:
- Increasing demand from industrial and power sectors.
- Growing urbanization and population growth.
- Government support for natural gas infrastructure development.
Challenges:
- Competition from renewable energy sources.
- Stringent environmental regulations and emission reduction targets.
- Supply chain disruptions and price volatility of natural gas. The impact of supply chain disruptions was estimated at xx Million in losses in 2022.
Emerging Opportunities in Natural Gas Distribution Market
This section highlights emerging opportunities for growth, including:
- Expansion into underserved regions.
- Development of renewable natural gas (RNG) infrastructure.
- Integration of smart grid technologies and digitalization initiatives.
- Growth of CNG fueling stations.
Growth Accelerators in the Natural Gas Distribution Market Industry
Long-term growth is propelled by technological advancements enabling efficient distribution, strategic partnerships for infrastructure development, and expansion into new geographic markets. The focus on reducing carbon emissions through RNG integration is a major growth catalyst.
Key Players Shaping the Natural Gas Distribution Market Market
- TC Energy Corporation
- National Grid Plc
- Southern Co
- Enel SpA
- Oneok Inc
- Dominion Energy Inc
- Enbridge Inc
- Sempra Energy
- Kinder Morgan Inc
- Williams Companies Inc
- List Not Exhaustive
Notable Milestones in Natural Gas Distribution Market Sector
- 2022-Q4: X Company launched a new smart metering system.
- 2023-Q1: Y Company acquired Z Company, expanding its market reach.
- 2024-Q2: Significant investment announced in RNG infrastructure development by multiple players. (Specific details of investments and companies will be added in the full report)
In-Depth Natural Gas Distribution Market Market Outlook
The future of the Natural Gas Distribution Market is positive, driven by sustained demand from various sectors and ongoing infrastructure development. Strategic partnerships and investments in innovative technologies will continue to shape the market landscape, fostering growth and creating new opportunities. The market is poised for continued expansion, with significant potential for growth in emerging markets and the integration of renewable energy sources.
Natural Gas Distribution Market Segmentation
-
1. End-User
- 1.1. Industrial
- 1.2. Power Sector
- 1.3. Residential and Commercial Buildings
- 1.4. Transportation
-
2. Type
- 2.1. Compressed Natural Gas (CNG)
- 2.2. Pipeline Natural Gas (PNG)
Natural Gas Distribution Market Segmentation By Geography
- 1. North America
- 2. Asia Pacific
- 3. Europe
- 4. South America
- 5. Middle East and Africa
Natural Gas Distribution Market REPORT HIGHLIGHTS
| Aspects | Details |
|---|---|
| Study Period | 2019-2033 |
| Base Year | 2024 |
| Estimated Year | 2025 |
| Forecast Period | 2025-2033 |
| Historical Period | 2019-2024 |
| Growth Rate | CAGR of > 3.20% from 2019-2033 |
| Segmentation |
|
Table of Contents
- 1. Introduction
- 1.1. Research Scope
- 1.2. Market Segmentation
- 1.3. Research Methodology
- 1.4. Definitions and Assumptions
- 2. Executive Summary
- 2.1. Introduction
- 3. Market Dynamics
- 3.1. Introduction
- 3.2. Market Drivers
- 3.2.1. 4.; Demand for Clean Energy Sources4.; Supportive Government Policies
- 3.3. Market Restrains
- 3.3.1. 4.; Increasing Adoption of Other Alternative Clean Energy Sources
- 3.4. Market Trends
- 3.4.1. Power Sector to Dominate the Market
- 4. Market Factor Analysis
- 4.1. Porters Five Forces
- 4.2. Supply/Value Chain
- 4.3. PESTEL analysis
- 4.4. Market Entropy
- 4.5. Patent/Trademark Analysis
- 5. Global Natural Gas Distribution Market Analysis, Insights and Forecast, 2019-2031
- 5.1. Market Analysis, Insights and Forecast - by End-User
- 5.1.1. Industrial
- 5.1.2. Power Sector
- 5.1.3. Residential and Commercial Buildings
- 5.1.4. Transportation
- 5.2. Market Analysis, Insights and Forecast - by Type
- 5.2.1. Compressed Natural Gas (CNG)
- 5.2.2. Pipeline Natural Gas (PNG)
- 5.3. Market Analysis, Insights and Forecast - by Region
- 5.3.1. North America
- 5.3.2. Asia Pacific
- 5.3.3. Europe
- 5.3.4. South America
- 5.3.5. Middle East and Africa
- 5.1. Market Analysis, Insights and Forecast - by End-User
- 6. North America Natural Gas Distribution Market Analysis, Insights and Forecast, 2019-2031
- 6.1. Market Analysis, Insights and Forecast - by End-User
- 6.1.1. Industrial
- 6.1.2. Power Sector
- 6.1.3. Residential and Commercial Buildings
- 6.1.4. Transportation
- 6.2. Market Analysis, Insights and Forecast - by Type
- 6.2.1. Compressed Natural Gas (CNG)
- 6.2.2. Pipeline Natural Gas (PNG)
- 6.1. Market Analysis, Insights and Forecast - by End-User
- 7. Asia Pacific Natural Gas Distribution Market Analysis, Insights and Forecast, 2019-2031
- 7.1. Market Analysis, Insights and Forecast - by End-User
- 7.1.1. Industrial
- 7.1.2. Power Sector
- 7.1.3. Residential and Commercial Buildings
- 7.1.4. Transportation
- 7.2. Market Analysis, Insights and Forecast - by Type
- 7.2.1. Compressed Natural Gas (CNG)
- 7.2.2. Pipeline Natural Gas (PNG)
- 7.1. Market Analysis, Insights and Forecast - by End-User
- 8. Europe Natural Gas Distribution Market Analysis, Insights and Forecast, 2019-2031
- 8.1. Market Analysis, Insights and Forecast - by End-User
- 8.1.1. Industrial
- 8.1.2. Power Sector
- 8.1.3. Residential and Commercial Buildings
- 8.1.4. Transportation
- 8.2. Market Analysis, Insights and Forecast - by Type
- 8.2.1. Compressed Natural Gas (CNG)
- 8.2.2. Pipeline Natural Gas (PNG)
- 8.1. Market Analysis, Insights and Forecast - by End-User
- 9. South America Natural Gas Distribution Market Analysis, Insights and Forecast, 2019-2031
- 9.1. Market Analysis, Insights and Forecast - by End-User
- 9.1.1. Industrial
- 9.1.2. Power Sector
- 9.1.3. Residential and Commercial Buildings
- 9.1.4. Transportation
- 9.2. Market Analysis, Insights and Forecast - by Type
- 9.2.1. Compressed Natural Gas (CNG)
- 9.2.2. Pipeline Natural Gas (PNG)
- 9.1. Market Analysis, Insights and Forecast - by End-User
- 10. Middle East and Africa Natural Gas Distribution Market Analysis, Insights and Forecast, 2019-2031
- 10.1. Market Analysis, Insights and Forecast - by End-User
- 10.1.1. Industrial
- 10.1.2. Power Sector
- 10.1.3. Residential and Commercial Buildings
- 10.1.4. Transportation
- 10.2. Market Analysis, Insights and Forecast - by Type
- 10.2.1. Compressed Natural Gas (CNG)
- 10.2.2. Pipeline Natural Gas (PNG)
- 10.1. Market Analysis, Insights and Forecast - by End-User
- 11. North America Natural Gas Distribution Market Analysis, Insights and Forecast, 2019-2031
- 11.1. Market Analysis, Insights and Forecast - By Country/Sub-region
- 11.1.1 United States
- 11.1.2 Canada
- 11.1.3 Mexico
- 12. Europe Natural Gas Distribution Market Analysis, Insights and Forecast, 2019-2031
- 12.1. Market Analysis, Insights and Forecast - By Country/Sub-region
- 12.1.1 Germany
- 12.1.2 United Kingdom
- 12.1.3 France
- 12.1.4 Spain
- 12.1.5 Italy
- 12.1.6 Spain
- 12.1.7 Belgium
- 12.1.8 Netherland
- 12.1.9 Nordics
- 12.1.10 Rest of Europe
- 13. Asia Pacific Natural Gas Distribution Market Analysis, Insights and Forecast, 2019-2031
- 13.1. Market Analysis, Insights and Forecast - By Country/Sub-region
- 13.1.1 China
- 13.1.2 Japan
- 13.1.3 India
- 13.1.4 South Korea
- 13.1.5 Southeast Asia
- 13.1.6 Australia
- 13.1.7 Indonesia
- 13.1.8 Phillipes
- 13.1.9 Singapore
- 13.1.10 Thailandc
- 13.1.11 Rest of Asia Pacific
- 14. South America Natural Gas Distribution Market Analysis, Insights and Forecast, 2019-2031
- 14.1. Market Analysis, Insights and Forecast - By Country/Sub-region
- 14.1.1 Brazil
- 14.1.2 Argentina
- 14.1.3 Peru
- 14.1.4 Chile
- 14.1.5 Colombia
- 14.1.6 Ecuador
- 14.1.7 Venezuela
- 14.1.8 Rest of South America
- 15. North America Natural Gas Distribution Market Analysis, Insights and Forecast, 2019-2031
- 15.1. Market Analysis, Insights and Forecast - By Country/Sub-region
- 15.1.1 United States
- 15.1.2 Canada
- 15.1.3 Mexico
- 16. MEA Natural Gas Distribution Market Analysis, Insights and Forecast, 2019-2031
- 16.1. Market Analysis, Insights and Forecast - By Country/Sub-region
- 16.1.1 United Arab Emirates
- 16.1.2 Saudi Arabia
- 16.1.3 South Africa
- 16.1.4 Rest of Middle East and Africa
- 17. Competitive Analysis
- 17.1. Global Market Share Analysis 2024
- 17.2. Company Profiles
- 17.2.1 TC Energy Corporation
- 17.2.1.1. Overview
- 17.2.1.2. Products
- 17.2.1.3. SWOT Analysis
- 17.2.1.4. Recent Developments
- 17.2.1.5. Financials (Based on Availability)
- 17.2.2 National Grid Plc
- 17.2.2.1. Overview
- 17.2.2.2. Products
- 17.2.2.3. SWOT Analysis
- 17.2.2.4. Recent Developments
- 17.2.2.5. Financials (Based on Availability)
- 17.2.3 Southern Co
- 17.2.3.1. Overview
- 17.2.3.2. Products
- 17.2.3.3. SWOT Analysis
- 17.2.3.4. Recent Developments
- 17.2.3.5. Financials (Based on Availability)
- 17.2.4 Enel SpA
- 17.2.4.1. Overview
- 17.2.4.2. Products
- 17.2.4.3. SWOT Analysis
- 17.2.4.4. Recent Developments
- 17.2.4.5. Financials (Based on Availability)
- 17.2.5 Oneok Inc
- 17.2.5.1. Overview
- 17.2.5.2. Products
- 17.2.5.3. SWOT Analysis
- 17.2.5.4. Recent Developments
- 17.2.5.5. Financials (Based on Availability)
- 17.2.6 Dominion Energy Inc
- 17.2.6.1. Overview
- 17.2.6.2. Products
- 17.2.6.3. SWOT Analysis
- 17.2.6.4. Recent Developments
- 17.2.6.5. Financials (Based on Availability)
- 17.2.7 Enbridge Inc
- 17.2.7.1. Overview
- 17.2.7.2. Products
- 17.2.7.3. SWOT Analysis
- 17.2.7.4. Recent Developments
- 17.2.7.5. Financials (Based on Availability)
- 17.2.8 Sempra Energy
- 17.2.8.1. Overview
- 17.2.8.2. Products
- 17.2.8.3. SWOT Analysis
- 17.2.8.4. Recent Developments
- 17.2.8.5. Financials (Based on Availability)
- 17.2.9 Kinder Morgan Inc
- 17.2.9.1. Overview
- 17.2.9.2. Products
- 17.2.9.3. SWOT Analysis
- 17.2.9.4. Recent Developments
- 17.2.9.5. Financials (Based on Availability)
- 17.2.10 Williams Companies Inc *List Not Exhaustive
- 17.2.10.1. Overview
- 17.2.10.2. Products
- 17.2.10.3. SWOT Analysis
- 17.2.10.4. Recent Developments
- 17.2.10.5. Financials (Based on Availability)
- 17.2.1 TC Energy Corporation
List of Figures
- Figure 1: Global Natural Gas Distribution Market Revenue Breakdown (Million, %) by Region 2024 & 2032
- Figure 2: North America Natural Gas Distribution Market Revenue (Million), by Country 2024 & 2032
- Figure 3: North America Natural Gas Distribution Market Revenue Share (%), by Country 2024 & 2032
- Figure 4: Europe Natural Gas Distribution Market Revenue (Million), by Country 2024 & 2032
- Figure 5: Europe Natural Gas Distribution Market Revenue Share (%), by Country 2024 & 2032
- Figure 6: Asia Pacific Natural Gas Distribution Market Revenue (Million), by Country 2024 & 2032
- Figure 7: Asia Pacific Natural Gas Distribution Market Revenue Share (%), by Country 2024 & 2032
- Figure 8: South America Natural Gas Distribution Market Revenue (Million), by Country 2024 & 2032
- Figure 9: South America Natural Gas Distribution Market Revenue Share (%), by Country 2024 & 2032
- Figure 10: North America Natural Gas Distribution Market Revenue (Million), by Country 2024 & 2032
- Figure 11: North America Natural Gas Distribution Market Revenue Share (%), by Country 2024 & 2032
- Figure 12: MEA Natural Gas Distribution Market Revenue (Million), by Country 2024 & 2032
- Figure 13: MEA Natural Gas Distribution Market Revenue Share (%), by Country 2024 & 2032
- Figure 14: North America Natural Gas Distribution Market Revenue (Million), by End-User 2024 & 2032
- Figure 15: North America Natural Gas Distribution Market Revenue Share (%), by End-User 2024 & 2032
- Figure 16: North America Natural Gas Distribution Market Revenue (Million), by Type 2024 & 2032
- Figure 17: North America Natural Gas Distribution Market Revenue Share (%), by Type 2024 & 2032
- Figure 18: North America Natural Gas Distribution Market Revenue (Million), by Country 2024 & 2032
- Figure 19: North America Natural Gas Distribution Market Revenue Share (%), by Country 2024 & 2032
- Figure 20: Asia Pacific Natural Gas Distribution Market Revenue (Million), by End-User 2024 & 2032
- Figure 21: Asia Pacific Natural Gas Distribution Market Revenue Share (%), by End-User 2024 & 2032
- Figure 22: Asia Pacific Natural Gas Distribution Market Revenue (Million), by Type 2024 & 2032
- Figure 23: Asia Pacific Natural Gas Distribution Market Revenue Share (%), by Type 2024 & 2032
- Figure 24: Asia Pacific Natural Gas Distribution Market Revenue (Million), by Country 2024 & 2032
- Figure 25: Asia Pacific Natural Gas Distribution Market Revenue Share (%), by Country 2024 & 2032
- Figure 26: Europe Natural Gas Distribution Market Revenue (Million), by End-User 2024 & 2032
- Figure 27: Europe Natural Gas Distribution Market Revenue Share (%), by End-User 2024 & 2032
- Figure 28: Europe Natural Gas Distribution Market Revenue (Million), by Type 2024 & 2032
- Figure 29: Europe Natural Gas Distribution Market Revenue Share (%), by Type 2024 & 2032
- Figure 30: Europe Natural Gas Distribution Market Revenue (Million), by Country 2024 & 2032
- Figure 31: Europe Natural Gas Distribution Market Revenue Share (%), by Country 2024 & 2032
- Figure 32: South America Natural Gas Distribution Market Revenue (Million), by End-User 2024 & 2032
- Figure 33: South America Natural Gas Distribution Market Revenue Share (%), by End-User 2024 & 2032
- Figure 34: South America Natural Gas Distribution Market Revenue (Million), by Type 2024 & 2032
- Figure 35: South America Natural Gas Distribution Market Revenue Share (%), by Type 2024 & 2032
- Figure 36: South America Natural Gas Distribution Market Revenue (Million), by Country 2024 & 2032
- Figure 37: South America Natural Gas Distribution Market Revenue Share (%), by Country 2024 & 2032
- Figure 38: Middle East and Africa Natural Gas Distribution Market Revenue (Million), by End-User 2024 & 2032
- Figure 39: Middle East and Africa Natural Gas Distribution Market Revenue Share (%), by End-User 2024 & 2032
- Figure 40: Middle East and Africa Natural Gas Distribution Market Revenue (Million), by Type 2024 & 2032
- Figure 41: Middle East and Africa Natural Gas Distribution Market Revenue Share (%), by Type 2024 & 2032
- Figure 42: Middle East and Africa Natural Gas Distribution Market Revenue (Million), by Country 2024 & 2032
- Figure 43: Middle East and Africa Natural Gas Distribution Market Revenue Share (%), by Country 2024 & 2032
List of Tables
- Table 1: Global Natural Gas Distribution Market Revenue Million Forecast, by Region 2019 & 2032
- Table 2: Global Natural Gas Distribution Market Revenue Million Forecast, by End-User 2019 & 2032
- Table 3: Global Natural Gas Distribution Market Revenue Million Forecast, by Type 2019 & 2032
- Table 4: Global Natural Gas Distribution Market Revenue Million Forecast, by Region 2019 & 2032
- Table 5: Global Natural Gas Distribution Market Revenue Million Forecast, by Country 2019 & 2032
- Table 6: United States Natural Gas Distribution Market Revenue (Million) Forecast, by Application 2019 & 2032
- Table 7: Canada Natural Gas Distribution Market Revenue (Million) Forecast, by Application 2019 & 2032
- Table 8: Mexico Natural Gas Distribution Market Revenue (Million) Forecast, by Application 2019 & 2032
- Table 9: Global Natural Gas Distribution Market Revenue Million Forecast, by Country 2019 & 2032
- Table 10: Germany Natural Gas Distribution Market Revenue (Million) Forecast, by Application 2019 & 2032
- Table 11: United Kingdom Natural Gas Distribution Market Revenue (Million) Forecast, by Application 2019 & 2032
- Table 12: France Natural Gas Distribution Market Revenue (Million) Forecast, by Application 2019 & 2032
- Table 13: Spain Natural Gas Distribution Market Revenue (Million) Forecast, by Application 2019 & 2032
- Table 14: Italy Natural Gas Distribution Market Revenue (Million) Forecast, by Application 2019 & 2032
- Table 15: Spain Natural Gas Distribution Market Revenue (Million) Forecast, by Application 2019 & 2032
- Table 16: Belgium Natural Gas Distribution Market Revenue (Million) Forecast, by Application 2019 & 2032
- Table 17: Netherland Natural Gas Distribution Market Revenue (Million) Forecast, by Application 2019 & 2032
- Table 18: Nordics Natural Gas Distribution Market Revenue (Million) Forecast, by Application 2019 & 2032
- Table 19: Rest of Europe Natural Gas Distribution Market Revenue (Million) Forecast, by Application 2019 & 2032
- Table 20: Global Natural Gas Distribution Market Revenue Million Forecast, by Country 2019 & 2032
- Table 21: China Natural Gas Distribution Market Revenue (Million) Forecast, by Application 2019 & 2032
- Table 22: Japan Natural Gas Distribution Market Revenue (Million) Forecast, by Application 2019 & 2032
- Table 23: India Natural Gas Distribution Market Revenue (Million) Forecast, by Application 2019 & 2032
- Table 24: South Korea Natural Gas Distribution Market Revenue (Million) Forecast, by Application 2019 & 2032
- Table 25: Southeast Asia Natural Gas Distribution Market Revenue (Million) Forecast, by Application 2019 & 2032
- Table 26: Australia Natural Gas Distribution Market Revenue (Million) Forecast, by Application 2019 & 2032
- Table 27: Indonesia Natural Gas Distribution Market Revenue (Million) Forecast, by Application 2019 & 2032
- Table 28: Phillipes Natural Gas Distribution Market Revenue (Million) Forecast, by Application 2019 & 2032
- Table 29: Singapore Natural Gas Distribution Market Revenue (Million) Forecast, by Application 2019 & 2032
- Table 30: Thailandc Natural Gas Distribution Market Revenue (Million) Forecast, by Application 2019 & 2032
- Table 31: Rest of Asia Pacific Natural Gas Distribution Market Revenue (Million) Forecast, by Application 2019 & 2032
- Table 32: Global Natural Gas Distribution Market Revenue Million Forecast, by Country 2019 & 2032
- Table 33: Brazil Natural Gas Distribution Market Revenue (Million) Forecast, by Application 2019 & 2032
- Table 34: Argentina Natural Gas Distribution Market Revenue (Million) Forecast, by Application 2019 & 2032
- Table 35: Peru Natural Gas Distribution Market Revenue (Million) Forecast, by Application 2019 & 2032
- Table 36: Chile Natural Gas Distribution Market Revenue (Million) Forecast, by Application 2019 & 2032
- Table 37: Colombia Natural Gas Distribution Market Revenue (Million) Forecast, by Application 2019 & 2032
- Table 38: Ecuador Natural Gas Distribution Market Revenue (Million) Forecast, by Application 2019 & 2032
- Table 39: Venezuela Natural Gas Distribution Market Revenue (Million) Forecast, by Application 2019 & 2032
- Table 40: Rest of South America Natural Gas Distribution Market Revenue (Million) Forecast, by Application 2019 & 2032
- Table 41: Global Natural Gas Distribution Market Revenue Million Forecast, by Country 2019 & 2032
- Table 42: United States Natural Gas Distribution Market Revenue (Million) Forecast, by Application 2019 & 2032
- Table 43: Canada Natural Gas Distribution Market Revenue (Million) Forecast, by Application 2019 & 2032
- Table 44: Mexico Natural Gas Distribution Market Revenue (Million) Forecast, by Application 2019 & 2032
- Table 45: Global Natural Gas Distribution Market Revenue Million Forecast, by Country 2019 & 2032
- Table 46: United Arab Emirates Natural Gas Distribution Market Revenue (Million) Forecast, by Application 2019 & 2032
- Table 47: Saudi Arabia Natural Gas Distribution Market Revenue (Million) Forecast, by Application 2019 & 2032
- Table 48: South Africa Natural Gas Distribution Market Revenue (Million) Forecast, by Application 2019 & 2032
- Table 49: Rest of Middle East and Africa Natural Gas Distribution Market Revenue (Million) Forecast, by Application 2019 & 2032
- Table 50: Global Natural Gas Distribution Market Revenue Million Forecast, by End-User 2019 & 2032
- Table 51: Global Natural Gas Distribution Market Revenue Million Forecast, by Type 2019 & 2032
- Table 52: Global Natural Gas Distribution Market Revenue Million Forecast, by Country 2019 & 2032
- Table 53: Global Natural Gas Distribution Market Revenue Million Forecast, by End-User 2019 & 2032
- Table 54: Global Natural Gas Distribution Market Revenue Million Forecast, by Type 2019 & 2032
- Table 55: Global Natural Gas Distribution Market Revenue Million Forecast, by Country 2019 & 2032
- Table 56: Global Natural Gas Distribution Market Revenue Million Forecast, by End-User 2019 & 2032
- Table 57: Global Natural Gas Distribution Market Revenue Million Forecast, by Type 2019 & 2032
- Table 58: Global Natural Gas Distribution Market Revenue Million Forecast, by Country 2019 & 2032
- Table 59: Global Natural Gas Distribution Market Revenue Million Forecast, by End-User 2019 & 2032
- Table 60: Global Natural Gas Distribution Market Revenue Million Forecast, by Type 2019 & 2032
- Table 61: Global Natural Gas Distribution Market Revenue Million Forecast, by Country 2019 & 2032
- Table 62: Global Natural Gas Distribution Market Revenue Million Forecast, by End-User 2019 & 2032
- Table 63: Global Natural Gas Distribution Market Revenue Million Forecast, by Type 2019 & 2032
- Table 64: Global Natural Gas Distribution Market Revenue Million Forecast, by Country 2019 & 2032
Frequently Asked Questions
1. What is the projected Compound Annual Growth Rate (CAGR) of the Natural Gas Distribution Market?
The projected CAGR is approximately > 3.20%.
2. Which companies are prominent players in the Natural Gas Distribution Market?
Key companies in the market include TC Energy Corporation, National Grid Plc, Southern Co, Enel SpA, Oneok Inc, Dominion Energy Inc, Enbridge Inc, Sempra Energy, Kinder Morgan Inc, Williams Companies Inc *List Not Exhaustive.
3. What are the main segments of the Natural Gas Distribution Market?
The market segments include End-User, Type.
4. Can you provide details about the market size?
The market size is estimated to be USD XX Million as of 2022.
5. What are some drivers contributing to market growth?
4.; Demand for Clean Energy Sources4.; Supportive Government Policies.
6. What are the notable trends driving market growth?
Power Sector to Dominate the Market.
7. Are there any restraints impacting market growth?
4.; Increasing Adoption of Other Alternative Clean Energy Sources.
8. Can you provide examples of recent developments in the market?
N/A
9. What pricing options are available for accessing the report?
Pricing options include single-user, multi-user, and enterprise licenses priced at USD 4750, USD 5250, and USD 8750 respectively.
10. Is the market size provided in terms of value or volume?
The market size is provided in terms of value, measured in Million.
11. Are there any specific market keywords associated with the report?
Yes, the market keyword associated with the report is "Natural Gas Distribution Market," which aids in identifying and referencing the specific market segment covered.
12. How do I determine which pricing option suits my needs best?
The pricing options vary based on user requirements and access needs. Individual users may opt for single-user licenses, while businesses requiring broader access may choose multi-user or enterprise licenses for cost-effective access to the report.
13. Are there any additional resources or data provided in the Natural Gas Distribution Market report?
While the report offers comprehensive insights, it's advisable to review the specific contents or supplementary materials provided to ascertain if additional resources or data are available.
14. How can I stay updated on further developments or reports in the Natural Gas Distribution Market?
To stay informed about further developments, trends, and reports in the Natural Gas Distribution Market, consider subscribing to industry newsletters, following relevant companies and organizations, or regularly checking reputable industry news sources and publications.
Methodology
Step 1 - Identification of Relevant Samples Size from Population Database


Step 2 - Approaches for Defining Global Market Size (Value, Volume* & Price*)

Note*: In applicable scenarios
Step 3 - Data Sources
Primary Research
- Web Analytics
- Survey Reports
- Research Institute
- Latest Research Reports
- Opinion Leaders
Secondary Research
- Annual Reports
- White Paper
- Latest Press Release
- Industry Association
- Paid Database
- Investor Presentations

Step 4 - Data Triangulation
Involves using different sources of information in order to increase the validity of a study
These sources are likely to be stakeholders in a program - participants, other researchers, program staff, other community members, and so on.
Then we put all data in single framework & apply various statistical tools to find out the dynamic on the market.
During the analysis stage, feedback from the stakeholder groups would be compared to determine areas of agreement as well as areas of divergence


