
Key Insights
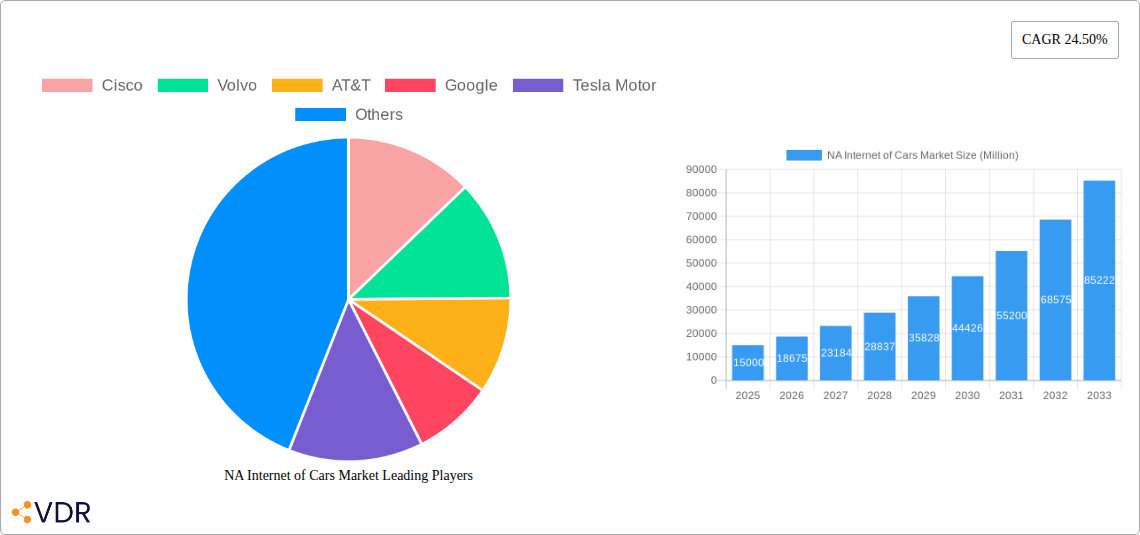
The North American Internet of Cars (IoC) market is experiencing robust growth, driven by increasing vehicle connectivity, advanced driver-assistance systems (ADAS), and the rising demand for in-car infotainment and telematics services. The market's Compound Annual Growth Rate (CAGR) of 24.50% from 2019 to 2024 suggests a significant expansion, projected to continue into the forecast period (2025-2033). Key drivers include the proliferation of smartphones and their integration with vehicles, the increasing adoption of 5G technology enabling faster data speeds and lower latency, and stringent government regulations promoting road safety and connected infrastructure. Technological advancements in areas like Wi-Fi, Bluetooth, NFC, and Cellular communication are further fueling market expansion. The segment breakdown reveals a strong contribution from hardware components, followed by software and services. The car-to-car and car-to-infrastructure communication segments are poised for significant growth due to their role in improving traffic management and enhancing safety features. Major players like Cisco, Volvo, AT&T, Google, Tesla, Verizon, Toyota, and IBM are actively investing in research and development, driving innovation and competition within the market.
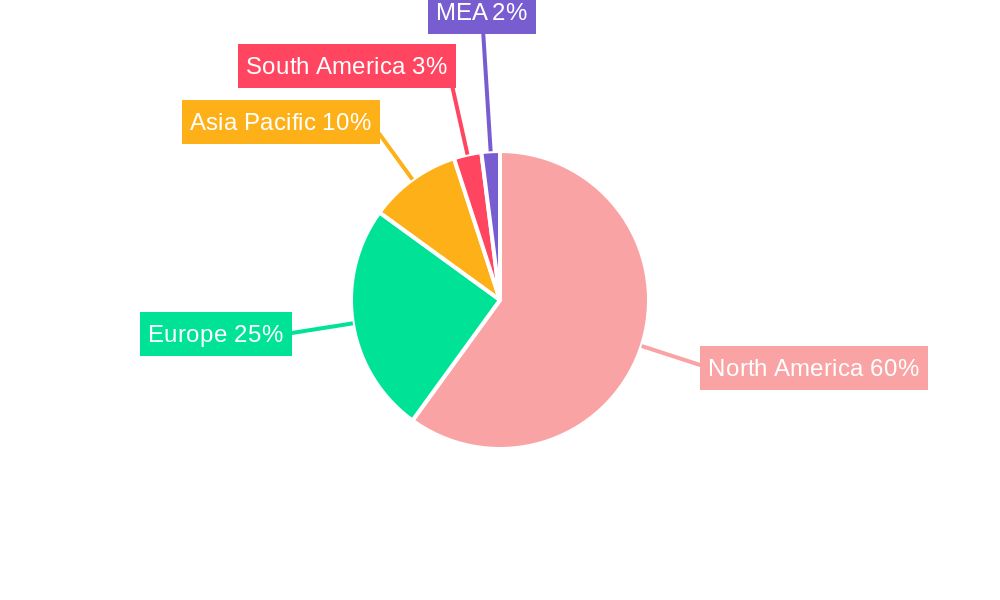
The North American region, particularly the United States and Canada, dominates the IoC market due to high vehicle ownership rates, advanced technological infrastructure, and early adoption of connected car technologies. However, Mexico and other regions are expected to witness significant growth in the coming years driven by increasing disposable incomes and government initiatives to promote technological advancements in the automotive sector. While the market faces challenges such as data security concerns and high initial investment costs for infrastructure development, the overall outlook remains positive. The continuous integration of artificial intelligence (AI) and machine learning (ML) into IoC applications is likely to further enhance the market's potential, creating new opportunities for growth and innovation in areas like autonomous driving and predictive maintenance. The market's future growth trajectory hinges on the continued development of robust cybersecurity measures, the expansion of 5G networks, and the successful integration of IoC technologies into the broader transportation ecosystem.
North America Internet of Cars Market Report: 2019-2033
This comprehensive report provides an in-depth analysis of the North America (NA) Internet of Cars market, encompassing its dynamics, growth trends, key players, and future outlook. The market is segmented by component (hardware, software, services), technology (Wi-Fi, Bluetooth, NFC, cellular, others), communication equipment (car-to-car, car-to-infrastructure, others), and country (United States, Canada, others). This report projects the market to reach xx million units by 2033, presenting invaluable insights for industry professionals, investors, and strategists. The parent market is the broader North American automotive technology sector, while the child market is specifically connected car technologies.
NA Internet of Cars Market Dynamics & Structure
The NA Internet of Cars market exhibits a moderately concentrated structure, with key players like Cisco, Volvo, AT&T, Google, Tesla Motors, Verizon, Toyota, and IBM vying for market share. Technological innovation, particularly in 5G and AI-driven applications, is a crucial growth driver. Regulatory frameworks concerning data privacy and cybersecurity are evolving, impacting market dynamics. Competition from alternative connectivity solutions (e.g., satellite communication) adds complexity to the market landscape. End-user demographics show a strong shift towards younger generations adopting connected car features. The historical period (2019-2024) witnessed a significant increase in M&A activity, with approximately xx deals recorded, demonstrating industry consolidation.
- Market Concentration: Moderately concentrated, with top 5 players holding approximately xx% market share in 2024.
- Technological Innovation: 5G, AI, and edge computing are key drivers, pushing for advanced features.
- Regulatory Landscape: Data privacy regulations (e.g., CCPA, GDPR) and cybersecurity standards influence market development.
- Competitive Substitutes: Satellite communication and alternative connectivity technologies present competitive pressures.
- End-User Demographics: Younger drivers exhibit higher adoption rates of connected car features.
- M&A Activity: Significant M&A activity (xx deals, 2019-2024) suggests industry consolidation and strategic growth.
NA Internet of Cars Market Growth Trends & Insights
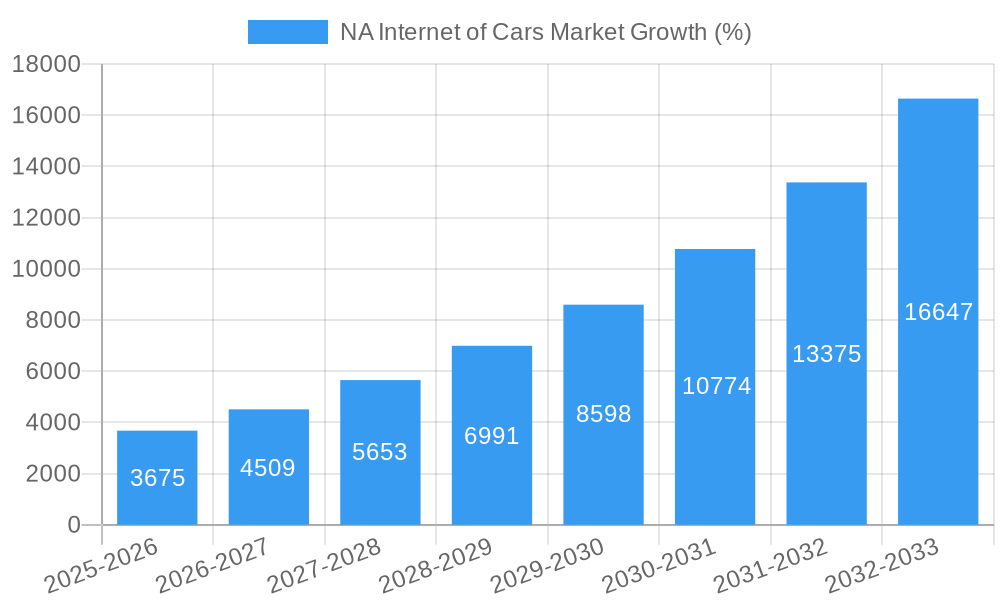
The NA Internet of Cars market experienced significant growth during the historical period (2019-2024), expanding from xx million units in 2019 to xx million units in 2024. This growth is attributed to increasing vehicle production, rising consumer demand for connected features, and technological advancements. The market is projected to grow at a CAGR of xx% during the forecast period (2025-2033), reaching xx million units by 2033. Market penetration is increasing rapidly, with xx% of new vehicles expected to be connected by 2028. Consumer behavior shifts toward personalized in-car experiences and demand for enhanced safety features fuel market expansion. Technological disruptions, such as the transition to 5G and the rise of autonomous driving technologies, further propel market growth.
Dominant Regions, Countries, or Segments in NA Internet of Cars Market
The United States dominates the NA Internet of Cars market, accounting for approximately xx% of the total market share in 2024, driven by high vehicle ownership rates, robust infrastructure, and significant investments in automotive technology. The hardware segment is the largest, with a market share of xx% in 2024, followed by the software and services segments. Cellular technology dominates the connectivity segment, holding xx% market share, thanks to its widespread coverage and data capacity. Car-to-infrastructure communication equipment is a significant growth area, driven by the development of smart city initiatives and infrastructure.
- United States: High vehicle ownership, advanced infrastructure, and technological investments drive market dominance.
- Hardware Segment: Largest segment driven by increasing adoption of advanced driver-assistance systems (ADAS).
- Cellular Technology: Dominant connectivity technology due to wide coverage and data capacity.
- Car-to-Infrastructure: Growth driven by smart city development and autonomous driving initiatives.
NA Internet of Cars Market Product Landscape
The NA Internet of Cars market features a wide array of products, ranging from basic telematics systems to sophisticated infotainment and driver-assistance systems integrated with AI capabilities. These products offer a range of functionalities, including navigation, entertainment, remote diagnostics, and safety features. Key technological advancements include improved processing power, enhanced connectivity, and the integration of artificial intelligence. Unique selling propositions (USPs) encompass intuitive user interfaces, seamless integration with smartphones, and enhanced data security.
Key Drivers, Barriers & Challenges in NA Internet of Cars Market
Key Drivers: Increased vehicle production, rising consumer demand for connected features, technological advancements (5G, AI), government support for smart city initiatives, and collaborations between automakers and technology companies.
Challenges: High initial investment costs, concerns about data security and privacy, cybersecurity threats, lack of standardized communication protocols, and the complexity of integrating various technologies. These challenges pose significant obstacles to market growth. For example, approximately xx% of consumers express concerns about data privacy, hindering adoption.
Emerging Opportunities in NA Internet of Cars Market
Emerging opportunities include the expansion of connected car services into new markets (e.g., rural areas), the development of innovative applications (e.g., predictive maintenance), integration with other smart technologies (e.g., smart homes), and the increasing focus on personalized user experiences. The market for over-the-air (OTA) updates and subscription-based services is poised for rapid growth.
Growth Accelerators in the NA Internet of Cars Market Industry
Technological advancements, especially in areas like 5G connectivity, AI, and edge computing, are key catalysts for long-term growth. Strategic partnerships between automakers, technology companies, and telecommunication providers are accelerating market expansion. Government policies supporting the development of smart cities and infrastructure are creating favorable conditions for growth. Moreover, the increasing adoption of electric vehicles and autonomous driving technologies presents considerable opportunities.
Key Players Shaping the NA Internet of Cars Market Market
Notable Milestones in NA Internet of Cars Market Sector
- October 2021: Kia America rebrands its telematics system from "UVO" to "Kia Connect," significantly increasing connected car numbers from 15,000 in 2018 to an estimated 600,000 by the end of 2021 (a 40-fold increase). This highlights the growing emphasis on connectivity in the automotive industry.
In-Depth NA Internet of Cars Market Market Outlook
The NA Internet of Cars market is poised for sustained growth in the coming years, driven by technological advancements, increasing consumer demand, and supportive government policies. Strategic partnerships and investments in innovative technologies will further fuel market expansion. The integration of AI and 5G technologies will create new opportunities for personalized services and enhanced safety features. The market presents considerable potential for players who can adapt to the rapidly evolving technological landscape and meet the evolving needs of consumers.
NA Internet of Cars Market Segmentation
-
1. Component
- 1.1. Hardware
- 1.2. Software
- 1.3. Service
-
2. Technology
- 2.1. Wi-FI
- 2.2. Bluetooth
- 2.3. NFC
- 2.4. Cellular
- 2.5. Others
-
3. Communication Equipment
- 3.1. Car-to-Car
- 3.2. Car-to-Infrastructure
- 3.3. Others
NA Internet of Cars Market Segmentation By Geography
-
1. North America
- 1.1. United States
- 1.2. Canada
- 1.3. Mexico
-
2. South America
- 2.1. Brazil
- 2.2. Argentina
- 2.3. Rest of South America
-
3. Europe
- 3.1. United Kingdom
- 3.2. Germany
- 3.3. France
- 3.4. Italy
- 3.5. Spain
- 3.6. Russia
- 3.7. Benelux
- 3.8. Nordics
- 3.9. Rest of Europe
-
4. Middle East & Africa
- 4.1. Turkey
- 4.2. Israel
- 4.3. GCC
- 4.4. North Africa
- 4.5. South Africa
- 4.6. Rest of Middle East & Africa
-
5. Asia Pacific
- 5.1. China
- 5.2. India
- 5.3. Japan
- 5.4. South Korea
- 5.5. ASEAN
- 5.6. Oceania
- 5.7. Rest of Asia Pacific
NA Internet of Cars Market REPORT HIGHLIGHTS
| Aspects | Details |
|---|---|
| Study Period | 2019-2033 |
| Base Year | 2024 |
| Estimated Year | 2025 |
| Forecast Period | 2025-2033 |
| Historical Period | 2019-2024 |
| Growth Rate | CAGR of 24.50% from 2019-2033 |
| Segmentation |
|
Table of Contents
- 1. Introduction
- 1.1. Research Scope
- 1.2. Market Segmentation
- 1.3. Research Methodology
- 1.4. Definitions and Assumptions
- 2. Executive Summary
- 2.1. Introduction
- 3. Market Dynamics
- 3.1. Introduction
- 3.2. Market Drivers
- 3.2.1. Increasing Demand for Data Storage and Adoption of Cloud Computing; Need for High Speed Data Transfer; Increasing Demand of Fabric Switches
- 3.3. Market Restrains
- 3.3.1. Security issues
- 3.4. Market Trends
- 3.4.1. North American Market is expected to be driven by Vehicle Safety Norms
- 4. Market Factor Analysis
- 4.1. Porters Five Forces
- 4.2. Supply/Value Chain
- 4.3. PESTEL analysis
- 4.4. Market Entropy
- 4.5. Patent/Trademark Analysis
- 5. Global NA Internet of Cars Market Analysis, Insights and Forecast, 2019-2031
- 5.1. Market Analysis, Insights and Forecast - by Component
- 5.1.1. Hardware
- 5.1.2. Software
- 5.1.3. Service
- 5.2. Market Analysis, Insights and Forecast - by Technology
- 5.2.1. Wi-FI
- 5.2.2. Bluetooth
- 5.2.3. NFC
- 5.2.4. Cellular
- 5.2.5. Others
- 5.3. Market Analysis, Insights and Forecast - by Communication Equipment
- 5.3.1. Car-to-Car
- 5.3.2. Car-to-Infrastructure
- 5.3.3. Others
- 5.4. Market Analysis, Insights and Forecast - by Region
- 5.4.1. North America
- 5.4.2. South America
- 5.4.3. Europe
- 5.4.4. Middle East & Africa
- 5.4.5. Asia Pacific
- 5.1. Market Analysis, Insights and Forecast - by Component
- 6. North America NA Internet of Cars Market Analysis, Insights and Forecast, 2019-2031
- 6.1. Market Analysis, Insights and Forecast - by Component
- 6.1.1. Hardware
- 6.1.2. Software
- 6.1.3. Service
- 6.2. Market Analysis, Insights and Forecast - by Technology
- 6.2.1. Wi-FI
- 6.2.2. Bluetooth
- 6.2.3. NFC
- 6.2.4. Cellular
- 6.2.5. Others
- 6.3. Market Analysis, Insights and Forecast - by Communication Equipment
- 6.3.1. Car-to-Car
- 6.3.2. Car-to-Infrastructure
- 6.3.3. Others
- 6.1. Market Analysis, Insights and Forecast - by Component
- 7. South America NA Internet of Cars Market Analysis, Insights and Forecast, 2019-2031
- 7.1. Market Analysis, Insights and Forecast - by Component
- 7.1.1. Hardware
- 7.1.2. Software
- 7.1.3. Service
- 7.2. Market Analysis, Insights and Forecast - by Technology
- 7.2.1. Wi-FI
- 7.2.2. Bluetooth
- 7.2.3. NFC
- 7.2.4. Cellular
- 7.2.5. Others
- 7.3. Market Analysis, Insights and Forecast - by Communication Equipment
- 7.3.1. Car-to-Car
- 7.3.2. Car-to-Infrastructure
- 7.3.3. Others
- 7.1. Market Analysis, Insights and Forecast - by Component
- 8. Europe NA Internet of Cars Market Analysis, Insights and Forecast, 2019-2031
- 8.1. Market Analysis, Insights and Forecast - by Component
- 8.1.1. Hardware
- 8.1.2. Software
- 8.1.3. Service
- 8.2. Market Analysis, Insights and Forecast - by Technology
- 8.2.1. Wi-FI
- 8.2.2. Bluetooth
- 8.2.3. NFC
- 8.2.4. Cellular
- 8.2.5. Others
- 8.3. Market Analysis, Insights and Forecast - by Communication Equipment
- 8.3.1. Car-to-Car
- 8.3.2. Car-to-Infrastructure
- 8.3.3. Others
- 8.1. Market Analysis, Insights and Forecast - by Component
- 9. Middle East & Africa NA Internet of Cars Market Analysis, Insights and Forecast, 2019-2031
- 9.1. Market Analysis, Insights and Forecast - by Component
- 9.1.1. Hardware
- 9.1.2. Software
- 9.1.3. Service
- 9.2. Market Analysis, Insights and Forecast - by Technology
- 9.2.1. Wi-FI
- 9.2.2. Bluetooth
- 9.2.3. NFC
- 9.2.4. Cellular
- 9.2.5. Others
- 9.3. Market Analysis, Insights and Forecast - by Communication Equipment
- 9.3.1. Car-to-Car
- 9.3.2. Car-to-Infrastructure
- 9.3.3. Others
- 9.1. Market Analysis, Insights and Forecast - by Component
- 10. Asia Pacific NA Internet of Cars Market Analysis, Insights and Forecast, 2019-2031
- 10.1. Market Analysis, Insights and Forecast - by Component
- 10.1.1. Hardware
- 10.1.2. Software
- 10.1.3. Service
- 10.2. Market Analysis, Insights and Forecast - by Technology
- 10.2.1. Wi-FI
- 10.2.2. Bluetooth
- 10.2.3. NFC
- 10.2.4. Cellular
- 10.2.5. Others
- 10.3. Market Analysis, Insights and Forecast - by Communication Equipment
- 10.3.1. Car-to-Car
- 10.3.2. Car-to-Infrastructure
- 10.3.3. Others
- 10.1. Market Analysis, Insights and Forecast - by Component
- 11. North America NA Internet of Cars Market Analysis, Insights and Forecast, 2019-2031
- 11.1. Market Analysis, Insights and Forecast - By Country/Sub-region
- 11.1.1 United States
- 11.1.2 Canada
- 11.1.3 Mexico
- 12. Europe NA Internet of Cars Market Analysis, Insights and Forecast, 2019-2031
- 12.1. Market Analysis, Insights and Forecast - By Country/Sub-region
- 12.1.1 Germany
- 12.1.2 United Kingdom
- 12.1.3 France
- 12.1.4 Spain
- 12.1.5 Italy
- 12.1.6 Spain
- 12.1.7 Belgium
- 12.1.8 Netherland
- 12.1.9 Nordics
- 12.1.10 Rest of Europe
- 13. Asia Pacific NA Internet of Cars Market Analysis, Insights and Forecast, 2019-2031
- 13.1. Market Analysis, Insights and Forecast - By Country/Sub-region
- 13.1.1 China
- 13.1.2 Japan
- 13.1.3 India
- 13.1.4 South Korea
- 13.1.5 Southeast Asia
- 13.1.6 Australia
- 13.1.7 Indonesia
- 13.1.8 Phillipes
- 13.1.9 Singapore
- 13.1.10 Thailandc
- 13.1.11 Rest of Asia Pacific
- 14. South America NA Internet of Cars Market Analysis, Insights and Forecast, 2019-2031
- 14.1. Market Analysis, Insights and Forecast - By Country/Sub-region
- 14.1.1 Brazil
- 14.1.2 Argentina
- 14.1.3 Peru
- 14.1.4 Chile
- 14.1.5 Colombia
- 14.1.6 Ecuador
- 14.1.7 Venezuela
- 14.1.8 Rest of South America
- 15. North America NA Internet of Cars Market Analysis, Insights and Forecast, 2019-2031
- 15.1. Market Analysis, Insights and Forecast - By Country/Sub-region
- 15.1.1 United States
- 15.1.2 Canada
- 15.1.3 Mexico
- 16. MEA NA Internet of Cars Market Analysis, Insights and Forecast, 2019-2031
- 16.1. Market Analysis, Insights and Forecast - By Country/Sub-region
- 16.1.1 United Arab Emirates
- 16.1.2 Saudi Arabia
- 16.1.3 South Africa
- 16.1.4 Rest of Middle East and Africa
- 17. Competitive Analysis
- 17.1. Global Market Share Analysis 2024
- 17.2. Company Profiles
- 17.2.1 Cisco
- 17.2.1.1. Overview
- 17.2.1.2. Products
- 17.2.1.3. SWOT Analysis
- 17.2.1.4. Recent Developments
- 17.2.1.5. Financials (Based on Availability)
- 17.2.2 Volvo
- 17.2.2.1. Overview
- 17.2.2.2. Products
- 17.2.2.3. SWOT Analysis
- 17.2.2.4. Recent Developments
- 17.2.2.5. Financials (Based on Availability)
- 17.2.3 AT&T
- 17.2.3.1. Overview
- 17.2.3.2. Products
- 17.2.3.3. SWOT Analysis
- 17.2.3.4. Recent Developments
- 17.2.3.5. Financials (Based on Availability)
- 17.2.4 Google
- 17.2.4.1. Overview
- 17.2.4.2. Products
- 17.2.4.3. SWOT Analysis
- 17.2.4.4. Recent Developments
- 17.2.4.5. Financials (Based on Availability)
- 17.2.5 Tesla Motor
- 17.2.5.1. Overview
- 17.2.5.2. Products
- 17.2.5.3. SWOT Analysis
- 17.2.5.4. Recent Developments
- 17.2.5.5. Financials (Based on Availability)
- 17.2.6 Verizon
- 17.2.6.1. Overview
- 17.2.6.2. Products
- 17.2.6.3. SWOT Analysis
- 17.2.6.4. Recent Developments
- 17.2.6.5. Financials (Based on Availability)
- 17.2.7 Toyota
- 17.2.7.1. Overview
- 17.2.7.2. Products
- 17.2.7.3. SWOT Analysis
- 17.2.7.4. Recent Developments
- 17.2.7.5. Financials (Based on Availability)
- 17.2.8 IBM
- 17.2.8.1. Overview
- 17.2.8.2. Products
- 17.2.8.3. SWOT Analysis
- 17.2.8.4. Recent Developments
- 17.2.8.5. Financials (Based on Availability)
- 17.2.1 Cisco
List of Figures
- Figure 1: Global NA Internet of Cars Market Revenue Breakdown (Million, %) by Region 2024 & 2032
- Figure 2: North America NA Internet of Cars Market Revenue (Million), by Country 2024 & 2032
- Figure 3: North America NA Internet of Cars Market Revenue Share (%), by Country 2024 & 2032
- Figure 4: Europe NA Internet of Cars Market Revenue (Million), by Country 2024 & 2032
- Figure 5: Europe NA Internet of Cars Market Revenue Share (%), by Country 2024 & 2032
- Figure 6: Asia Pacific NA Internet of Cars Market Revenue (Million), by Country 2024 & 2032
- Figure 7: Asia Pacific NA Internet of Cars Market Revenue Share (%), by Country 2024 & 2032
- Figure 8: South America NA Internet of Cars Market Revenue (Million), by Country 2024 & 2032
- Figure 9: South America NA Internet of Cars Market Revenue Share (%), by Country 2024 & 2032
- Figure 10: North America NA Internet of Cars Market Revenue (Million), by Country 2024 & 2032
- Figure 11: North America NA Internet of Cars Market Revenue Share (%), by Country 2024 & 2032
- Figure 12: MEA NA Internet of Cars Market Revenue (Million), by Country 2024 & 2032
- Figure 13: MEA NA Internet of Cars Market Revenue Share (%), by Country 2024 & 2032
- Figure 14: North America NA Internet of Cars Market Revenue (Million), by Component 2024 & 2032
- Figure 15: North America NA Internet of Cars Market Revenue Share (%), by Component 2024 & 2032
- Figure 16: North America NA Internet of Cars Market Revenue (Million), by Technology 2024 & 2032
- Figure 17: North America NA Internet of Cars Market Revenue Share (%), by Technology 2024 & 2032
- Figure 18: North America NA Internet of Cars Market Revenue (Million), by Communication Equipment 2024 & 2032
- Figure 19: North America NA Internet of Cars Market Revenue Share (%), by Communication Equipment 2024 & 2032
- Figure 20: North America NA Internet of Cars Market Revenue (Million), by Country 2024 & 2032
- Figure 21: North America NA Internet of Cars Market Revenue Share (%), by Country 2024 & 2032
- Figure 22: South America NA Internet of Cars Market Revenue (Million), by Component 2024 & 2032
- Figure 23: South America NA Internet of Cars Market Revenue Share (%), by Component 2024 & 2032
- Figure 24: South America NA Internet of Cars Market Revenue (Million), by Technology 2024 & 2032
- Figure 25: South America NA Internet of Cars Market Revenue Share (%), by Technology 2024 & 2032
- Figure 26: South America NA Internet of Cars Market Revenue (Million), by Communication Equipment 2024 & 2032
- Figure 27: South America NA Internet of Cars Market Revenue Share (%), by Communication Equipment 2024 & 2032
- Figure 28: South America NA Internet of Cars Market Revenue (Million), by Country 2024 & 2032
- Figure 29: South America NA Internet of Cars Market Revenue Share (%), by Country 2024 & 2032
- Figure 30: Europe NA Internet of Cars Market Revenue (Million), by Component 2024 & 2032
- Figure 31: Europe NA Internet of Cars Market Revenue Share (%), by Component 2024 & 2032
- Figure 32: Europe NA Internet of Cars Market Revenue (Million), by Technology 2024 & 2032
- Figure 33: Europe NA Internet of Cars Market Revenue Share (%), by Technology 2024 & 2032
- Figure 34: Europe NA Internet of Cars Market Revenue (Million), by Communication Equipment 2024 & 2032
- Figure 35: Europe NA Internet of Cars Market Revenue Share (%), by Communication Equipment 2024 & 2032
- Figure 36: Europe NA Internet of Cars Market Revenue (Million), by Country 2024 & 2032
- Figure 37: Europe NA Internet of Cars Market Revenue Share (%), by Country 2024 & 2032
- Figure 38: Middle East & Africa NA Internet of Cars Market Revenue (Million), by Component 2024 & 2032
- Figure 39: Middle East & Africa NA Internet of Cars Market Revenue Share (%), by Component 2024 & 2032
- Figure 40: Middle East & Africa NA Internet of Cars Market Revenue (Million), by Technology 2024 & 2032
- Figure 41: Middle East & Africa NA Internet of Cars Market Revenue Share (%), by Technology 2024 & 2032
- Figure 42: Middle East & Africa NA Internet of Cars Market Revenue (Million), by Communication Equipment 2024 & 2032
- Figure 43: Middle East & Africa NA Internet of Cars Market Revenue Share (%), by Communication Equipment 2024 & 2032
- Figure 44: Middle East & Africa NA Internet of Cars Market Revenue (Million), by Country 2024 & 2032
- Figure 45: Middle East & Africa NA Internet of Cars Market Revenue Share (%), by Country 2024 & 2032
- Figure 46: Asia Pacific NA Internet of Cars Market Revenue (Million), by Component 2024 & 2032
- Figure 47: Asia Pacific NA Internet of Cars Market Revenue Share (%), by Component 2024 & 2032
- Figure 48: Asia Pacific NA Internet of Cars Market Revenue (Million), by Technology 2024 & 2032
- Figure 49: Asia Pacific NA Internet of Cars Market Revenue Share (%), by Technology 2024 & 2032
- Figure 50: Asia Pacific NA Internet of Cars Market Revenue (Million), by Communication Equipment 2024 & 2032
- Figure 51: Asia Pacific NA Internet of Cars Market Revenue Share (%), by Communication Equipment 2024 & 2032
- Figure 52: Asia Pacific NA Internet of Cars Market Revenue (Million), by Country 2024 & 2032
- Figure 53: Asia Pacific NA Internet of Cars Market Revenue Share (%), by Country 2024 & 2032
List of Tables
- Table 1: Global NA Internet of Cars Market Revenue Million Forecast, by Region 2019 & 2032
- Table 2: Global NA Internet of Cars Market Revenue Million Forecast, by Component 2019 & 2032
- Table 3: Global NA Internet of Cars Market Revenue Million Forecast, by Technology 2019 & 2032
- Table 4: Global NA Internet of Cars Market Revenue Million Forecast, by Communication Equipment 2019 & 2032
- Table 5: Global NA Internet of Cars Market Revenue Million Forecast, by Region 2019 & 2032
- Table 6: Global NA Internet of Cars Market Revenue Million Forecast, by Country 2019 & 2032
- Table 7: United States NA Internet of Cars Market Revenue (Million) Forecast, by Application 2019 & 2032
- Table 8: Canada NA Internet of Cars Market Revenue (Million) Forecast, by Application 2019 & 2032
- Table 9: Mexico NA Internet of Cars Market Revenue (Million) Forecast, by Application 2019 & 2032
- Table 10: Global NA Internet of Cars Market Revenue Million Forecast, by Country 2019 & 2032
- Table 11: Germany NA Internet of Cars Market Revenue (Million) Forecast, by Application 2019 & 2032
- Table 12: United Kingdom NA Internet of Cars Market Revenue (Million) Forecast, by Application 2019 & 2032
- Table 13: France NA Internet of Cars Market Revenue (Million) Forecast, by Application 2019 & 2032
- Table 14: Spain NA Internet of Cars Market Revenue (Million) Forecast, by Application 2019 & 2032
- Table 15: Italy NA Internet of Cars Market Revenue (Million) Forecast, by Application 2019 & 2032
- Table 16: Spain NA Internet of Cars Market Revenue (Million) Forecast, by Application 2019 & 2032
- Table 17: Belgium NA Internet of Cars Market Revenue (Million) Forecast, by Application 2019 & 2032
- Table 18: Netherland NA Internet of Cars Market Revenue (Million) Forecast, by Application 2019 & 2032
- Table 19: Nordics NA Internet of Cars Market Revenue (Million) Forecast, by Application 2019 & 2032
- Table 20: Rest of Europe NA Internet of Cars Market Revenue (Million) Forecast, by Application 2019 & 2032
- Table 21: Global NA Internet of Cars Market Revenue Million Forecast, by Country 2019 & 2032
- Table 22: China NA Internet of Cars Market Revenue (Million) Forecast, by Application 2019 & 2032
- Table 23: Japan NA Internet of Cars Market Revenue (Million) Forecast, by Application 2019 & 2032
- Table 24: India NA Internet of Cars Market Revenue (Million) Forecast, by Application 2019 & 2032
- Table 25: South Korea NA Internet of Cars Market Revenue (Million) Forecast, by Application 2019 & 2032
- Table 26: Southeast Asia NA Internet of Cars Market Revenue (Million) Forecast, by Application 2019 & 2032
- Table 27: Australia NA Internet of Cars Market Revenue (Million) Forecast, by Application 2019 & 2032
- Table 28: Indonesia NA Internet of Cars Market Revenue (Million) Forecast, by Application 2019 & 2032
- Table 29: Phillipes NA Internet of Cars Market Revenue (Million) Forecast, by Application 2019 & 2032
- Table 30: Singapore NA Internet of Cars Market Revenue (Million) Forecast, by Application 2019 & 2032
- Table 31: Thailandc NA Internet of Cars Market Revenue (Million) Forecast, by Application 2019 & 2032
- Table 32: Rest of Asia Pacific NA Internet of Cars Market Revenue (Million) Forecast, by Application 2019 & 2032
- Table 33: Global NA Internet of Cars Market Revenue Million Forecast, by Country 2019 & 2032
- Table 34: Brazil NA Internet of Cars Market Revenue (Million) Forecast, by Application 2019 & 2032
- Table 35: Argentina NA Internet of Cars Market Revenue (Million) Forecast, by Application 2019 & 2032
- Table 36: Peru NA Internet of Cars Market Revenue (Million) Forecast, by Application 2019 & 2032
- Table 37: Chile NA Internet of Cars Market Revenue (Million) Forecast, by Application 2019 & 2032
- Table 38: Colombia NA Internet of Cars Market Revenue (Million) Forecast, by Application 2019 & 2032
- Table 39: Ecuador NA Internet of Cars Market Revenue (Million) Forecast, by Application 2019 & 2032
- Table 40: Venezuela NA Internet of Cars Market Revenue (Million) Forecast, by Application 2019 & 2032
- Table 41: Rest of South America NA Internet of Cars Market Revenue (Million) Forecast, by Application 2019 & 2032
- Table 42: Global NA Internet of Cars Market Revenue Million Forecast, by Country 2019 & 2032
- Table 43: United States NA Internet of Cars Market Revenue (Million) Forecast, by Application 2019 & 2032
- Table 44: Canada NA Internet of Cars Market Revenue (Million) Forecast, by Application 2019 & 2032
- Table 45: Mexico NA Internet of Cars Market Revenue (Million) Forecast, by Application 2019 & 2032
- Table 46: Global NA Internet of Cars Market Revenue Million Forecast, by Country 2019 & 2032
- Table 47: United Arab Emirates NA Internet of Cars Market Revenue (Million) Forecast, by Application 2019 & 2032
- Table 48: Saudi Arabia NA Internet of Cars Market Revenue (Million) Forecast, by Application 2019 & 2032
- Table 49: South Africa NA Internet of Cars Market Revenue (Million) Forecast, by Application 2019 & 2032
- Table 50: Rest of Middle East and Africa NA Internet of Cars Market Revenue (Million) Forecast, by Application 2019 & 2032
- Table 51: Global NA Internet of Cars Market Revenue Million Forecast, by Component 2019 & 2032
- Table 52: Global NA Internet of Cars Market Revenue Million Forecast, by Technology 2019 & 2032
- Table 53: Global NA Internet of Cars Market Revenue Million Forecast, by Communication Equipment 2019 & 2032
- Table 54: Global NA Internet of Cars Market Revenue Million Forecast, by Country 2019 & 2032
- Table 55: United States NA Internet of Cars Market Revenue (Million) Forecast, by Application 2019 & 2032
- Table 56: Canada NA Internet of Cars Market Revenue (Million) Forecast, by Application 2019 & 2032
- Table 57: Mexico NA Internet of Cars Market Revenue (Million) Forecast, by Application 2019 & 2032
- Table 58: Global NA Internet of Cars Market Revenue Million Forecast, by Component 2019 & 2032
- Table 59: Global NA Internet of Cars Market Revenue Million Forecast, by Technology 2019 & 2032
- Table 60: Global NA Internet of Cars Market Revenue Million Forecast, by Communication Equipment 2019 & 2032
- Table 61: Global NA Internet of Cars Market Revenue Million Forecast, by Country 2019 & 2032
- Table 62: Brazil NA Internet of Cars Market Revenue (Million) Forecast, by Application 2019 & 2032
- Table 63: Argentina NA Internet of Cars Market Revenue (Million) Forecast, by Application 2019 & 2032
- Table 64: Rest of South America NA Internet of Cars Market Revenue (Million) Forecast, by Application 2019 & 2032
- Table 65: Global NA Internet of Cars Market Revenue Million Forecast, by Component 2019 & 2032
- Table 66: Global NA Internet of Cars Market Revenue Million Forecast, by Technology 2019 & 2032
- Table 67: Global NA Internet of Cars Market Revenue Million Forecast, by Communication Equipment 2019 & 2032
- Table 68: Global NA Internet of Cars Market Revenue Million Forecast, by Country 2019 & 2032
- Table 69: United Kingdom NA Internet of Cars Market Revenue (Million) Forecast, by Application 2019 & 2032
- Table 70: Germany NA Internet of Cars Market Revenue (Million) Forecast, by Application 2019 & 2032
- Table 71: France NA Internet of Cars Market Revenue (Million) Forecast, by Application 2019 & 2032
- Table 72: Italy NA Internet of Cars Market Revenue (Million) Forecast, by Application 2019 & 2032
- Table 73: Spain NA Internet of Cars Market Revenue (Million) Forecast, by Application 2019 & 2032
- Table 74: Russia NA Internet of Cars Market Revenue (Million) Forecast, by Application 2019 & 2032
- Table 75: Benelux NA Internet of Cars Market Revenue (Million) Forecast, by Application 2019 & 2032
- Table 76: Nordics NA Internet of Cars Market Revenue (Million) Forecast, by Application 2019 & 2032
- Table 77: Rest of Europe NA Internet of Cars Market Revenue (Million) Forecast, by Application 2019 & 2032
- Table 78: Global NA Internet of Cars Market Revenue Million Forecast, by Component 2019 & 2032
- Table 79: Global NA Internet of Cars Market Revenue Million Forecast, by Technology 2019 & 2032
- Table 80: Global NA Internet of Cars Market Revenue Million Forecast, by Communication Equipment 2019 & 2032
- Table 81: Global NA Internet of Cars Market Revenue Million Forecast, by Country 2019 & 2032
- Table 82: Turkey NA Internet of Cars Market Revenue (Million) Forecast, by Application 2019 & 2032
- Table 83: Israel NA Internet of Cars Market Revenue (Million) Forecast, by Application 2019 & 2032
- Table 84: GCC NA Internet of Cars Market Revenue (Million) Forecast, by Application 2019 & 2032
- Table 85: North Africa NA Internet of Cars Market Revenue (Million) Forecast, by Application 2019 & 2032
- Table 86: South Africa NA Internet of Cars Market Revenue (Million) Forecast, by Application 2019 & 2032
- Table 87: Rest of Middle East & Africa NA Internet of Cars Market Revenue (Million) Forecast, by Application 2019 & 2032
- Table 88: Global NA Internet of Cars Market Revenue Million Forecast, by Component 2019 & 2032
- Table 89: Global NA Internet of Cars Market Revenue Million Forecast, by Technology 2019 & 2032
- Table 90: Global NA Internet of Cars Market Revenue Million Forecast, by Communication Equipment 2019 & 2032
- Table 91: Global NA Internet of Cars Market Revenue Million Forecast, by Country 2019 & 2032
- Table 92: China NA Internet of Cars Market Revenue (Million) Forecast, by Application 2019 & 2032
- Table 93: India NA Internet of Cars Market Revenue (Million) Forecast, by Application 2019 & 2032
- Table 94: Japan NA Internet of Cars Market Revenue (Million) Forecast, by Application 2019 & 2032
- Table 95: South Korea NA Internet of Cars Market Revenue (Million) Forecast, by Application 2019 & 2032
- Table 96: ASEAN NA Internet of Cars Market Revenue (Million) Forecast, by Application 2019 & 2032
- Table 97: Oceania NA Internet of Cars Market Revenue (Million) Forecast, by Application 2019 & 2032
- Table 98: Rest of Asia Pacific NA Internet of Cars Market Revenue (Million) Forecast, by Application 2019 & 2032
Frequently Asked Questions
1. What is the projected Compound Annual Growth Rate (CAGR) of the NA Internet of Cars Market?
The projected CAGR is approximately 24.50%.
2. Which companies are prominent players in the NA Internet of Cars Market?
Key companies in the market include Cisco, Volvo, AT&T, Google, Tesla Motor, Verizon, Toyota, IBM.
3. What are the main segments of the NA Internet of Cars Market?
The market segments include Component, Technology, Communication Equipment.
4. Can you provide details about the market size?
The market size is estimated to be USD XX Million as of 2022.
5. What are some drivers contributing to market growth?
Increasing Demand for Data Storage and Adoption of Cloud Computing; Need for High Speed Data Transfer; Increasing Demand of Fabric Switches.
6. What are the notable trends driving market growth?
North American Market is expected to be driven by Vehicle Safety Norms.
7. Are there any restraints impacting market growth?
Security issues.
8. Can you provide examples of recent developments in the market?
October 2021 - Kia America has rebranded its long-standing in-vehicle and app-based telematics system from "UVO" to "Kia Connect" in line with the direction of the new future-oriented brand of automakers centered on electrification. The renaming emphasizes the importance of connectivity. Since the 2022 model, one or more configurations of each Kia vehicle will have access to Kia Connect. The brand has increased the number of connected cars 40-fold from 15,000 in 2018 to an estimated 600,000 by the end of 2021.
9. What pricing options are available for accessing the report?
Pricing options include single-user, multi-user, and enterprise licenses priced at USD 4750, USD 5250, and USD 8750 respectively.
10. Is the market size provided in terms of value or volume?
The market size is provided in terms of value, measured in Million.
11. Are there any specific market keywords associated with the report?
Yes, the market keyword associated with the report is "NA Internet of Cars Market," which aids in identifying and referencing the specific market segment covered.
12. How do I determine which pricing option suits my needs best?
The pricing options vary based on user requirements and access needs. Individual users may opt for single-user licenses, while businesses requiring broader access may choose multi-user or enterprise licenses for cost-effective access to the report.
13. Are there any additional resources or data provided in the NA Internet of Cars Market report?
While the report offers comprehensive insights, it's advisable to review the specific contents or supplementary materials provided to ascertain if additional resources or data are available.
14. How can I stay updated on further developments or reports in the NA Internet of Cars Market?
To stay informed about further developments, trends, and reports in the NA Internet of Cars Market, consider subscribing to industry newsletters, following relevant companies and organizations, or regularly checking reputable industry news sources and publications.
Methodology
Step 1 - Identification of Relevant Samples Size from Population Database


Step 2 - Approaches for Defining Global Market Size (Value, Volume* & Price*)

Note*: In applicable scenarios
Step 3 - Data Sources
Primary Research
- Web Analytics
- Survey Reports
- Research Institute
- Latest Research Reports
- Opinion Leaders
Secondary Research
- Annual Reports
- White Paper
- Latest Press Release
- Industry Association
- Paid Database
- Investor Presentations

Step 4 - Data Triangulation
Involves using different sources of information in order to increase the validity of a study
These sources are likely to be stakeholders in a program - participants, other researchers, program staff, other community members, and so on.
Then we put all data in single framework & apply various statistical tools to find out the dynamic on the market.
During the analysis stage, feedback from the stakeholder groups would be compared to determine areas of agreement as well as areas of divergence


