
Key Insights
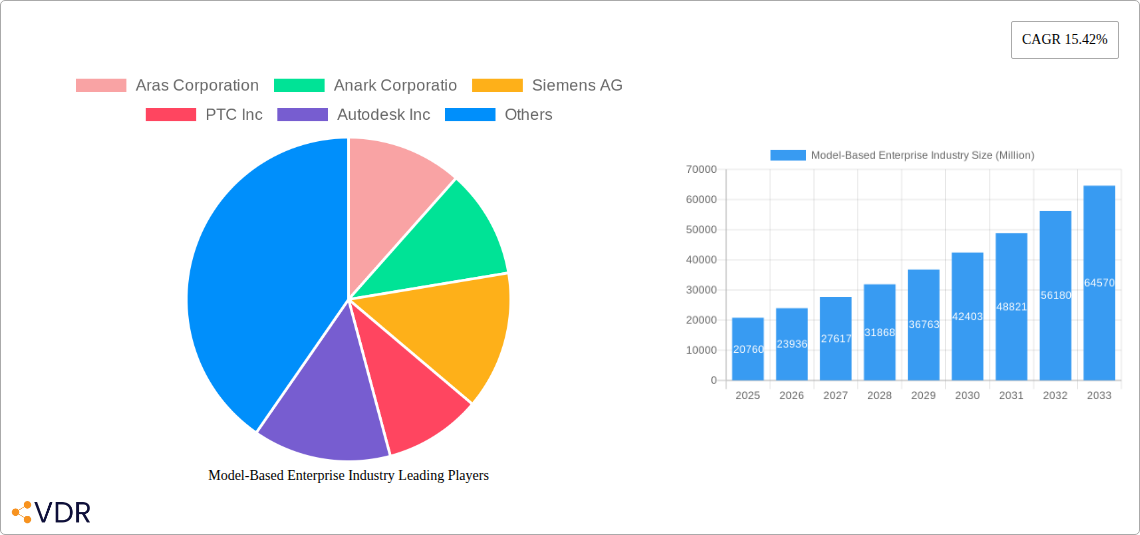
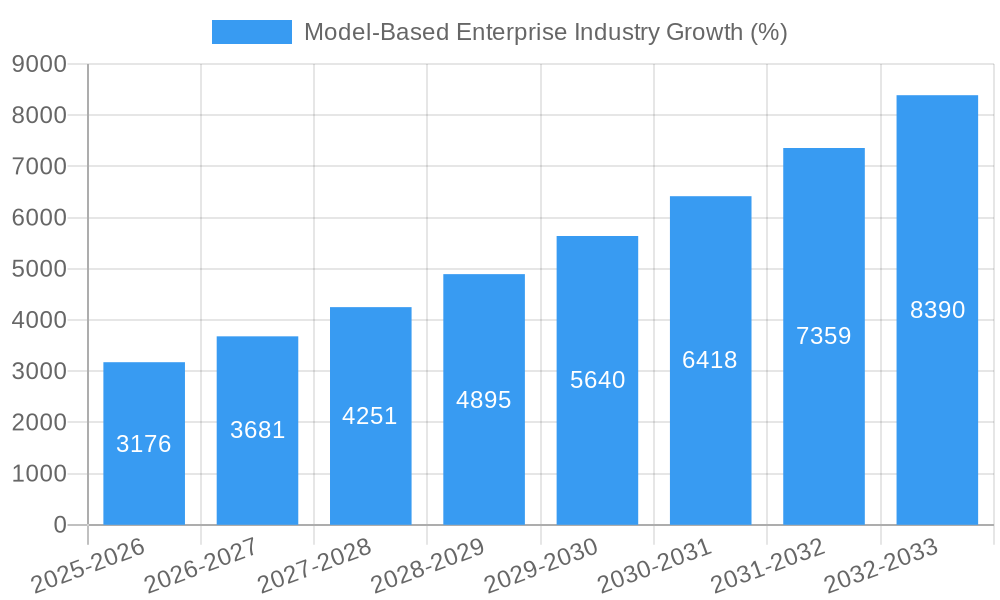
The Model-Based Enterprise (MBE) market is experiencing robust growth, projected to reach $20.76 billion in 2025 and maintain a Compound Annual Growth Rate (CAGR) of 15.42% from 2025 to 2033. This expansion is driven by several key factors. The increasing complexity of products across diverse industries, coupled with the need for enhanced collaboration and efficiency throughout the product lifecycle, fuels the adoption of MBE solutions. Digital transformation initiatives within organizations are accelerating this trend, pushing for streamlined processes and improved data management. Furthermore, the growing demand for advanced simulation and analysis capabilities, enabling better product design and risk mitigation, significantly contributes to market growth. The automotive, aerospace and defense, and energy sectors are major contributors, leveraging MBE to optimize product development and reduce time-to-market. The cloud deployment model is gaining traction, offering scalability and accessibility advantages over on-premise solutions.
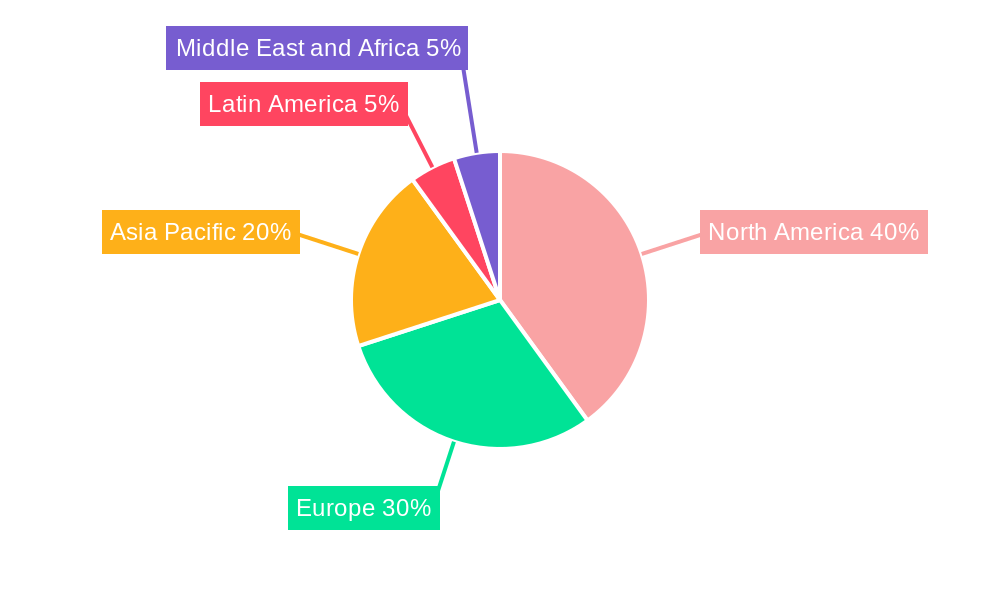
Significant growth opportunities exist within the MBE market, particularly in the Asia-Pacific region, which is projected to witness substantial adoption due to increasing industrialization and technological advancements. While the North American and European markets remain significant contributors, emerging economies in Asia and Latin America are poised for considerable expansion. However, challenges such as the high initial investment costs associated with implementing MBE solutions, the need for skilled workforce training, and the integration complexities with legacy systems could potentially restrain market growth. Despite these challenges, the long-term benefits of improved product quality, reduced costs, and enhanced collaboration outweigh the initial hurdles, solidifying the MBE market's promising future. The competitive landscape is dynamic, with established players like Dassault Systèmes, Siemens, and PTC, alongside emerging technology providers, vying for market share through innovation and strategic partnerships.
Model-Based Enterprise (MBE) Industry Market Report: 2019-2033
This comprehensive report provides an in-depth analysis of the Model-Based Enterprise (MBE) industry, encompassing market dynamics, growth trends, regional performance, competitive landscape, and future outlook. The study period covers 2019-2033, with 2025 serving as the base and estimated year. This report is crucial for industry professionals, investors, and strategic decision-makers seeking a clear understanding of this rapidly evolving sector. The report analyzes the parent market of Enterprise Software and the child market of Model-Based Enterprise, providing granular insights into various segments. The total market size in 2025 is estimated at xx Million and is projected to reach xx Million by 2033.
Model-Based Enterprise Industry Market Dynamics & Structure
The MBE market is characterized by moderate concentration, with key players like Aras Corporation, Anark Corporation, Siemens AG, PTC Inc, Autodesk Inc, Oracle Corporation, Dassault Systèmes SE, General Electric Company, HCL Technologies Limited, and SAP SE holding significant market share. Technological innovation, particularly in areas like AI and digital twins, is a key driver. Regulatory frameworks, including data privacy regulations, influence market growth. Competitive pressures stem from the emergence of cloud-based solutions and open-source alternatives.
- Market Concentration: Moderate, with the top 5 players holding approximately 60% market share in 2025 (estimated).
- Technological Innovation: AI-powered design optimization, digital twin technology, and improved data analytics are key drivers.
- Regulatory Framework: Compliance with data privacy regulations (e.g., GDPR) influences adoption rates and security protocols.
- Competitive Substitutes: Cloud-based solutions and open-source alternatives pose competitive pressure.
- End-User Demographics: Aerospace & Defense, Automotive, and Construction sectors are key end-users.
- M&A Trends: Strategic acquisitions to expand product portfolios and market reach are increasingly common, with approximately xx M&A deals recorded in the historical period (2019-2024).
Model-Based Enterprise Industry Growth Trends & Insights
The MBE market experienced significant growth during the historical period (2019-2024), driven by increasing adoption of digital transformation initiatives across various industries. The market size increased from xx Million in 2019 to xx Million in 2024, exhibiting a CAGR of xx%. This growth is fueled by factors such as rising demand for improved product development efficiency, enhanced collaboration across engineering teams, and the need for better data management. The cloud-based deployment model is experiencing rapid growth, driven by scalability and cost-effectiveness, while the adoption of MBE solutions is highest in developed economies due to higher digital maturity levels. The forecast period (2025-2033) projects continued expansion, driven by emerging technologies like AI and IoT integration within MBE platforms. Market penetration is expected to reach xx% by 2033, with a projected CAGR of xx%.
Dominant Regions, Countries, or Segments in Model-Based Enterprise Industry
North America holds the largest market share in the MBE industry, followed by Europe and Asia-Pacific. The automotive and aerospace & defense sectors are the dominant end-users globally. Within the offering segment, solutions hold a larger market share compared to services, reflecting a strong preference for integrated platforms. The cloud deployment model is experiencing the highest growth rate, fueled by cost-effectiveness and improved accessibility.
- Key Drivers (North America): Strong technological advancement, high investments in R&D, presence of major players.
- Key Drivers (Europe): High adoption in manufacturing sectors, supportive government policies.
- Key Drivers (Asia-Pacific): Rapid industrialization, increasing adoption in emerging economies.
- Segment Dominance: Solutions (65% market share in 2025), Cloud Deployment (40% growth CAGR from 2025-2033), Automotive (25% of the end-user market).
Model-Based Enterprise Industry Product Landscape
The MBE product landscape features a range of software solutions, including integrated platforms, specialized tools, and cloud-based services. These solutions offer functionalities such as requirements management, model-based design, simulation, and verification. Key innovations include AI-powered design optimization, digital twin technology for real-time monitoring and analysis, and enhanced collaboration tools. The focus is on improving product development efficiency, reducing time-to-market, and minimizing errors. Unique selling propositions often revolve around specific industry expertise, seamless integration with existing systems, and robust security features.
Key Drivers, Barriers & Challenges in Model-Based Enterprise Industry
Key Drivers: Digital transformation initiatives across various industries, increasing demand for improved product development efficiency, rising adoption of cloud-based solutions, and government support for technological advancements in manufacturing.
Key Challenges: High initial investment costs for implementing MBE solutions, lack of skilled workforce to manage and utilize MBE platforms, data security concerns related to sensitive product designs, and integration challenges with legacy systems. The competitive landscape also presents a challenge, with numerous players vying for market share. The impact of these challenges results in a xx Million revenue shortfall (estimated) in 2025.
Emerging Opportunities in Model-Based Enterprise Industry
Emerging opportunities lie in integrating MBE with IoT and AI technologies, expanding into untapped markets (e.g., healthcare and energy), development of MBE solutions for smaller enterprises and startups, and greater focus on sustainable manufacturing practices. The growing need for digital twins in various industries also represents a significant opportunity.
Growth Accelerators in the Model-Based Enterprise Industry Industry
Technological breakthroughs in areas such as AI and machine learning will significantly accelerate MBE market growth. Strategic partnerships between MBE providers and industry leaders will facilitate widespread adoption. Expansion into new geographical markets and the development of industry-specific solutions will further propel market expansion.
Key Players Shaping the Model-Based Enterprise Industry Market
- Aras Corporation
- Anark Corporation
- Siemens AG
- PTC Inc
- Autodesk Inc
- Oracle Corporation
- Dassault Systèmes SE
- General Electric Company
- HCL Technologies Limited
- SAP SE
Notable Milestones in Model-Based Enterprise Industry Sector
- September 2023: Tech Soft 3D launched iBase-t, integrating HOOPS Exchange for streamlined product development and maintenance.
- May 2023: Agacad acquired SBS Group, expanding its BIM solutions to include project planning and cost management tools.
In-Depth Model-Based Enterprise Industry Market Outlook
The MBE market is poised for robust growth, driven by technological advancements and increased digitalization across industries. The integration of AI and digital twin technologies will further enhance the capabilities of MBE platforms, leading to increased adoption. Strategic partnerships and expansion into new markets will play a crucial role in shaping the future of the MBE landscape. This robust growth is projected to continue throughout the forecast period, offering significant opportunities for both established players and emerging entrants.
Model-Based Enterprise Industry Segmentation
-
1. Offering
- 1.1. Solutions
- 1.2. Services
-
2. Deployment Mode
- 2.1. On-premise
- 2.2. Cloud
-
3. End User
- 3.1. Aerospace and Defense
- 3.2. Automotive
- 3.3. Construction
- 3.4. Power and Energy
- 3.5. Retail
- 3.6. Other End Users
Model-Based Enterprise Industry Segmentation By Geography
- 1. North America
- 2. Europe
- 3. Asia Pacific
- 4. Latin America
- 5. Middle East and Africa
Model-Based Enterprise Industry REPORT HIGHLIGHTS
| Aspects | Details |
|---|---|
| Study Period | 2019-2033 |
| Base Year | 2024 |
| Estimated Year | 2025 |
| Forecast Period | 2025-2033 |
| Historical Period | 2019-2024 |
| Growth Rate | CAGR of 15.42% from 2019-2033 |
| Segmentation |
|
Table of Contents
- 1. Introduction
- 1.1. Research Scope
- 1.2. Market Segmentation
- 1.3. Research Methodology
- 1.4. Definitions and Assumptions
- 2. Executive Summary
- 2.1. Introduction
- 3. Market Dynamics
- 3.1. Introduction
- 3.2. Market Drivers
- 3.2.1. Evolving Software Capabilities; Rising Adoption of IoT and Cloud-based Platforms
- 3.3. Market Restrains
- 3.3.1 Shortage of Skilled Workers
- 3.3.2 Data Security Concerns
- 3.3.3 and the Initial Investment Costs Hinder Business Operations
- 3.4. Market Trends
- 3.4.1. Automotive Sector to Witness Major Growth
- 4. Market Factor Analysis
- 4.1. Porters Five Forces
- 4.2. Supply/Value Chain
- 4.3. PESTEL analysis
- 4.4. Market Entropy
- 4.5. Patent/Trademark Analysis
- 5. Global Model-Based Enterprise Industry Analysis, Insights and Forecast, 2019-2031
- 5.1. Market Analysis, Insights and Forecast - by Offering
- 5.1.1. Solutions
- 5.1.2. Services
- 5.2. Market Analysis, Insights and Forecast - by Deployment Mode
- 5.2.1. On-premise
- 5.2.2. Cloud
- 5.3. Market Analysis, Insights and Forecast - by End User
- 5.3.1. Aerospace and Defense
- 5.3.2. Automotive
- 5.3.3. Construction
- 5.3.4. Power and Energy
- 5.3.5. Retail
- 5.3.6. Other End Users
- 5.4. Market Analysis, Insights and Forecast - by Region
- 5.4.1. North America
- 5.4.2. Europe
- 5.4.3. Asia Pacific
- 5.4.4. Latin America
- 5.4.5. Middle East and Africa
- 5.1. Market Analysis, Insights and Forecast - by Offering
- 6. North America Model-Based Enterprise Industry Analysis, Insights and Forecast, 2019-2031
- 6.1. Market Analysis, Insights and Forecast - by Offering
- 6.1.1. Solutions
- 6.1.2. Services
- 6.2. Market Analysis, Insights and Forecast - by Deployment Mode
- 6.2.1. On-premise
- 6.2.2. Cloud
- 6.3. Market Analysis, Insights and Forecast - by End User
- 6.3.1. Aerospace and Defense
- 6.3.2. Automotive
- 6.3.3. Construction
- 6.3.4. Power and Energy
- 6.3.5. Retail
- 6.3.6. Other End Users
- 6.1. Market Analysis, Insights and Forecast - by Offering
- 7. Europe Model-Based Enterprise Industry Analysis, Insights and Forecast, 2019-2031
- 7.1. Market Analysis, Insights and Forecast - by Offering
- 7.1.1. Solutions
- 7.1.2. Services
- 7.2. Market Analysis, Insights and Forecast - by Deployment Mode
- 7.2.1. On-premise
- 7.2.2. Cloud
- 7.3. Market Analysis, Insights and Forecast - by End User
- 7.3.1. Aerospace and Defense
- 7.3.2. Automotive
- 7.3.3. Construction
- 7.3.4. Power and Energy
- 7.3.5. Retail
- 7.3.6. Other End Users
- 7.1. Market Analysis, Insights and Forecast - by Offering
- 8. Asia Pacific Model-Based Enterprise Industry Analysis, Insights and Forecast, 2019-2031
- 8.1. Market Analysis, Insights and Forecast - by Offering
- 8.1.1. Solutions
- 8.1.2. Services
- 8.2. Market Analysis, Insights and Forecast - by Deployment Mode
- 8.2.1. On-premise
- 8.2.2. Cloud
- 8.3. Market Analysis, Insights and Forecast - by End User
- 8.3.1. Aerospace and Defense
- 8.3.2. Automotive
- 8.3.3. Construction
- 8.3.4. Power and Energy
- 8.3.5. Retail
- 8.3.6. Other End Users
- 8.1. Market Analysis, Insights and Forecast - by Offering
- 9. Latin America Model-Based Enterprise Industry Analysis, Insights and Forecast, 2019-2031
- 9.1. Market Analysis, Insights and Forecast - by Offering
- 9.1.1. Solutions
- 9.1.2. Services
- 9.2. Market Analysis, Insights and Forecast - by Deployment Mode
- 9.2.1. On-premise
- 9.2.2. Cloud
- 9.3. Market Analysis, Insights and Forecast - by End User
- 9.3.1. Aerospace and Defense
- 9.3.2. Automotive
- 9.3.3. Construction
- 9.3.4. Power and Energy
- 9.3.5. Retail
- 9.3.6. Other End Users
- 9.1. Market Analysis, Insights and Forecast - by Offering
- 10. Middle East and Africa Model-Based Enterprise Industry Analysis, Insights and Forecast, 2019-2031
- 10.1. Market Analysis, Insights and Forecast - by Offering
- 10.1.1. Solutions
- 10.1.2. Services
- 10.2. Market Analysis, Insights and Forecast - by Deployment Mode
- 10.2.1. On-premise
- 10.2.2. Cloud
- 10.3. Market Analysis, Insights and Forecast - by End User
- 10.3.1. Aerospace and Defense
- 10.3.2. Automotive
- 10.3.3. Construction
- 10.3.4. Power and Energy
- 10.3.5. Retail
- 10.3.6. Other End Users
- 10.1. Market Analysis, Insights and Forecast - by Offering
- 11. North America Model-Based Enterprise Industry Analysis, Insights and Forecast, 2019-2031
- 11.1. Market Analysis, Insights and Forecast - By Country/Sub-region
- 11.1.1.
- 12. Europe Model-Based Enterprise Industry Analysis, Insights and Forecast, 2019-2031
- 12.1. Market Analysis, Insights and Forecast - By Country/Sub-region
- 12.1.1.
- 13. Asia Pacific Model-Based Enterprise Industry Analysis, Insights and Forecast, 2019-2031
- 13.1. Market Analysis, Insights and Forecast - By Country/Sub-region
- 13.1.1.
- 14. Latin America Model-Based Enterprise Industry Analysis, Insights and Forecast, 2019-2031
- 14.1. Market Analysis, Insights and Forecast - By Country/Sub-region
- 14.1.1.
- 15. Middle East and Africa Model-Based Enterprise Industry Analysis, Insights and Forecast, 2019-2031
- 15.1. Market Analysis, Insights and Forecast - By Country/Sub-region
- 15.1.1.
- 16. Competitive Analysis
- 16.1. Global Market Share Analysis 2024
- 16.2. Company Profiles
- 16.2.1 Aras Corporation
- 16.2.1.1. Overview
- 16.2.1.2. Products
- 16.2.1.3. SWOT Analysis
- 16.2.1.4. Recent Developments
- 16.2.1.5. Financials (Based on Availability)
- 16.2.2 Anark Corporatio
- 16.2.2.1. Overview
- 16.2.2.2. Products
- 16.2.2.3. SWOT Analysis
- 16.2.2.4. Recent Developments
- 16.2.2.5. Financials (Based on Availability)
- 16.2.3 Siemens AG
- 16.2.3.1. Overview
- 16.2.3.2. Products
- 16.2.3.3. SWOT Analysis
- 16.2.3.4. Recent Developments
- 16.2.3.5. Financials (Based on Availability)
- 16.2.4 PTC Inc
- 16.2.4.1. Overview
- 16.2.4.2. Products
- 16.2.4.3. SWOT Analysis
- 16.2.4.4. Recent Developments
- 16.2.4.5. Financials (Based on Availability)
- 16.2.5 Autodesk Inc
- 16.2.5.1. Overview
- 16.2.5.2. Products
- 16.2.5.3. SWOT Analysis
- 16.2.5.4. Recent Developments
- 16.2.5.5. Financials (Based on Availability)
- 16.2.6 Oracle Corporation
- 16.2.6.1. Overview
- 16.2.6.2. Products
- 16.2.6.3. SWOT Analysis
- 16.2.6.4. Recent Developments
- 16.2.6.5. Financials (Based on Availability)
- 16.2.7 Dassault Systèmes SE
- 16.2.7.1. Overview
- 16.2.7.2. Products
- 16.2.7.3. SWOT Analysis
- 16.2.7.4. Recent Developments
- 16.2.7.5. Financials (Based on Availability)
- 16.2.8 General Electric Company
- 16.2.8.1. Overview
- 16.2.8.2. Products
- 16.2.8.3. SWOT Analysis
- 16.2.8.4. Recent Developments
- 16.2.8.5. Financials (Based on Availability)
- 16.2.9 HCL Technologies Limited
- 16.2.9.1. Overview
- 16.2.9.2. Products
- 16.2.9.3. SWOT Analysis
- 16.2.9.4. Recent Developments
- 16.2.9.5. Financials (Based on Availability)
- 16.2.10 SAP SE
- 16.2.10.1. Overview
- 16.2.10.2. Products
- 16.2.10.3. SWOT Analysis
- 16.2.10.4. Recent Developments
- 16.2.10.5. Financials (Based on Availability)
- 16.2.1 Aras Corporation
List of Figures
- Figure 1: Global Model-Based Enterprise Industry Revenue Breakdown (Million, %) by Region 2024 & 2032
- Figure 2: North America Model-Based Enterprise Industry Revenue (Million), by Country 2024 & 2032
- Figure 3: North America Model-Based Enterprise Industry Revenue Share (%), by Country 2024 & 2032
- Figure 4: Europe Model-Based Enterprise Industry Revenue (Million), by Country 2024 & 2032
- Figure 5: Europe Model-Based Enterprise Industry Revenue Share (%), by Country 2024 & 2032
- Figure 6: Asia Pacific Model-Based Enterprise Industry Revenue (Million), by Country 2024 & 2032
- Figure 7: Asia Pacific Model-Based Enterprise Industry Revenue Share (%), by Country 2024 & 2032
- Figure 8: Latin America Model-Based Enterprise Industry Revenue (Million), by Country 2024 & 2032
- Figure 9: Latin America Model-Based Enterprise Industry Revenue Share (%), by Country 2024 & 2032
- Figure 10: Middle East and Africa Model-Based Enterprise Industry Revenue (Million), by Country 2024 & 2032
- Figure 11: Middle East and Africa Model-Based Enterprise Industry Revenue Share (%), by Country 2024 & 2032
- Figure 12: North America Model-Based Enterprise Industry Revenue (Million), by Offering 2024 & 2032
- Figure 13: North America Model-Based Enterprise Industry Revenue Share (%), by Offering 2024 & 2032
- Figure 14: North America Model-Based Enterprise Industry Revenue (Million), by Deployment Mode 2024 & 2032
- Figure 15: North America Model-Based Enterprise Industry Revenue Share (%), by Deployment Mode 2024 & 2032
- Figure 16: North America Model-Based Enterprise Industry Revenue (Million), by End User 2024 & 2032
- Figure 17: North America Model-Based Enterprise Industry Revenue Share (%), by End User 2024 & 2032
- Figure 18: North America Model-Based Enterprise Industry Revenue (Million), by Country 2024 & 2032
- Figure 19: North America Model-Based Enterprise Industry Revenue Share (%), by Country 2024 & 2032
- Figure 20: Europe Model-Based Enterprise Industry Revenue (Million), by Offering 2024 & 2032
- Figure 21: Europe Model-Based Enterprise Industry Revenue Share (%), by Offering 2024 & 2032
- Figure 22: Europe Model-Based Enterprise Industry Revenue (Million), by Deployment Mode 2024 & 2032
- Figure 23: Europe Model-Based Enterprise Industry Revenue Share (%), by Deployment Mode 2024 & 2032
- Figure 24: Europe Model-Based Enterprise Industry Revenue (Million), by End User 2024 & 2032
- Figure 25: Europe Model-Based Enterprise Industry Revenue Share (%), by End User 2024 & 2032
- Figure 26: Europe Model-Based Enterprise Industry Revenue (Million), by Country 2024 & 2032
- Figure 27: Europe Model-Based Enterprise Industry Revenue Share (%), by Country 2024 & 2032
- Figure 28: Asia Pacific Model-Based Enterprise Industry Revenue (Million), by Offering 2024 & 2032
- Figure 29: Asia Pacific Model-Based Enterprise Industry Revenue Share (%), by Offering 2024 & 2032
- Figure 30: Asia Pacific Model-Based Enterprise Industry Revenue (Million), by Deployment Mode 2024 & 2032
- Figure 31: Asia Pacific Model-Based Enterprise Industry Revenue Share (%), by Deployment Mode 2024 & 2032
- Figure 32: Asia Pacific Model-Based Enterprise Industry Revenue (Million), by End User 2024 & 2032
- Figure 33: Asia Pacific Model-Based Enterprise Industry Revenue Share (%), by End User 2024 & 2032
- Figure 34: Asia Pacific Model-Based Enterprise Industry Revenue (Million), by Country 2024 & 2032
- Figure 35: Asia Pacific Model-Based Enterprise Industry Revenue Share (%), by Country 2024 & 2032
- Figure 36: Latin America Model-Based Enterprise Industry Revenue (Million), by Offering 2024 & 2032
- Figure 37: Latin America Model-Based Enterprise Industry Revenue Share (%), by Offering 2024 & 2032
- Figure 38: Latin America Model-Based Enterprise Industry Revenue (Million), by Deployment Mode 2024 & 2032
- Figure 39: Latin America Model-Based Enterprise Industry Revenue Share (%), by Deployment Mode 2024 & 2032
- Figure 40: Latin America Model-Based Enterprise Industry Revenue (Million), by End User 2024 & 2032
- Figure 41: Latin America Model-Based Enterprise Industry Revenue Share (%), by End User 2024 & 2032
- Figure 42: Latin America Model-Based Enterprise Industry Revenue (Million), by Country 2024 & 2032
- Figure 43: Latin America Model-Based Enterprise Industry Revenue Share (%), by Country 2024 & 2032
- Figure 44: Middle East and Africa Model-Based Enterprise Industry Revenue (Million), by Offering 2024 & 2032
- Figure 45: Middle East and Africa Model-Based Enterprise Industry Revenue Share (%), by Offering 2024 & 2032
- Figure 46: Middle East and Africa Model-Based Enterprise Industry Revenue (Million), by Deployment Mode 2024 & 2032
- Figure 47: Middle East and Africa Model-Based Enterprise Industry Revenue Share (%), by Deployment Mode 2024 & 2032
- Figure 48: Middle East and Africa Model-Based Enterprise Industry Revenue (Million), by End User 2024 & 2032
- Figure 49: Middle East and Africa Model-Based Enterprise Industry Revenue Share (%), by End User 2024 & 2032
- Figure 50: Middle East and Africa Model-Based Enterprise Industry Revenue (Million), by Country 2024 & 2032
- Figure 51: Middle East and Africa Model-Based Enterprise Industry Revenue Share (%), by Country 2024 & 2032
List of Tables
- Table 1: Global Model-Based Enterprise Industry Revenue Million Forecast, by Region 2019 & 2032
- Table 2: Global Model-Based Enterprise Industry Revenue Million Forecast, by Offering 2019 & 2032
- Table 3: Global Model-Based Enterprise Industry Revenue Million Forecast, by Deployment Mode 2019 & 2032
- Table 4: Global Model-Based Enterprise Industry Revenue Million Forecast, by End User 2019 & 2032
- Table 5: Global Model-Based Enterprise Industry Revenue Million Forecast, by Region 2019 & 2032
- Table 6: Global Model-Based Enterprise Industry Revenue Million Forecast, by Country 2019 & 2032
- Table 7: Model-Based Enterprise Industry Revenue (Million) Forecast, by Application 2019 & 2032
- Table 8: Global Model-Based Enterprise Industry Revenue Million Forecast, by Country 2019 & 2032
- Table 9: Model-Based Enterprise Industry Revenue (Million) Forecast, by Application 2019 & 2032
- Table 10: Global Model-Based Enterprise Industry Revenue Million Forecast, by Country 2019 & 2032
- Table 11: Model-Based Enterprise Industry Revenue (Million) Forecast, by Application 2019 & 2032
- Table 12: Global Model-Based Enterprise Industry Revenue Million Forecast, by Country 2019 & 2032
- Table 13: Model-Based Enterprise Industry Revenue (Million) Forecast, by Application 2019 & 2032
- Table 14: Global Model-Based Enterprise Industry Revenue Million Forecast, by Country 2019 & 2032
- Table 15: Model-Based Enterprise Industry Revenue (Million) Forecast, by Application 2019 & 2032
- Table 16: Global Model-Based Enterprise Industry Revenue Million Forecast, by Offering 2019 & 2032
- Table 17: Global Model-Based Enterprise Industry Revenue Million Forecast, by Deployment Mode 2019 & 2032
- Table 18: Global Model-Based Enterprise Industry Revenue Million Forecast, by End User 2019 & 2032
- Table 19: Global Model-Based Enterprise Industry Revenue Million Forecast, by Country 2019 & 2032
- Table 20: Global Model-Based Enterprise Industry Revenue Million Forecast, by Offering 2019 & 2032
- Table 21: Global Model-Based Enterprise Industry Revenue Million Forecast, by Deployment Mode 2019 & 2032
- Table 22: Global Model-Based Enterprise Industry Revenue Million Forecast, by End User 2019 & 2032
- Table 23: Global Model-Based Enterprise Industry Revenue Million Forecast, by Country 2019 & 2032
- Table 24: Global Model-Based Enterprise Industry Revenue Million Forecast, by Offering 2019 & 2032
- Table 25: Global Model-Based Enterprise Industry Revenue Million Forecast, by Deployment Mode 2019 & 2032
- Table 26: Global Model-Based Enterprise Industry Revenue Million Forecast, by End User 2019 & 2032
- Table 27: Global Model-Based Enterprise Industry Revenue Million Forecast, by Country 2019 & 2032
- Table 28: Global Model-Based Enterprise Industry Revenue Million Forecast, by Offering 2019 & 2032
- Table 29: Global Model-Based Enterprise Industry Revenue Million Forecast, by Deployment Mode 2019 & 2032
- Table 30: Global Model-Based Enterprise Industry Revenue Million Forecast, by End User 2019 & 2032
- Table 31: Global Model-Based Enterprise Industry Revenue Million Forecast, by Country 2019 & 2032
- Table 32: Global Model-Based Enterprise Industry Revenue Million Forecast, by Offering 2019 & 2032
- Table 33: Global Model-Based Enterprise Industry Revenue Million Forecast, by Deployment Mode 2019 & 2032
- Table 34: Global Model-Based Enterprise Industry Revenue Million Forecast, by End User 2019 & 2032
- Table 35: Global Model-Based Enterprise Industry Revenue Million Forecast, by Country 2019 & 2032
Frequently Asked Questions
1. What is the projected Compound Annual Growth Rate (CAGR) of the Model-Based Enterprise Industry?
The projected CAGR is approximately 15.42%.
2. Which companies are prominent players in the Model-Based Enterprise Industry?
Key companies in the market include Aras Corporation, Anark Corporatio, Siemens AG, PTC Inc, Autodesk Inc, Oracle Corporation, Dassault Systèmes SE, General Electric Company, HCL Technologies Limited, SAP SE.
3. What are the main segments of the Model-Based Enterprise Industry?
The market segments include Offering, Deployment Mode, End User.
4. Can you provide details about the market size?
The market size is estimated to be USD 20.76 Million as of 2022.
5. What are some drivers contributing to market growth?
Evolving Software Capabilities; Rising Adoption of IoT and Cloud-based Platforms.
6. What are the notable trends driving market growth?
Automotive Sector to Witness Major Growth.
7. Are there any restraints impacting market growth?
Shortage of Skilled Workers. Data Security Concerns. and the Initial Investment Costs Hinder Business Operations.
8. Can you provide examples of recent developments in the market?
September 2023 - Tech Soft 3D, the provider of engineering software development toolkits, introduced iBase-t, which assists its users in simplifying how complex products are built and maintained. It integrated HOOPS Exchange, the CAD import and export library, into iBase-t's Solumina iSeries Manufacturing Operations Platform.
9. What pricing options are available for accessing the report?
Pricing options include single-user, multi-user, and enterprise licenses priced at USD 4750, USD 5250, and USD 8750 respectively.
10. Is the market size provided in terms of value or volume?
The market size is provided in terms of value, measured in Million.
11. Are there any specific market keywords associated with the report?
Yes, the market keyword associated with the report is "Model-Based Enterprise Industry," which aids in identifying and referencing the specific market segment covered.
12. How do I determine which pricing option suits my needs best?
The pricing options vary based on user requirements and access needs. Individual users may opt for single-user licenses, while businesses requiring broader access may choose multi-user or enterprise licenses for cost-effective access to the report.
13. Are there any additional resources or data provided in the Model-Based Enterprise Industry report?
While the report offers comprehensive insights, it's advisable to review the specific contents or supplementary materials provided to ascertain if additional resources or data are available.
14. How can I stay updated on further developments or reports in the Model-Based Enterprise Industry?
To stay informed about further developments, trends, and reports in the Model-Based Enterprise Industry, consider subscribing to industry newsletters, following relevant companies and organizations, or regularly checking reputable industry news sources and publications.
Methodology
Step 1 - Identification of Relevant Samples Size from Population Database


Step 2 - Approaches for Defining Global Market Size (Value, Volume* & Price*)

Note*: In applicable scenarios
Step 3 - Data Sources
Primary Research
- Web Analytics
- Survey Reports
- Research Institute
- Latest Research Reports
- Opinion Leaders
Secondary Research
- Annual Reports
- White Paper
- Latest Press Release
- Industry Association
- Paid Database
- Investor Presentations

Step 4 - Data Triangulation
Involves using different sources of information in order to increase the validity of a study
These sources are likely to be stakeholders in a program - participants, other researchers, program staff, other community members, and so on.
Then we put all data in single framework & apply various statistical tools to find out the dynamic on the market.
During the analysis stage, feedback from the stakeholder groups would be compared to determine areas of agreement as well as areas of divergence


