
Key Insights
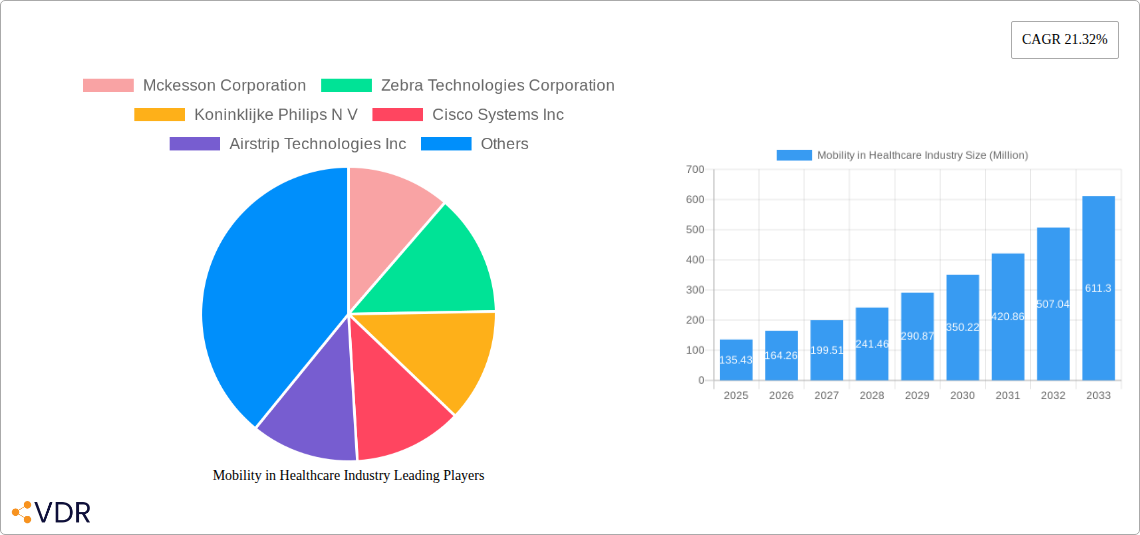
The global mobility in healthcare market, valued at $135.43 million in 2025, is projected to experience robust growth, driven by the increasing adoption of mobile technologies across healthcare settings. This expansion is fueled by several key factors. The rising demand for remote patient monitoring (RPM) solutions, particularly in the wake of the COVID-19 pandemic, is significantly boosting market growth. Improved patient engagement through mobile applications offering telehealth consultations, medication reminders, and health tracking features enhances care accessibility and adherence. Furthermore, the integration of mobile devices with Electronic Health Records (EHRs) streamlines workflows and improves data management for healthcare providers. The growth is also spurred by the increasing penetration of smartphones and the expanding availability of high-speed internet access, especially in developing economies. Different segments are contributing to this expansion with strong growth in enterprise mobility platforms which enable secure communication and data access within healthcare organizations, and mobile applications providing a personalized and convenient experience for both patients and providers.
However, several challenges restrain market growth. Concerns regarding data security and privacy remain paramount, as the use of mobile devices and applications requires robust security measures to protect sensitive patient information. Interoperability issues between different mobile health platforms can hinder seamless data exchange and integration, potentially leading to fragmented care. High initial investment costs associated with implementing and maintaining mobile health solutions can be a barrier to entry for smaller healthcare providers. Despite these challenges, the long-term growth outlook for the mobility in healthcare market remains positive, largely driven by technological advancements, increasing healthcare expenditure, and a global shift toward value-based care models. The market is expected to witness substantial growth in areas like mHealth and wearable technology integration, further propelling the market's trajectory in the coming years. Strategic partnerships between technology companies and healthcare providers will play a crucial role in overcoming the existing challenges and accelerating market growth.
Mobility in Healthcare Industry: Market Report 2019-2033
This comprehensive report provides a detailed analysis of the Mobility in Healthcare Industry market, encompassing its dynamics, growth trends, dominant segments, and future outlook. The study period covers 2019-2033, with a base year of 2025 and a forecast period of 2025-2033. We analyze the parent market of Healthcare IT and its child market of Mobile Health (mHealth) to deliver actionable insights for industry professionals. The report values are presented in million units.
Keywords: Mobility in Healthcare, mHealth, Healthcare IT, Mobile Medical Apps, Telehealth, Enterprise Mobility Platforms, Mobile Devices, Healthcare Technology, Digital Health, Patient Engagement, Workforce Management, Payers, Providers, Patients, McKesson, Zebra Technologies, Philips, Cisco, Airstrip Technologies, Omron, AT&T, SAP, Oracle Cerner.
Mobility in Healthcare Industry Market Dynamics & Structure
The Mobility in Healthcare Industry is characterized by a moderately concentrated market structure with a few major players holding significant market share. The market size in 2025 is estimated at $XX million. Technological innovation, particularly in areas like AI-powered diagnostics and remote patient monitoring, is a key driver. Regulatory frameworks, varying across regions, significantly influence market penetration. Competitive substitutes include traditional methods of healthcare delivery, impacting market growth. End-user demographics, with aging populations and increasing tech adoption, fuel demand. M&A activity remains strong, with an estimated XX deals in 2024, consolidating market share and driving innovation.
- Market Concentration: High concentration with top 5 players holding approximately XX% market share in 2024.
- Technological Innovation: AI, IoT, and 5G are driving new applications and improving efficiency.
- Regulatory Landscape: HIPAA compliance and data privacy regulations influence product development and adoption.
- Competitive Substitutes: Traditional healthcare models pose a challenge to market penetration.
- End-User Demographics: Aging populations and rising smartphone penetration create substantial growth opportunities.
- M&A Trends: XX M&A deals in 2024 indicate a trend of market consolidation and expansion.
Mobility in Healthcare Industry Growth Trends & Insights
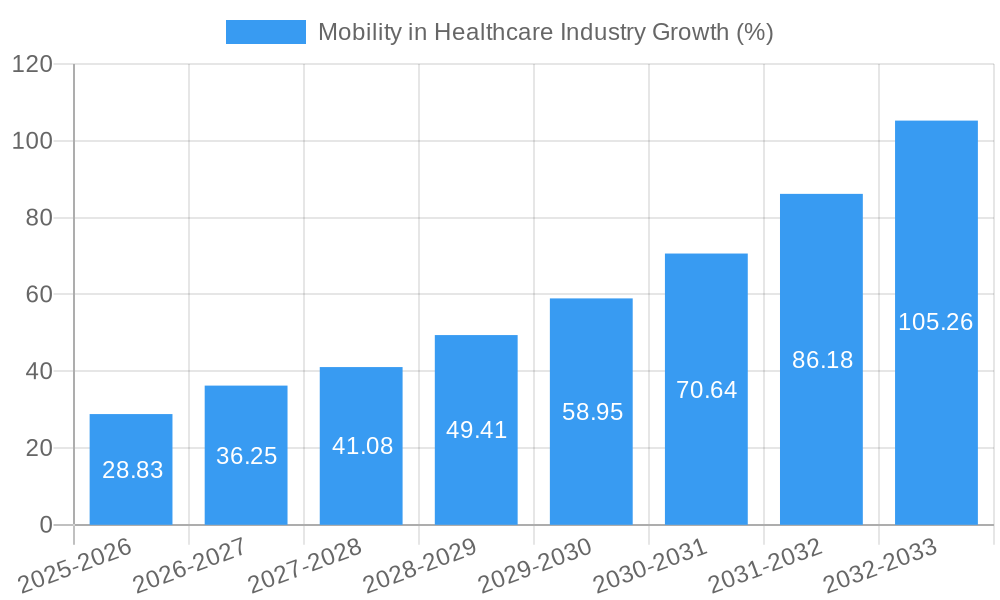
The Mobility in Healthcare market experienced significant growth from 2019 to 2024, with a CAGR of XX%. This growth is attributed to increasing adoption of mobile health technologies by both providers and patients. Factors like the rising prevalence of chronic diseases, the need for improved healthcare access, and advancements in mobile technology are fueling market expansion. The market is expected to continue its upward trajectory during the forecast period, reaching an estimated value of $XX million by 2033. Technological disruptions, such as the integration of AI and machine learning, are further accelerating growth. Consumer behavior is shifting towards greater self-management of health and increased reliance on digital health tools.
- Market Size Evolution: From $XX million in 2019 to an estimated $XX million in 2025, expected to reach $XX million by 2033.
- Adoption Rates: Increased adoption by providers and patients, driven by convenience and efficiency gains.
- Technological Disruptions: Integration of AI, IoT, and big data analytics are transforming the landscape.
- Consumer Behavior Shifts: Patients are increasingly proactive in managing their health through mobile apps and devices.
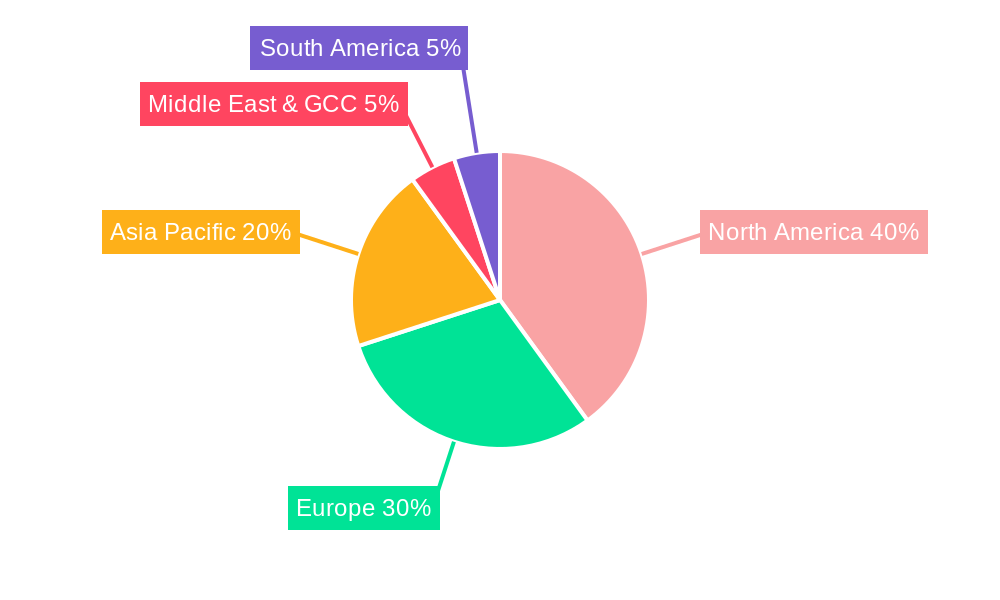
Dominant Regions, Countries, or Segments in Mobility in Healthcare Industry
North America currently holds the largest market share, driven by high technology adoption, robust healthcare infrastructure, and favorable regulatory environments. Within the segments, Enterprise Mobility Platforms and mHealth applications are showing the strongest growth. The provider segment is the largest end-user group, followed by payers and then patients.
- Leading Region: North America, followed by Europe and Asia-Pacific.
- Key Drivers: Strong healthcare IT infrastructure, favorable regulatory environment, high technological adoption rates, government initiatives.
- Dominant Segments: Enterprise Mobility Platforms and mHealth Applications.
- Largest End-User Group: Providers, followed by payers and patients.
Mobility in Healthcare Industry Product Landscape
The product landscape is characterized by a wide range of offerings, including enterprise mobility platforms, mobile applications for various clinical and administrative tasks, and specialized mobile devices such as telehealth carts and patient monitoring systems. Products emphasize user-friendliness, data security, and seamless integration with existing healthcare systems. Technological advancements focus on enhanced functionality, improved data analytics, and greater personalization for optimal patient care.
Key Drivers, Barriers & Challenges in Mobility in Healthcare Industry
Key Drivers:
- Growing demand for remote patient monitoring and telehealth.
- Increasing adoption of electronic health records (EHRs).
- Government initiatives promoting the use of mobile health technologies.
Key Challenges & Restraints:
- Data security and privacy concerns.
- Interoperability issues between different healthcare systems.
- High initial investment costs for implementing mobile health solutions.
- Regulatory hurdles and compliance requirements.
- The uneven distribution of mobile health infrastructure globally. This results in a limited reach in underserved areas. This is impacting the growth rate by approximately XX% annually.
Emerging Opportunities in Mobility in Healthcare Industry
- Expansion into untapped markets in developing countries.
- Development of innovative applications for chronic disease management.
- Increased focus on patient engagement and personalized medicine.
- Integration of wearables and other connected devices.
Growth Accelerators in the Mobility in Healthcare Industry
Technological advancements, strategic partnerships between technology companies and healthcare providers, and expansion into new markets are key growth accelerators. The increasing adoption of cloud-based solutions and the development of interoperable platforms will further drive market expansion. Government initiatives promoting digital health and telehealth are expected to play a crucial role in accelerating growth.
Key Players Shaping the Mobility in Healthcare Industry Market
- McKesson Corporation
- Zebra Technologies Corporation
- Koninklijke Philips N V
- Cisco Systems Inc
- Airstrip Technologies Inc
- Omron Corporation
- AT&T Inc
- SAP SE
- Oracle Cerner
Notable Milestones in Mobility in Healthcare Industry Sector
- August 2022: Indonesia's Health Ministry launched the Indonesia Health Services platform, signifying a significant push towards digital health transformation.
- June 2022: athenahealth launched its athenaOne Voice Assistant, enhancing clinical workflow efficiency through voice-driven technology.
In-Depth Mobility in Healthcare Industry Market Outlook
The Mobility in Healthcare Industry is poised for continued growth, driven by technological innovations, increasing adoption rates, and supportive government policies. Strategic partnerships and expansion into untapped markets will further unlock significant market potential. The focus on improving patient outcomes through personalized and proactive healthcare will create numerous opportunities for companies in this dynamic sector. The market is expected to see significant growth through 2033.
Mobility in Healthcare Industry Segmentation
-
1. Products and Services
- 1.1. Enterprise Mobility Platforms
- 1.2. Mobile Applications (Apps)
- 1.3. Mobile Devices
-
2. Application
-
2.1. Enterprise Solutions
- 2.1.1. Operation Management
- 2.1.2. Patient Care Management
- 2.1.3. Work Force Management
- 2.2. mHealth Applications
-
2.1. Enterprise Solutions
-
3. End User
- 3.1. Payers
- 3.2. Providers
- 3.3. Patients
Mobility in Healthcare Industry Segmentation By Geography
-
1. North America
- 1.1. United States
- 1.2. Canada
- 1.3. Mexico
-
2. Europe
- 2.1. Germany
- 2.2. United Kingdom
- 2.3. France
- 2.4. Italy
- 2.5. Spain
- 2.6. Rest of Europe
-
3. Asia Pacific
- 3.1. China
- 3.2. Japan
- 3.3. India
- 3.4. Australia
- 3.5. South Korea
- 3.6. Rest of Asia Pacific
- 4. Middle East
-
5. GCC
- 5.1. South Africa
- 5.2. Rest of Middle East
-
6. South America
- 6.1. Brazil
- 6.2. Argentina
- 6.3. Rest of South America
Mobility in Healthcare Industry REPORT HIGHLIGHTS
| Aspects | Details |
|---|---|
| Study Period | 2019-2033 |
| Base Year | 2024 |
| Estimated Year | 2025 |
| Forecast Period | 2025-2033 |
| Historical Period | 2019-2024 |
| Growth Rate | CAGR of 21.32% from 2019-2033 |
| Segmentation |
|
Table of Contents
- 1. Introduction
- 1.1. Research Scope
- 1.2. Market Segmentation
- 1.3. Research Methodology
- 1.4. Definitions and Assumptions
- 2. Executive Summary
- 2.1. Introduction
- 3. Market Dynamics
- 3.1. Introduction
- 3.2. Market Drivers
- 3.2.1 Increasing Utilization of the Smart Devices (Smartphones
- 3.2.2 Smart watches
- 3.2.3 etc.); Increased Influence of the Social Media on Healthcare; Rise in the Demand of Personalized Medicines
- 3.3. Market Restrains
- 3.3.1. Safety and Security Issues Associated with Patient Health Information; Lack of Skilled Professionals
- 3.4. Market Trends
- 3.4.1. Patient Care Management Segment is Expected to Witness a Healthy Growth Over the Forecast Period
- 4. Market Factor Analysis
- 4.1. Porters Five Forces
- 4.2. Supply/Value Chain
- 4.3. PESTEL analysis
- 4.4. Market Entropy
- 4.5. Patent/Trademark Analysis
- 5. Global Mobility in Healthcare Industry Analysis, Insights and Forecast, 2019-2031
- 5.1. Market Analysis, Insights and Forecast - by Products and Services
- 5.1.1. Enterprise Mobility Platforms
- 5.1.2. Mobile Applications (Apps)
- 5.1.3. Mobile Devices
- 5.2. Market Analysis, Insights and Forecast - by Application
- 5.2.1. Enterprise Solutions
- 5.2.1.1. Operation Management
- 5.2.1.2. Patient Care Management
- 5.2.1.3. Work Force Management
- 5.2.2. mHealth Applications
- 5.2.1. Enterprise Solutions
- 5.3. Market Analysis, Insights and Forecast - by End User
- 5.3.1. Payers
- 5.3.2. Providers
- 5.3.3. Patients
- 5.4. Market Analysis, Insights and Forecast - by Region
- 5.4.1. North America
- 5.4.2. Europe
- 5.4.3. Asia Pacific
- 5.4.4. Middle East
- 5.4.5. GCC
- 5.4.6. South America
- 5.1. Market Analysis, Insights and Forecast - by Products and Services
- 6. North America Mobility in Healthcare Industry Analysis, Insights and Forecast, 2019-2031
- 6.1. Market Analysis, Insights and Forecast - by Products and Services
- 6.1.1. Enterprise Mobility Platforms
- 6.1.2. Mobile Applications (Apps)
- 6.1.3. Mobile Devices
- 6.2. Market Analysis, Insights and Forecast - by Application
- 6.2.1. Enterprise Solutions
- 6.2.1.1. Operation Management
- 6.2.1.2. Patient Care Management
- 6.2.1.3. Work Force Management
- 6.2.2. mHealth Applications
- 6.2.1. Enterprise Solutions
- 6.3. Market Analysis, Insights and Forecast - by End User
- 6.3.1. Payers
- 6.3.2. Providers
- 6.3.3. Patients
- 6.1. Market Analysis, Insights and Forecast - by Products and Services
- 7. Europe Mobility in Healthcare Industry Analysis, Insights and Forecast, 2019-2031
- 7.1. Market Analysis, Insights and Forecast - by Products and Services
- 7.1.1. Enterprise Mobility Platforms
- 7.1.2. Mobile Applications (Apps)
- 7.1.3. Mobile Devices
- 7.2. Market Analysis, Insights and Forecast - by Application
- 7.2.1. Enterprise Solutions
- 7.2.1.1. Operation Management
- 7.2.1.2. Patient Care Management
- 7.2.1.3. Work Force Management
- 7.2.2. mHealth Applications
- 7.2.1. Enterprise Solutions
- 7.3. Market Analysis, Insights and Forecast - by End User
- 7.3.1. Payers
- 7.3.2. Providers
- 7.3.3. Patients
- 7.1. Market Analysis, Insights and Forecast - by Products and Services
- 8. Asia Pacific Mobility in Healthcare Industry Analysis, Insights and Forecast, 2019-2031
- 8.1. Market Analysis, Insights and Forecast - by Products and Services
- 8.1.1. Enterprise Mobility Platforms
- 8.1.2. Mobile Applications (Apps)
- 8.1.3. Mobile Devices
- 8.2. Market Analysis, Insights and Forecast - by Application
- 8.2.1. Enterprise Solutions
- 8.2.1.1. Operation Management
- 8.2.1.2. Patient Care Management
- 8.2.1.3. Work Force Management
- 8.2.2. mHealth Applications
- 8.2.1. Enterprise Solutions
- 8.3. Market Analysis, Insights and Forecast - by End User
- 8.3.1. Payers
- 8.3.2. Providers
- 8.3.3. Patients
- 8.1. Market Analysis, Insights and Forecast - by Products and Services
- 9. Middle East Mobility in Healthcare Industry Analysis, Insights and Forecast, 2019-2031
- 9.1. Market Analysis, Insights and Forecast - by Products and Services
- 9.1.1. Enterprise Mobility Platforms
- 9.1.2. Mobile Applications (Apps)
- 9.1.3. Mobile Devices
- 9.2. Market Analysis, Insights and Forecast - by Application
- 9.2.1. Enterprise Solutions
- 9.2.1.1. Operation Management
- 9.2.1.2. Patient Care Management
- 9.2.1.3. Work Force Management
- 9.2.2. mHealth Applications
- 9.2.1. Enterprise Solutions
- 9.3. Market Analysis, Insights and Forecast - by End User
- 9.3.1. Payers
- 9.3.2. Providers
- 9.3.3. Patients
- 9.1. Market Analysis, Insights and Forecast - by Products and Services
- 10. GCC Mobility in Healthcare Industry Analysis, Insights and Forecast, 2019-2031
- 10.1. Market Analysis, Insights and Forecast - by Products and Services
- 10.1.1. Enterprise Mobility Platforms
- 10.1.2. Mobile Applications (Apps)
- 10.1.3. Mobile Devices
- 10.2. Market Analysis, Insights and Forecast - by Application
- 10.2.1. Enterprise Solutions
- 10.2.1.1. Operation Management
- 10.2.1.2. Patient Care Management
- 10.2.1.3. Work Force Management
- 10.2.2. mHealth Applications
- 10.2.1. Enterprise Solutions
- 10.3. Market Analysis, Insights and Forecast - by End User
- 10.3.1. Payers
- 10.3.2. Providers
- 10.3.3. Patients
- 10.1. Market Analysis, Insights and Forecast - by Products and Services
- 11. South America Mobility in Healthcare Industry Analysis, Insights and Forecast, 2019-2031
- 11.1. Market Analysis, Insights and Forecast - by Products and Services
- 11.1.1. Enterprise Mobility Platforms
- 11.1.2. Mobile Applications (Apps)
- 11.1.3. Mobile Devices
- 11.2. Market Analysis, Insights and Forecast - by Application
- 11.2.1. Enterprise Solutions
- 11.2.1.1. Operation Management
- 11.2.1.2. Patient Care Management
- 11.2.1.3. Work Force Management
- 11.2.2. mHealth Applications
- 11.2.1. Enterprise Solutions
- 11.3. Market Analysis, Insights and Forecast - by End User
- 11.3.1. Payers
- 11.3.2. Providers
- 11.3.3. Patients
- 11.1. Market Analysis, Insights and Forecast - by Products and Services
- 12. North America Mobility in Healthcare Industry Analysis, Insights and Forecast, 2019-2031
- 12.1. Market Analysis, Insights and Forecast - By Country/Sub-region
- 12.1.1. undefined
- 13. Europe Mobility in Healthcare Industry Analysis, Insights and Forecast, 2019-2031
- 13.1. Market Analysis, Insights and Forecast - By Country/Sub-region
- 13.1.1. undefined
- 14. Asia Pacific Mobility in Healthcare Industry Analysis, Insights and Forecast, 2019-2031
- 14.1. Market Analysis, Insights and Forecast - By Country/Sub-region
- 14.1.1. undefined
- 15. Middle East Mobility in Healthcare Industry Analysis, Insights and Forecast, 2019-2031
- 15.1. Market Analysis, Insights and Forecast - By Country/Sub-region
- 15.1.1. undefined
- 16. GCC Mobility in Healthcare Industry Analysis, Insights and Forecast, 2019-2031
- 16.1. Market Analysis, Insights and Forecast - By Country/Sub-region
- 16.1.1. undefined
- 17. South America Mobility in Healthcare Industry Analysis, Insights and Forecast, 2019-2031
- 17.1. Market Analysis, Insights and Forecast - By Country/Sub-region
- 17.1.1. undefined
- 18. Competitive Analysis
- 18.1. Global Market Share Analysis 2024
- 18.2. Company Profiles
- 18.2.1 Mckesson Corporation
- 18.2.1.1. Overview
- 18.2.1.2. Products
- 18.2.1.3. SWOT Analysis
- 18.2.1.4. Recent Developments
- 18.2.1.5. Financials (Based on Availability)
- 18.2.2 Zebra Technologies Corporation
- 18.2.2.1. Overview
- 18.2.2.2. Products
- 18.2.2.3. SWOT Analysis
- 18.2.2.4. Recent Developments
- 18.2.2.5. Financials (Based on Availability)
- 18.2.3 Koninklijke Philips N V
- 18.2.3.1. Overview
- 18.2.3.2. Products
- 18.2.3.3. SWOT Analysis
- 18.2.3.4. Recent Developments
- 18.2.3.5. Financials (Based on Availability)
- 18.2.4 Cisco Systems Inc
- 18.2.4.1. Overview
- 18.2.4.2. Products
- 18.2.4.3. SWOT Analysis
- 18.2.4.4. Recent Developments
- 18.2.4.5. Financials (Based on Availability)
- 18.2.5 Airstrip Technologies Inc
- 18.2.5.1. Overview
- 18.2.5.2. Products
- 18.2.5.3. SWOT Analysis
- 18.2.5.4. Recent Developments
- 18.2.5.5. Financials (Based on Availability)
- 18.2.6 Omron Corporation
- 18.2.6.1. Overview
- 18.2.6.2. Products
- 18.2.6.3. SWOT Analysis
- 18.2.6.4. Recent Developments
- 18.2.6.5. Financials (Based on Availability)
- 18.2.7 At&T Inc
- 18.2.7.1. Overview
- 18.2.7.2. Products
- 18.2.7.3. SWOT Analysis
- 18.2.7.4. Recent Developments
- 18.2.7.5. Financials (Based on Availability)
- 18.2.8 SAP SE
- 18.2.8.1. Overview
- 18.2.8.2. Products
- 18.2.8.3. SWOT Analysis
- 18.2.8.4. Recent Developments
- 18.2.8.5. Financials (Based on Availability)
- 18.2.9 Oracle Cerner
- 18.2.9.1. Overview
- 18.2.9.2. Products
- 18.2.9.3. SWOT Analysis
- 18.2.9.4. Recent Developments
- 18.2.9.5. Financials (Based on Availability)
- 18.2.1 Mckesson Corporation
List of Figures
- Figure 1: Global Mobility in Healthcare Industry Revenue Breakdown (Million, %) by Region 2024 & 2032
- Figure 2: Global Mobility in Healthcare Industry Volume Breakdown (K Unit, %) by Region 2024 & 2032
- Figure 3: North America Mobility in Healthcare Industry Revenue (Million), by Country 2024 & 2032
- Figure 4: North America Mobility in Healthcare Industry Volume (K Unit), by Country 2024 & 2032
- Figure 5: North America Mobility in Healthcare Industry Revenue Share (%), by Country 2024 & 2032
- Figure 6: North America Mobility in Healthcare Industry Volume Share (%), by Country 2024 & 2032
- Figure 7: Europe Mobility in Healthcare Industry Revenue (Million), by Country 2024 & 2032
- Figure 8: Europe Mobility in Healthcare Industry Volume (K Unit), by Country 2024 & 2032
- Figure 9: Europe Mobility in Healthcare Industry Revenue Share (%), by Country 2024 & 2032
- Figure 10: Europe Mobility in Healthcare Industry Volume Share (%), by Country 2024 & 2032
- Figure 11: Asia Pacific Mobility in Healthcare Industry Revenue (Million), by Country 2024 & 2032
- Figure 12: Asia Pacific Mobility in Healthcare Industry Volume (K Unit), by Country 2024 & 2032
- Figure 13: Asia Pacific Mobility in Healthcare Industry Revenue Share (%), by Country 2024 & 2032
- Figure 14: Asia Pacific Mobility in Healthcare Industry Volume Share (%), by Country 2024 & 2032
- Figure 15: Middle East Mobility in Healthcare Industry Revenue (Million), by Country 2024 & 2032
- Figure 16: Middle East Mobility in Healthcare Industry Volume (K Unit), by Country 2024 & 2032
- Figure 17: Middle East Mobility in Healthcare Industry Revenue Share (%), by Country 2024 & 2032
- Figure 18: Middle East Mobility in Healthcare Industry Volume Share (%), by Country 2024 & 2032
- Figure 19: GCC Mobility in Healthcare Industry Revenue (Million), by Country 2024 & 2032
- Figure 20: GCC Mobility in Healthcare Industry Volume (K Unit), by Country 2024 & 2032
- Figure 21: GCC Mobility in Healthcare Industry Revenue Share (%), by Country 2024 & 2032
- Figure 22: GCC Mobility in Healthcare Industry Volume Share (%), by Country 2024 & 2032
- Figure 23: South America Mobility in Healthcare Industry Revenue (Million), by Country 2024 & 2032
- Figure 24: South America Mobility in Healthcare Industry Volume (K Unit), by Country 2024 & 2032
- Figure 25: South America Mobility in Healthcare Industry Revenue Share (%), by Country 2024 & 2032
- Figure 26: South America Mobility in Healthcare Industry Volume Share (%), by Country 2024 & 2032
- Figure 27: North America Mobility in Healthcare Industry Revenue (Million), by Products and Services 2024 & 2032
- Figure 28: North America Mobility in Healthcare Industry Volume (K Unit), by Products and Services 2024 & 2032
- Figure 29: North America Mobility in Healthcare Industry Revenue Share (%), by Products and Services 2024 & 2032
- Figure 30: North America Mobility in Healthcare Industry Volume Share (%), by Products and Services 2024 & 2032
- Figure 31: North America Mobility in Healthcare Industry Revenue (Million), by Application 2024 & 2032
- Figure 32: North America Mobility in Healthcare Industry Volume (K Unit), by Application 2024 & 2032
- Figure 33: North America Mobility in Healthcare Industry Revenue Share (%), by Application 2024 & 2032
- Figure 34: North America Mobility in Healthcare Industry Volume Share (%), by Application 2024 & 2032
- Figure 35: North America Mobility in Healthcare Industry Revenue (Million), by End User 2024 & 2032
- Figure 36: North America Mobility in Healthcare Industry Volume (K Unit), by End User 2024 & 2032
- Figure 37: North America Mobility in Healthcare Industry Revenue Share (%), by End User 2024 & 2032
- Figure 38: North America Mobility in Healthcare Industry Volume Share (%), by End User 2024 & 2032
- Figure 39: North America Mobility in Healthcare Industry Revenue (Million), by Country 2024 & 2032
- Figure 40: North America Mobility in Healthcare Industry Volume (K Unit), by Country 2024 & 2032
- Figure 41: North America Mobility in Healthcare Industry Revenue Share (%), by Country 2024 & 2032
- Figure 42: North America Mobility in Healthcare Industry Volume Share (%), by Country 2024 & 2032
- Figure 43: Europe Mobility in Healthcare Industry Revenue (Million), by Products and Services 2024 & 2032
- Figure 44: Europe Mobility in Healthcare Industry Volume (K Unit), by Products and Services 2024 & 2032
- Figure 45: Europe Mobility in Healthcare Industry Revenue Share (%), by Products and Services 2024 & 2032
- Figure 46: Europe Mobility in Healthcare Industry Volume Share (%), by Products and Services 2024 & 2032
- Figure 47: Europe Mobility in Healthcare Industry Revenue (Million), by Application 2024 & 2032
- Figure 48: Europe Mobility in Healthcare Industry Volume (K Unit), by Application 2024 & 2032
- Figure 49: Europe Mobility in Healthcare Industry Revenue Share (%), by Application 2024 & 2032
- Figure 50: Europe Mobility in Healthcare Industry Volume Share (%), by Application 2024 & 2032
- Figure 51: Europe Mobility in Healthcare Industry Revenue (Million), by End User 2024 & 2032
- Figure 52: Europe Mobility in Healthcare Industry Volume (K Unit), by End User 2024 & 2032
- Figure 53: Europe Mobility in Healthcare Industry Revenue Share (%), by End User 2024 & 2032
- Figure 54: Europe Mobility in Healthcare Industry Volume Share (%), by End User 2024 & 2032
- Figure 55: Europe Mobility in Healthcare Industry Revenue (Million), by Country 2024 & 2032
- Figure 56: Europe Mobility in Healthcare Industry Volume (K Unit), by Country 2024 & 2032
- Figure 57: Europe Mobility in Healthcare Industry Revenue Share (%), by Country 2024 & 2032
- Figure 58: Europe Mobility in Healthcare Industry Volume Share (%), by Country 2024 & 2032
- Figure 59: Asia Pacific Mobility in Healthcare Industry Revenue (Million), by Products and Services 2024 & 2032
- Figure 60: Asia Pacific Mobility in Healthcare Industry Volume (K Unit), by Products and Services 2024 & 2032
- Figure 61: Asia Pacific Mobility in Healthcare Industry Revenue Share (%), by Products and Services 2024 & 2032
- Figure 62: Asia Pacific Mobility in Healthcare Industry Volume Share (%), by Products and Services 2024 & 2032
- Figure 63: Asia Pacific Mobility in Healthcare Industry Revenue (Million), by Application 2024 & 2032
- Figure 64: Asia Pacific Mobility in Healthcare Industry Volume (K Unit), by Application 2024 & 2032
- Figure 65: Asia Pacific Mobility in Healthcare Industry Revenue Share (%), by Application 2024 & 2032
- Figure 66: Asia Pacific Mobility in Healthcare Industry Volume Share (%), by Application 2024 & 2032
- Figure 67: Asia Pacific Mobility in Healthcare Industry Revenue (Million), by End User 2024 & 2032
- Figure 68: Asia Pacific Mobility in Healthcare Industry Volume (K Unit), by End User 2024 & 2032
- Figure 69: Asia Pacific Mobility in Healthcare Industry Revenue Share (%), by End User 2024 & 2032
- Figure 70: Asia Pacific Mobility in Healthcare Industry Volume Share (%), by End User 2024 & 2032
- Figure 71: Asia Pacific Mobility in Healthcare Industry Revenue (Million), by Country 2024 & 2032
- Figure 72: Asia Pacific Mobility in Healthcare Industry Volume (K Unit), by Country 2024 & 2032
- Figure 73: Asia Pacific Mobility in Healthcare Industry Revenue Share (%), by Country 2024 & 2032
- Figure 74: Asia Pacific Mobility in Healthcare Industry Volume Share (%), by Country 2024 & 2032
- Figure 75: Middle East Mobility in Healthcare Industry Revenue (Million), by Products and Services 2024 & 2032
- Figure 76: Middle East Mobility in Healthcare Industry Volume (K Unit), by Products and Services 2024 & 2032
- Figure 77: Middle East Mobility in Healthcare Industry Revenue Share (%), by Products and Services 2024 & 2032
- Figure 78: Middle East Mobility in Healthcare Industry Volume Share (%), by Products and Services 2024 & 2032
- Figure 79: Middle East Mobility in Healthcare Industry Revenue (Million), by Application 2024 & 2032
- Figure 80: Middle East Mobility in Healthcare Industry Volume (K Unit), by Application 2024 & 2032
- Figure 81: Middle East Mobility in Healthcare Industry Revenue Share (%), by Application 2024 & 2032
- Figure 82: Middle East Mobility in Healthcare Industry Volume Share (%), by Application 2024 & 2032
- Figure 83: Middle East Mobility in Healthcare Industry Revenue (Million), by End User 2024 & 2032
- Figure 84: Middle East Mobility in Healthcare Industry Volume (K Unit), by End User 2024 & 2032
- Figure 85: Middle East Mobility in Healthcare Industry Revenue Share (%), by End User 2024 & 2032
- Figure 86: Middle East Mobility in Healthcare Industry Volume Share (%), by End User 2024 & 2032
- Figure 87: Middle East Mobility in Healthcare Industry Revenue (Million), by Country 2024 & 2032
- Figure 88: Middle East Mobility in Healthcare Industry Volume (K Unit), by Country 2024 & 2032
- Figure 89: Middle East Mobility in Healthcare Industry Revenue Share (%), by Country 2024 & 2032
- Figure 90: Middle East Mobility in Healthcare Industry Volume Share (%), by Country 2024 & 2032
- Figure 91: GCC Mobility in Healthcare Industry Revenue (Million), by Products and Services 2024 & 2032
- Figure 92: GCC Mobility in Healthcare Industry Volume (K Unit), by Products and Services 2024 & 2032
- Figure 93: GCC Mobility in Healthcare Industry Revenue Share (%), by Products and Services 2024 & 2032
- Figure 94: GCC Mobility in Healthcare Industry Volume Share (%), by Products and Services 2024 & 2032
- Figure 95: GCC Mobility in Healthcare Industry Revenue (Million), by Application 2024 & 2032
- Figure 96: GCC Mobility in Healthcare Industry Volume (K Unit), by Application 2024 & 2032
- Figure 97: GCC Mobility in Healthcare Industry Revenue Share (%), by Application 2024 & 2032
- Figure 98: GCC Mobility in Healthcare Industry Volume Share (%), by Application 2024 & 2032
- Figure 99: GCC Mobility in Healthcare Industry Revenue (Million), by End User 2024 & 2032
- Figure 100: GCC Mobility in Healthcare Industry Volume (K Unit), by End User 2024 & 2032
- Figure 101: GCC Mobility in Healthcare Industry Revenue Share (%), by End User 2024 & 2032
- Figure 102: GCC Mobility in Healthcare Industry Volume Share (%), by End User 2024 & 2032
- Figure 103: GCC Mobility in Healthcare Industry Revenue (Million), by Country 2024 & 2032
- Figure 104: GCC Mobility in Healthcare Industry Volume (K Unit), by Country 2024 & 2032
- Figure 105: GCC Mobility in Healthcare Industry Revenue Share (%), by Country 2024 & 2032
- Figure 106: GCC Mobility in Healthcare Industry Volume Share (%), by Country 2024 & 2032
- Figure 107: South America Mobility in Healthcare Industry Revenue (Million), by Products and Services 2024 & 2032
- Figure 108: South America Mobility in Healthcare Industry Volume (K Unit), by Products and Services 2024 & 2032
- Figure 109: South America Mobility in Healthcare Industry Revenue Share (%), by Products and Services 2024 & 2032
- Figure 110: South America Mobility in Healthcare Industry Volume Share (%), by Products and Services 2024 & 2032
- Figure 111: South America Mobility in Healthcare Industry Revenue (Million), by Application 2024 & 2032
- Figure 112: South America Mobility in Healthcare Industry Volume (K Unit), by Application 2024 & 2032
- Figure 113: South America Mobility in Healthcare Industry Revenue Share (%), by Application 2024 & 2032
- Figure 114: South America Mobility in Healthcare Industry Volume Share (%), by Application 2024 & 2032
- Figure 115: South America Mobility in Healthcare Industry Revenue (Million), by End User 2024 & 2032
- Figure 116: South America Mobility in Healthcare Industry Volume (K Unit), by End User 2024 & 2032
- Figure 117: South America Mobility in Healthcare Industry Revenue Share (%), by End User 2024 & 2032
- Figure 118: South America Mobility in Healthcare Industry Volume Share (%), by End User 2024 & 2032
- Figure 119: South America Mobility in Healthcare Industry Revenue (Million), by Country 2024 & 2032
- Figure 120: South America Mobility in Healthcare Industry Volume (K Unit), by Country 2024 & 2032
- Figure 121: South America Mobility in Healthcare Industry Revenue Share (%), by Country 2024 & 2032
- Figure 122: South America Mobility in Healthcare Industry Volume Share (%), by Country 2024 & 2032
List of Tables
- Table 1: Global Mobility in Healthcare Industry Revenue Million Forecast, by Region 2019 & 2032
- Table 2: Global Mobility in Healthcare Industry Volume K Unit Forecast, by Region 2019 & 2032
- Table 3: Global Mobility in Healthcare Industry Revenue Million Forecast, by Products and Services 2019 & 2032
- Table 4: Global Mobility in Healthcare Industry Volume K Unit Forecast, by Products and Services 2019 & 2032
- Table 5: Global Mobility in Healthcare Industry Revenue Million Forecast, by Application 2019 & 2032
- Table 6: Global Mobility in Healthcare Industry Volume K Unit Forecast, by Application 2019 & 2032
- Table 7: Global Mobility in Healthcare Industry Revenue Million Forecast, by End User 2019 & 2032
- Table 8: Global Mobility in Healthcare Industry Volume K Unit Forecast, by End User 2019 & 2032
- Table 9: Global Mobility in Healthcare Industry Revenue Million Forecast, by Region 2019 & 2032
- Table 10: Global Mobility in Healthcare Industry Volume K Unit Forecast, by Region 2019 & 2032
- Table 11: Global Mobility in Healthcare Industry Revenue Million Forecast, by Country 2019 & 2032
- Table 12: Global Mobility in Healthcare Industry Volume K Unit Forecast, by Country 2019 & 2032
- Table 13: Global Mobility in Healthcare Industry Revenue Million Forecast, by Country 2019 & 2032
- Table 14: Global Mobility in Healthcare Industry Volume K Unit Forecast, by Country 2019 & 2032
- Table 15: Global Mobility in Healthcare Industry Revenue Million Forecast, by Country 2019 & 2032
- Table 16: Global Mobility in Healthcare Industry Volume K Unit Forecast, by Country 2019 & 2032
- Table 17: Global Mobility in Healthcare Industry Revenue Million Forecast, by Country 2019 & 2032
- Table 18: Global Mobility in Healthcare Industry Volume K Unit Forecast, by Country 2019 & 2032
- Table 19: Global Mobility in Healthcare Industry Revenue Million Forecast, by Country 2019 & 2032
- Table 20: Global Mobility in Healthcare Industry Volume K Unit Forecast, by Country 2019 & 2032
- Table 21: Global Mobility in Healthcare Industry Revenue Million Forecast, by Country 2019 & 2032
- Table 22: Global Mobility in Healthcare Industry Volume K Unit Forecast, by Country 2019 & 2032
- Table 23: Global Mobility in Healthcare Industry Revenue Million Forecast, by Products and Services 2019 & 2032
- Table 24: Global Mobility in Healthcare Industry Volume K Unit Forecast, by Products and Services 2019 & 2032
- Table 25: Global Mobility in Healthcare Industry Revenue Million Forecast, by Application 2019 & 2032
- Table 26: Global Mobility in Healthcare Industry Volume K Unit Forecast, by Application 2019 & 2032
- Table 27: Global Mobility in Healthcare Industry Revenue Million Forecast, by End User 2019 & 2032
- Table 28: Global Mobility in Healthcare Industry Volume K Unit Forecast, by End User 2019 & 2032
- Table 29: Global Mobility in Healthcare Industry Revenue Million Forecast, by Country 2019 & 2032
- Table 30: Global Mobility in Healthcare Industry Volume K Unit Forecast, by Country 2019 & 2032
- Table 31: United States Mobility in Healthcare Industry Revenue (Million) Forecast, by Application 2019 & 2032
- Table 32: United States Mobility in Healthcare Industry Volume (K Unit) Forecast, by Application 2019 & 2032
- Table 33: Canada Mobility in Healthcare Industry Revenue (Million) Forecast, by Application 2019 & 2032
- Table 34: Canada Mobility in Healthcare Industry Volume (K Unit) Forecast, by Application 2019 & 2032
- Table 35: Mexico Mobility in Healthcare Industry Revenue (Million) Forecast, by Application 2019 & 2032
- Table 36: Mexico Mobility in Healthcare Industry Volume (K Unit) Forecast, by Application 2019 & 2032
- Table 37: Global Mobility in Healthcare Industry Revenue Million Forecast, by Products and Services 2019 & 2032
- Table 38: Global Mobility in Healthcare Industry Volume K Unit Forecast, by Products and Services 2019 & 2032
- Table 39: Global Mobility in Healthcare Industry Revenue Million Forecast, by Application 2019 & 2032
- Table 40: Global Mobility in Healthcare Industry Volume K Unit Forecast, by Application 2019 & 2032
- Table 41: Global Mobility in Healthcare Industry Revenue Million Forecast, by End User 2019 & 2032
- Table 42: Global Mobility in Healthcare Industry Volume K Unit Forecast, by End User 2019 & 2032
- Table 43: Global Mobility in Healthcare Industry Revenue Million Forecast, by Country 2019 & 2032
- Table 44: Global Mobility in Healthcare Industry Volume K Unit Forecast, by Country 2019 & 2032
- Table 45: Germany Mobility in Healthcare Industry Revenue (Million) Forecast, by Application 2019 & 2032
- Table 46: Germany Mobility in Healthcare Industry Volume (K Unit) Forecast, by Application 2019 & 2032
- Table 47: United Kingdom Mobility in Healthcare Industry Revenue (Million) Forecast, by Application 2019 & 2032
- Table 48: United Kingdom Mobility in Healthcare Industry Volume (K Unit) Forecast, by Application 2019 & 2032
- Table 49: France Mobility in Healthcare Industry Revenue (Million) Forecast, by Application 2019 & 2032
- Table 50: France Mobility in Healthcare Industry Volume (K Unit) Forecast, by Application 2019 & 2032
- Table 51: Italy Mobility in Healthcare Industry Revenue (Million) Forecast, by Application 2019 & 2032
- Table 52: Italy Mobility in Healthcare Industry Volume (K Unit) Forecast, by Application 2019 & 2032
- Table 53: Spain Mobility in Healthcare Industry Revenue (Million) Forecast, by Application 2019 & 2032
- Table 54: Spain Mobility in Healthcare Industry Volume (K Unit) Forecast, by Application 2019 & 2032
- Table 55: Rest of Europe Mobility in Healthcare Industry Revenue (Million) Forecast, by Application 2019 & 2032
- Table 56: Rest of Europe Mobility in Healthcare Industry Volume (K Unit) Forecast, by Application 2019 & 2032
- Table 57: Global Mobility in Healthcare Industry Revenue Million Forecast, by Products and Services 2019 & 2032
- Table 58: Global Mobility in Healthcare Industry Volume K Unit Forecast, by Products and Services 2019 & 2032
- Table 59: Global Mobility in Healthcare Industry Revenue Million Forecast, by Application 2019 & 2032
- Table 60: Global Mobility in Healthcare Industry Volume K Unit Forecast, by Application 2019 & 2032
- Table 61: Global Mobility in Healthcare Industry Revenue Million Forecast, by End User 2019 & 2032
- Table 62: Global Mobility in Healthcare Industry Volume K Unit Forecast, by End User 2019 & 2032
- Table 63: Global Mobility in Healthcare Industry Revenue Million Forecast, by Country 2019 & 2032
- Table 64: Global Mobility in Healthcare Industry Volume K Unit Forecast, by Country 2019 & 2032
- Table 65: China Mobility in Healthcare Industry Revenue (Million) Forecast, by Application 2019 & 2032
- Table 66: China Mobility in Healthcare Industry Volume (K Unit) Forecast, by Application 2019 & 2032
- Table 67: Japan Mobility in Healthcare Industry Revenue (Million) Forecast, by Application 2019 & 2032
- Table 68: Japan Mobility in Healthcare Industry Volume (K Unit) Forecast, by Application 2019 & 2032
- Table 69: India Mobility in Healthcare Industry Revenue (Million) Forecast, by Application 2019 & 2032
- Table 70: India Mobility in Healthcare Industry Volume (K Unit) Forecast, by Application 2019 & 2032
- Table 71: Australia Mobility in Healthcare Industry Revenue (Million) Forecast, by Application 2019 & 2032
- Table 72: Australia Mobility in Healthcare Industry Volume (K Unit) Forecast, by Application 2019 & 2032
- Table 73: South Korea Mobility in Healthcare Industry Revenue (Million) Forecast, by Application 2019 & 2032
- Table 74: South Korea Mobility in Healthcare Industry Volume (K Unit) Forecast, by Application 2019 & 2032
- Table 75: Rest of Asia Pacific Mobility in Healthcare Industry Revenue (Million) Forecast, by Application 2019 & 2032
- Table 76: Rest of Asia Pacific Mobility in Healthcare Industry Volume (K Unit) Forecast, by Application 2019 & 2032
- Table 77: Global Mobility in Healthcare Industry Revenue Million Forecast, by Products and Services 2019 & 2032
- Table 78: Global Mobility in Healthcare Industry Volume K Unit Forecast, by Products and Services 2019 & 2032
- Table 79: Global Mobility in Healthcare Industry Revenue Million Forecast, by Application 2019 & 2032
- Table 80: Global Mobility in Healthcare Industry Volume K Unit Forecast, by Application 2019 & 2032
- Table 81: Global Mobility in Healthcare Industry Revenue Million Forecast, by End User 2019 & 2032
- Table 82: Global Mobility in Healthcare Industry Volume K Unit Forecast, by End User 2019 & 2032
- Table 83: Global Mobility in Healthcare Industry Revenue Million Forecast, by Country 2019 & 2032
- Table 84: Global Mobility in Healthcare Industry Volume K Unit Forecast, by Country 2019 & 2032
- Table 85: Global Mobility in Healthcare Industry Revenue Million Forecast, by Products and Services 2019 & 2032
- Table 86: Global Mobility in Healthcare Industry Volume K Unit Forecast, by Products and Services 2019 & 2032
- Table 87: Global Mobility in Healthcare Industry Revenue Million Forecast, by Application 2019 & 2032
- Table 88: Global Mobility in Healthcare Industry Volume K Unit Forecast, by Application 2019 & 2032
- Table 89: Global Mobility in Healthcare Industry Revenue Million Forecast, by End User 2019 & 2032
- Table 90: Global Mobility in Healthcare Industry Volume K Unit Forecast, by End User 2019 & 2032
- Table 91: Global Mobility in Healthcare Industry Revenue Million Forecast, by Country 2019 & 2032
- Table 92: Global Mobility in Healthcare Industry Volume K Unit Forecast, by Country 2019 & 2032
- Table 93: South Africa Mobility in Healthcare Industry Revenue (Million) Forecast, by Application 2019 & 2032
- Table 94: South Africa Mobility in Healthcare Industry Volume (K Unit) Forecast, by Application 2019 & 2032
- Table 95: Rest of Middle East Mobility in Healthcare Industry Revenue (Million) Forecast, by Application 2019 & 2032
- Table 96: Rest of Middle East Mobility in Healthcare Industry Volume (K Unit) Forecast, by Application 2019 & 2032
- Table 97: Global Mobility in Healthcare Industry Revenue Million Forecast, by Products and Services 2019 & 2032
- Table 98: Global Mobility in Healthcare Industry Volume K Unit Forecast, by Products and Services 2019 & 2032
- Table 99: Global Mobility in Healthcare Industry Revenue Million Forecast, by Application 2019 & 2032
- Table 100: Global Mobility in Healthcare Industry Volume K Unit Forecast, by Application 2019 & 2032
- Table 101: Global Mobility in Healthcare Industry Revenue Million Forecast, by End User 2019 & 2032
- Table 102: Global Mobility in Healthcare Industry Volume K Unit Forecast, by End User 2019 & 2032
- Table 103: Global Mobility in Healthcare Industry Revenue Million Forecast, by Country 2019 & 2032
- Table 104: Global Mobility in Healthcare Industry Volume K Unit Forecast, by Country 2019 & 2032
- Table 105: Brazil Mobility in Healthcare Industry Revenue (Million) Forecast, by Application 2019 & 2032
- Table 106: Brazil Mobility in Healthcare Industry Volume (K Unit) Forecast, by Application 2019 & 2032
- Table 107: Argentina Mobility in Healthcare Industry Revenue (Million) Forecast, by Application 2019 & 2032
- Table 108: Argentina Mobility in Healthcare Industry Volume (K Unit) Forecast, by Application 2019 & 2032
- Table 109: Rest of South America Mobility in Healthcare Industry Revenue (Million) Forecast, by Application 2019 & 2032
- Table 110: Rest of South America Mobility in Healthcare Industry Volume (K Unit) Forecast, by Application 2019 & 2032
Frequently Asked Questions
1. What is the projected Compound Annual Growth Rate (CAGR) of the Mobility in Healthcare Industry?
The projected CAGR is approximately 21.32%.
2. Which companies are prominent players in the Mobility in Healthcare Industry?
Key companies in the market include Mckesson Corporation, Zebra Technologies Corporation, Koninklijke Philips N V, Cisco Systems Inc, Airstrip Technologies Inc, Omron Corporation, At&T Inc, SAP SE, Oracle Cerner.
3. What are the main segments of the Mobility in Healthcare Industry?
The market segments include Products and Services, Application, End User.
4. Can you provide details about the market size?
The market size is estimated to be USD 135.43 Million as of 2022.
5. What are some drivers contributing to market growth?
Increasing Utilization of the Smart Devices (Smartphones. Smart watches. etc.); Increased Influence of the Social Media on Healthcare; Rise in the Demand of Personalized Medicines.
6. What are the notable trends driving market growth?
Patient Care Management Segment is Expected to Witness a Healthy Growth Over the Forecast Period.
7. Are there any restraints impacting market growth?
Safety and Security Issues Associated with Patient Health Information; Lack of Skilled Professionals.
8. Can you provide examples of recent developments in the market?
In August 2022, Indonesia's Health Ministry launched the Indonesia Health Services platform in Jakarta as a part of the country's health technology transformation.
9. What pricing options are available for accessing the report?
Pricing options include single-user, multi-user, and enterprise licenses priced at USD 4750, USD 5250, and USD 8750 respectively.
10. Is the market size provided in terms of value or volume?
The market size is provided in terms of value, measured in Million and volume, measured in K Unit.
11. Are there any specific market keywords associated with the report?
Yes, the market keyword associated with the report is "Mobility in Healthcare Industry," which aids in identifying and referencing the specific market segment covered.
12. How do I determine which pricing option suits my needs best?
The pricing options vary based on user requirements and access needs. Individual users may opt for single-user licenses, while businesses requiring broader access may choose multi-user or enterprise licenses for cost-effective access to the report.
13. Are there any additional resources or data provided in the Mobility in Healthcare Industry report?
While the report offers comprehensive insights, it's advisable to review the specific contents or supplementary materials provided to ascertain if additional resources or data are available.
14. How can I stay updated on further developments or reports in the Mobility in Healthcare Industry?
To stay informed about further developments, trends, and reports in the Mobility in Healthcare Industry, consider subscribing to industry newsletters, following relevant companies and organizations, or regularly checking reputable industry news sources and publications.
Methodology
Step 1 - Identification of Relevant Samples Size from Population Database


Step 2 - Approaches for Defining Global Market Size (Value, Volume* & Price*)

Note*: In applicable scenarios
Step 3 - Data Sources
Primary Research
- Web Analytics
- Survey Reports
- Research Institute
- Latest Research Reports
- Opinion Leaders
Secondary Research
- Annual Reports
- White Paper
- Latest Press Release
- Industry Association
- Paid Database
- Investor Presentations

Step 4 - Data Triangulation
Involves using different sources of information in order to increase the validity of a study
These sources are likely to be stakeholders in a program - participants, other researchers, program staff, other community members, and so on.
Then we put all data in single framework & apply various statistical tools to find out the dynamic on the market.
During the analysis stage, feedback from the stakeholder groups would be compared to determine areas of agreement as well as areas of divergence


