

Key Insights
The mobile AI market is experiencing substantial expansion, propelled by widespread smartphone adoption, advancements in AI algorithms, and the escalating demand for intelligent mobile applications. The market's Compound Annual Growth Rate (CAGR) of 28.95% from 2019 to 2024 signifies a robust upward trend, projected to persist through the forecast period of 2025-2033. Key growth drivers include the integration of AI into diverse mobile applications, such as image recognition, natural language processing, and personalized user experiences. The advent of 5G technology further accelerates this growth by facilitating faster data processing and seamless connectivity, crucial for advanced AI applications. While challenges related to data privacy and cybersecurity persist, ongoing innovation in AI chipsets and the increasing adoption of AI across sectors like automotive, robotics, and healthcare are mitigating these constraints. Market segmentation by application reveals the widespread utility of mobile AI, with smartphones currently leading, followed by cameras, drones, and the rapidly growing automotive sector. Leading technology firms, including Apple, Google, Samsung, and Huawei, are at the forefront, investing in R&D and strategic acquisitions to maintain competitive advantage. Geographically, North America and Asia-Pacific are demonstrating strong market growth, attributed to high smartphone penetration and increasing digitalization.
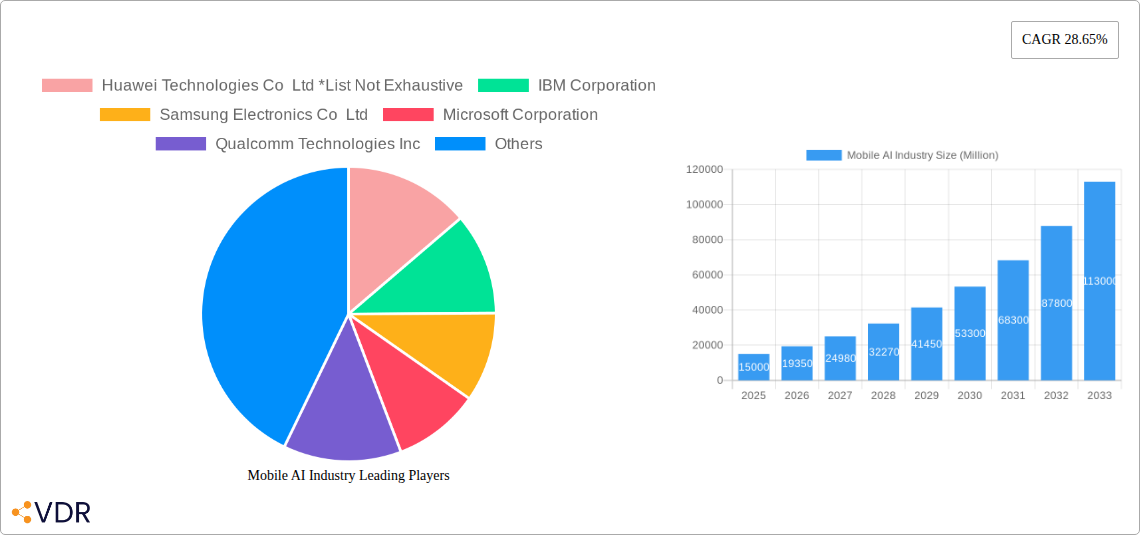
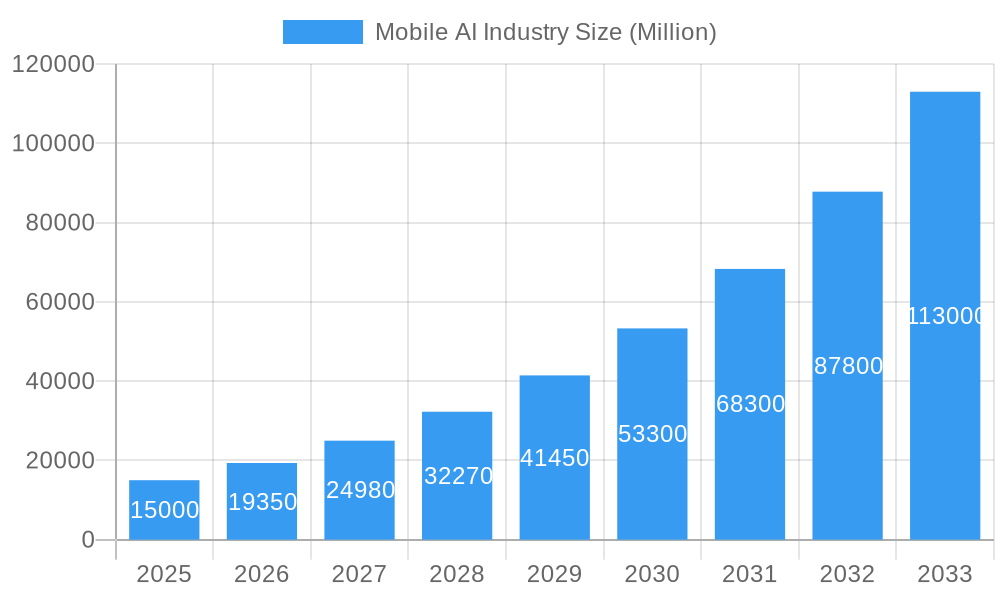
Mobile AI Industry Market Size (In Billion)

The outlook for the mobile AI market indicates sustained robust growth, exceeding prior projections due to the accelerating integration of AI-powered features in daily life. Enhanced AI algorithms and the development of more energy-efficient AI chips will further stimulate market expansion, particularly in emerging markets with rapidly growing smartphone penetration. Intense competition among major technology companies drives continuous innovation and improvement in AI capabilities, ultimately benefiting consumers with more advanced and accessible AI-powered mobile experiences. Ongoing investment in research and development, coupled with strategic partnerships and mergers and acquisitions, are shaping the future of this dynamic market, positioning it as a pivotal technological driver for the next decade.
Mobile AI Industry Company Market Share
Mobile AI Industry Market Analysis: 2024-2033
This comprehensive report offers an in-depth analysis of the Mobile AI industry, covering market dynamics, growth trajectories, regional insights, competitive strategies, and future projections. The analysis spans from 2019 to 2033, with a base year of 2024 and a forecast period from 2025 to 2033. This report is essential for industry professionals, investors, and strategists seeking to understand and leverage opportunities within this fast-evolving market. It examines the broader Artificial Intelligence market and the specific Mobile AI segment, providing a complete market segmentation by application, including Smartphones, Cameras, Drones, Robotics, Automotive, and Other Applications. The overall market size is projected to reach 10.61 billion units by 2033.
Mobile AI Industry Market Dynamics & Structure
The Mobile AI market is characterized by a dynamic interplay of technological innovation, intense competition, and evolving regulatory landscapes. Market concentration is currently moderate, with several key players holding significant shares, but the market is expected to become more fragmented as new entrants emerge. Technological advancements, particularly in areas like deep learning and edge computing, are primary drivers of growth. Regulatory frameworks, varying across regions, pose both challenges and opportunities, impacting data privacy and security. The market also witnesses a steady stream of mergers and acquisitions (M&A) activity, reflecting the strategic importance of Mobile AI technologies.
- Market Concentration: Moderate, with top 5 players holding approximately 60% market share in 2024.
- Technological Innovation: Deep learning, edge computing, and advancements in sensor technology are key drivers.
- Regulatory Frameworks: GDPR, CCPA, and other regional regulations influence data privacy and security.
- Competitive Product Substitutes: Limited direct substitutes, but alternative solutions exist in specific applications.
- End-User Demographics: Expanding rapidly across various demographics, driven by increased smartphone penetration.
- M&A Trends: Consistent M&A activity, with an average of xx deals annually in the historical period, indicating strong consolidation trends.
Mobile AI Industry Growth Trends & Insights
The Mobile AI market has experienced significant growth throughout the historical period (2019-2024), with a CAGR of xx%. This growth is fueled by increasing smartphone adoption, the proliferation of AI-powered applications, and improvements in processing power and data availability. The market is expected to maintain a robust growth trajectory during the forecast period (2025-2033), driven by advancements in AI algorithms, the expansion of 5G networks, and emerging applications in various sectors. Market penetration is expected to reach xx% by 2033. Technological disruptions, such as the rise of edge AI and the development of more efficient AI models, will continue to shape market dynamics. Consumer behavior shifts towards personalized experiences and increased reliance on AI-powered services will further accelerate market growth. By 2033, the market size is expected to reach xx million units.
Dominant Regions, Countries, or Segments in Mobile AI Industry
North America currently holds the largest market share in the Mobile AI industry, driven by strong technological advancements, high consumer adoption rates, and substantial investments in AI research and development. However, Asia-Pacific is expected to witness the fastest growth rate during the forecast period, fueled by expanding smartphone penetration, increasing internet access, and government initiatives promoting AI development. Within applications, the Smartphone segment dominates, accounting for approximately 65% of the total market share in 2024. This is primarily due to the widespread use of smartphones and the integration of AI capabilities into various smartphone functions. However, the Automotive segment is projected to show the highest growth rate in the coming years driven by the increasing demand for driver-assistance systems and autonomous vehicles.
- Key Drivers in North America: Strong R&D investment, high consumer adoption, advanced infrastructure.
- Key Drivers in Asia-Pacific: Rapid smartphone penetration, increasing internet access, government support for AI.
- Smartphone Segment Dominance: High smartphone penetration and integration of AI into core functionalities.
- Automotive Segment Growth: Increasing demand for driver-assistance systems and autonomous vehicles.
Mobile AI Industry Product Landscape
The Mobile AI product landscape is characterized by a wide range of applications, from image recognition and natural language processing to predictive analytics and personalized recommendations. Recent product innovations focus on improving processing speed, reducing energy consumption, and enhancing accuracy. The key selling propositions include improved user experience, increased efficiency, and enhanced security. Technological advancements, such as the development of more efficient AI algorithms and hardware accelerators, are continuously improving the performance and capabilities of mobile AI products.
Key Drivers, Barriers & Challenges in Mobile AI Industry
Key Drivers:
- Rapid advancements in AI algorithms and hardware.
- Growing demand for personalized and intelligent mobile applications.
- Increasing smartphone and IoT device penetration.
- Rising investments in AI research and development.
Key Challenges:
- High development costs and complexity.
- Concerns regarding data privacy and security.
- Limitations in processing power and battery life.
- Intense competition and fragmented market. This results in a xx% reduction in average profit margins for smaller players.
Emerging Opportunities in Mobile AI Industry
Emerging opportunities lie in the untapped potential of AI in various sectors, including healthcare, education, and smart cities. Innovative applications, such as AI-powered medical diagnostics and personalized learning platforms, are gaining traction. Evolving consumer preferences towards seamless, personalized, and intelligent experiences are creating significant demand for advanced mobile AI solutions. Expansion into emerging markets with high growth potential also offers lucrative opportunities.
Growth Accelerators in the Mobile AI Industry
Long-term growth will be driven by breakthroughs in edge AI technologies, leading to enhanced performance and reduced reliance on cloud connectivity. Strategic partnerships between technology companies and industry players across various sectors will fuel innovation and market expansion. Investment in R&D to improve AI algorithms, develop more energy-efficient hardware, and enhance data security will also play a pivotal role in driving future growth.
Key Players Shaping the Mobile AI Industry Market
Notable Milestones in Mobile AI Industry Sector
- February 2022: Apple Inc. acquired an AI music startup, enhancing its audio offerings.
- March 2022: Intel Corporation acquired Granulate Cloud Solutions Ltd., improving cloud performance.
- May 2022: Avaya and Microsoft Corp. expanded their partnership, boosting productivity and customer engagement.
In-Depth Mobile AI Industry Market Outlook
The Mobile AI market exhibits strong growth potential, driven by continuous technological advancements, increasing demand for intelligent mobile applications, and expansion into new markets. Strategic partnerships and investments in research and development will be crucial for capturing this potential. The market's future hinges on addressing challenges related to data privacy, security, and energy efficiency. Opportunities for innovation and market expansion are vast, making this a highly attractive sector for both established players and new entrants.
Mobile AI Industry Segmentation
-
1. Application
- 1.1. Smartphone
- 1.2. Camera
- 1.3. Drone
- 1.4. Robotics
- 1.5. Automotive
- 1.6. Other Applications
Mobile AI Industry Segmentation By Geography
- 1. North America
- 2. Europe
- 3. Asia Pacific
- 4. Latin America
- 5. Middle East
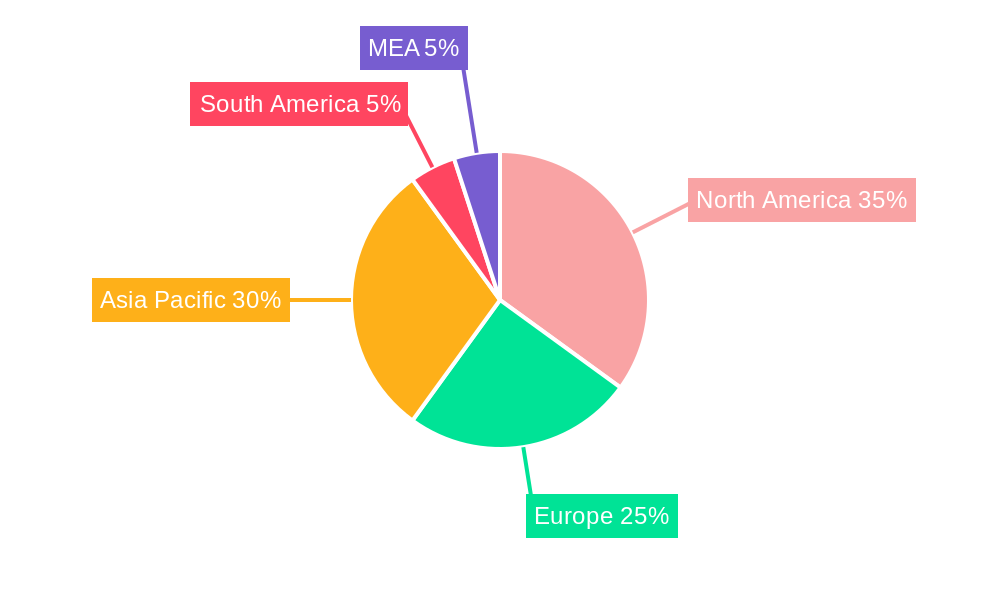
Mobile AI Industry Regional Market Share
Geographic Coverage of Mobile AI Industry
Mobile AI Industry REPORT HIGHLIGHTS
| Aspects | Details |
|---|---|
| Study Period | 2020-2034 |
| Base Year | 2025 |
| Estimated Year | 2026 |
| Forecast Period | 2026-2034 |
| Historical Period | 2020-2025 |
| Growth Rate | CAGR of 28.95% from 2020-2034 |
| Segmentation |
|
Table of Contents
- 1. Introduction
- 1.1. Research Scope
- 1.2. Market Segmentation
- 1.3. Research Methodology
- 1.4. Definitions and Assumptions
- 2. Executive Summary
- 2.1. Introduction
- 3. Market Dynamics
- 3.1. Introduction
- 3.2. Market Drivers
- 3.2.1. Increasing Demand for AI-capable Processors in Mobile Devices; Rise of Cognitive Computing and Increasing Number of AI Applications; Increasing Penetration of Mobile Devices
- 3.3. Market Restrains
- 3.3.1 Algorithms
- 3.3.2 Mathematical
- 3.3.3 and Other Complexities Associated with the Use of Gesture Recognition Technology; High Battery Power Consumption by Gesture Sensors
- 3.3.4 due to the ‘Always-on’ User Interface
- 3.4. Market Trends
- 3.4.1. Smartphone Application Drive Growth of The Market
- 4. Market Factor Analysis
- 4.1. Porters Five Forces
- 4.2. Supply/Value Chain
- 4.3. PESTEL analysis
- 4.4. Market Entropy
- 4.5. Patent/Trademark Analysis
- 5. Global Mobile AI Industry Analysis, Insights and Forecast, 2020-2032
- 5.1. Market Analysis, Insights and Forecast - by Application
- 5.1.1. Smartphone
- 5.1.2. Camera
- 5.1.3. Drone
- 5.1.4. Robotics
- 5.1.5. Automotive
- 5.1.6. Other Applications
- 5.2. Market Analysis, Insights and Forecast - by Region
- 5.2.1. North America
- 5.2.2. Europe
- 5.2.3. Asia Pacific
- 5.2.4. Latin America
- 5.2.5. Middle East
- 5.1. Market Analysis, Insights and Forecast - by Application
- 6. North America Mobile AI Industry Analysis, Insights and Forecast, 2020-2032
- 6.1. Market Analysis, Insights and Forecast - by Application
- 6.1.1. Smartphone
- 6.1.2. Camera
- 6.1.3. Drone
- 6.1.4. Robotics
- 6.1.5. Automotive
- 6.1.6. Other Applications
- 6.1. Market Analysis, Insights and Forecast - by Application
- 7. Europe Mobile AI Industry Analysis, Insights and Forecast, 2020-2032
- 7.1. Market Analysis, Insights and Forecast - by Application
- 7.1.1. Smartphone
- 7.1.2. Camera
- 7.1.3. Drone
- 7.1.4. Robotics
- 7.1.5. Automotive
- 7.1.6. Other Applications
- 7.1. Market Analysis, Insights and Forecast - by Application
- 8. Asia Pacific Mobile AI Industry Analysis, Insights and Forecast, 2020-2032
- 8.1. Market Analysis, Insights and Forecast - by Application
- 8.1.1. Smartphone
- 8.1.2. Camera
- 8.1.3. Drone
- 8.1.4. Robotics
- 8.1.5. Automotive
- 8.1.6. Other Applications
- 8.1. Market Analysis, Insights and Forecast - by Application
- 9. Latin America Mobile AI Industry Analysis, Insights and Forecast, 2020-2032
- 9.1. Market Analysis, Insights and Forecast - by Application
- 9.1.1. Smartphone
- 9.1.2. Camera
- 9.1.3. Drone
- 9.1.4. Robotics
- 9.1.5. Automotive
- 9.1.6. Other Applications
- 9.1. Market Analysis, Insights and Forecast - by Application
- 10. Middle East Mobile AI Industry Analysis, Insights and Forecast, 2020-2032
- 10.1. Market Analysis, Insights and Forecast - by Application
- 10.1.1. Smartphone
- 10.1.2. Camera
- 10.1.3. Drone
- 10.1.4. Robotics
- 10.1.5. Automotive
- 10.1.6. Other Applications
- 10.1. Market Analysis, Insights and Forecast - by Application
- 11. Competitive Analysis
- 11.1. Global Market Share Analysis 2025
- 11.2. Company Profiles
- 11.2.1 Huawei Technologies Co Ltd *List Not Exhaustive
- 11.2.1.1. Overview
- 11.2.1.2. Products
- 11.2.1.3. SWOT Analysis
- 11.2.1.4. Recent Developments
- 11.2.1.5. Financials (Based on Availability)
- 11.2.2 IBM Corporation
- 11.2.2.1. Overview
- 11.2.2.2. Products
- 11.2.2.3. SWOT Analysis
- 11.2.2.4. Recent Developments
- 11.2.2.5. Financials (Based on Availability)
- 11.2.3 Samsung Electronics Co Ltd
- 11.2.3.1. Overview
- 11.2.3.2. Products
- 11.2.3.3. SWOT Analysis
- 11.2.3.4. Recent Developments
- 11.2.3.5. Financials (Based on Availability)
- 11.2.4 Microsoft Corporation
- 11.2.4.1. Overview
- 11.2.4.2. Products
- 11.2.4.3. SWOT Analysis
- 11.2.4.4. Recent Developments
- 11.2.4.5. Financials (Based on Availability)
- 11.2.5 Qualcomm Technologies Inc
- 11.2.5.1. Overview
- 11.2.5.2. Products
- 11.2.5.3. SWOT Analysis
- 11.2.5.4. Recent Developments
- 11.2.5.5. Financials (Based on Availability)
- 11.2.6 Alphabet Inc (Google LLC)
- 11.2.6.1. Overview
- 11.2.6.2. Products
- 11.2.6.3. SWOT Analysis
- 11.2.6.4. Recent Developments
- 11.2.6.5. Financials (Based on Availability)
- 11.2.7 MediaTek Inc
- 11.2.7.1. Overview
- 11.2.7.2. Products
- 11.2.7.3. SWOT Analysis
- 11.2.7.4. Recent Developments
- 11.2.7.5. Financials (Based on Availability)
- 11.2.8 Nvidia Corporation
- 11.2.8.1. Overview
- 11.2.8.2. Products
- 11.2.8.3. SWOT Analysis
- 11.2.8.4. Recent Developments
- 11.2.8.5. Financials (Based on Availability)
- 11.2.9 Apple Inc
- 11.2.9.1. Overview
- 11.2.9.2. Products
- 11.2.9.3. SWOT Analysis
- 11.2.9.4. Recent Developments
- 11.2.9.5. Financials (Based on Availability)
- 11.2.10 Intel Corporation
- 11.2.10.1. Overview
- 11.2.10.2. Products
- 11.2.10.3. SWOT Analysis
- 11.2.10.4. Recent Developments
- 11.2.10.5. Financials (Based on Availability)
- 11.2.1 Huawei Technologies Co Ltd *List Not Exhaustive
List of Figures
- Figure 1: Global Mobile AI Industry Revenue Breakdown (billion, %) by Region 2025 & 2033
- Figure 2: North America Mobile AI Industry Revenue (billion), by Application 2025 & 2033
- Figure 3: North America Mobile AI Industry Revenue Share (%), by Application 2025 & 2033
- Figure 4: North America Mobile AI Industry Revenue (billion), by Country 2025 & 2033
- Figure 5: North America Mobile AI Industry Revenue Share (%), by Country 2025 & 2033
- Figure 6: Europe Mobile AI Industry Revenue (billion), by Application 2025 & 2033
- Figure 7: Europe Mobile AI Industry Revenue Share (%), by Application 2025 & 2033
- Figure 8: Europe Mobile AI Industry Revenue (billion), by Country 2025 & 2033
- Figure 9: Europe Mobile AI Industry Revenue Share (%), by Country 2025 & 2033
- Figure 10: Asia Pacific Mobile AI Industry Revenue (billion), by Application 2025 & 2033
- Figure 11: Asia Pacific Mobile AI Industry Revenue Share (%), by Application 2025 & 2033
- Figure 12: Asia Pacific Mobile AI Industry Revenue (billion), by Country 2025 & 2033
- Figure 13: Asia Pacific Mobile AI Industry Revenue Share (%), by Country 2025 & 2033
- Figure 14: Latin America Mobile AI Industry Revenue (billion), by Application 2025 & 2033
- Figure 15: Latin America Mobile AI Industry Revenue Share (%), by Application 2025 & 2033
- Figure 16: Latin America Mobile AI Industry Revenue (billion), by Country 2025 & 2033
- Figure 17: Latin America Mobile AI Industry Revenue Share (%), by Country 2025 & 2033
- Figure 18: Middle East Mobile AI Industry Revenue (billion), by Application 2025 & 2033
- Figure 19: Middle East Mobile AI Industry Revenue Share (%), by Application 2025 & 2033
- Figure 20: Middle East Mobile AI Industry Revenue (billion), by Country 2025 & 2033
- Figure 21: Middle East Mobile AI Industry Revenue Share (%), by Country 2025 & 2033
List of Tables
- Table 1: Global Mobile AI Industry Revenue billion Forecast, by Application 2020 & 2033
- Table 2: Global Mobile AI Industry Revenue billion Forecast, by Region 2020 & 2033
- Table 3: Global Mobile AI Industry Revenue billion Forecast, by Application 2020 & 2033
- Table 4: Global Mobile AI Industry Revenue billion Forecast, by Country 2020 & 2033
- Table 5: Global Mobile AI Industry Revenue billion Forecast, by Application 2020 & 2033
- Table 6: Global Mobile AI Industry Revenue billion Forecast, by Country 2020 & 2033
- Table 7: Global Mobile AI Industry Revenue billion Forecast, by Application 2020 & 2033
- Table 8: Global Mobile AI Industry Revenue billion Forecast, by Country 2020 & 2033
- Table 9: Global Mobile AI Industry Revenue billion Forecast, by Application 2020 & 2033
- Table 10: Global Mobile AI Industry Revenue billion Forecast, by Country 2020 & 2033
- Table 11: Global Mobile AI Industry Revenue billion Forecast, by Application 2020 & 2033
- Table 12: Global Mobile AI Industry Revenue billion Forecast, by Country 2020 & 2033
Frequently Asked Questions
1. What is the projected Compound Annual Growth Rate (CAGR) of the Mobile AI Industry?
The projected CAGR is approximately 28.95%.
2. Which companies are prominent players in the Mobile AI Industry?
Key companies in the market include Huawei Technologies Co Ltd *List Not Exhaustive, IBM Corporation, Samsung Electronics Co Ltd, Microsoft Corporation, Qualcomm Technologies Inc, Alphabet Inc (Google LLC), MediaTek Inc, Nvidia Corporation, Apple Inc, Intel Corporation.
3. What are the main segments of the Mobile AI Industry?
The market segments include Application .
4. Can you provide details about the market size?
The market size is estimated to be USD 10.61 billion as of 2022.
5. What are some drivers contributing to market growth?
Increasing Demand for AI-capable Processors in Mobile Devices; Rise of Cognitive Computing and Increasing Number of AI Applications; Increasing Penetration of Mobile Devices.
6. What are the notable trends driving market growth?
Smartphone Application Drive Growth of The Market.
7. Are there any restraints impacting market growth?
Algorithms. Mathematical. and Other Complexities Associated with the Use of Gesture Recognition Technology; High Battery Power Consumption by Gesture Sensors. due to the ‘Always-on’ User Interface.
8. Can you provide examples of recent developments in the market?
May 2022: Avaya and Microsoft Corp. expanded their global partnership by pairing the industry-leading Avaya OneCloud portfolio with Microsoft Azure to provide organizations with more options to increase their productivity and customer engagement with unrivaled reliability, agility, and scale.
9. What pricing options are available for accessing the report?
Pricing options include single-user, multi-user, and enterprise licenses priced at USD 4750, USD 5250, and USD 8750 respectively.
10. Is the market size provided in terms of value or volume?
The market size is provided in terms of value, measured in billion.
11. Are there any specific market keywords associated with the report?
Yes, the market keyword associated with the report is "Mobile AI Industry," which aids in identifying and referencing the specific market segment covered.
12. How do I determine which pricing option suits my needs best?
The pricing options vary based on user requirements and access needs. Individual users may opt for single-user licenses, while businesses requiring broader access may choose multi-user or enterprise licenses for cost-effective access to the report.
13. Are there any additional resources or data provided in the Mobile AI Industry report?
While the report offers comprehensive insights, it's advisable to review the specific contents or supplementary materials provided to ascertain if additional resources or data are available.
14. How can I stay updated on further developments or reports in the Mobile AI Industry?
To stay informed about further developments, trends, and reports in the Mobile AI Industry, consider subscribing to industry newsletters, following relevant companies and organizations, or regularly checking reputable industry news sources and publications.
Methodology
Step 1 - Identification of Relevant Samples Size from Population Database


Step 2 - Approaches for Defining Global Market Size (Value, Volume* & Price*)

Note*: In applicable scenarios
Step 3 - Data Sources
Primary Research
- Web Analytics
- Survey Reports
- Research Institute
- Latest Research Reports
- Opinion Leaders
Secondary Research
- Annual Reports
- White Paper
- Latest Press Release
- Industry Association
- Paid Database
- Investor Presentations

Step 4 - Data Triangulation
Involves using different sources of information in order to increase the validity of a study
These sources are likely to be stakeholders in a program - participants, other researchers, program staff, other community members, and so on.
Then we put all data in single framework & apply various statistical tools to find out the dynamic on the market.
During the analysis stage, feedback from the stakeholder groups would be compared to determine areas of agreement as well as areas of divergence
