
Key Insights
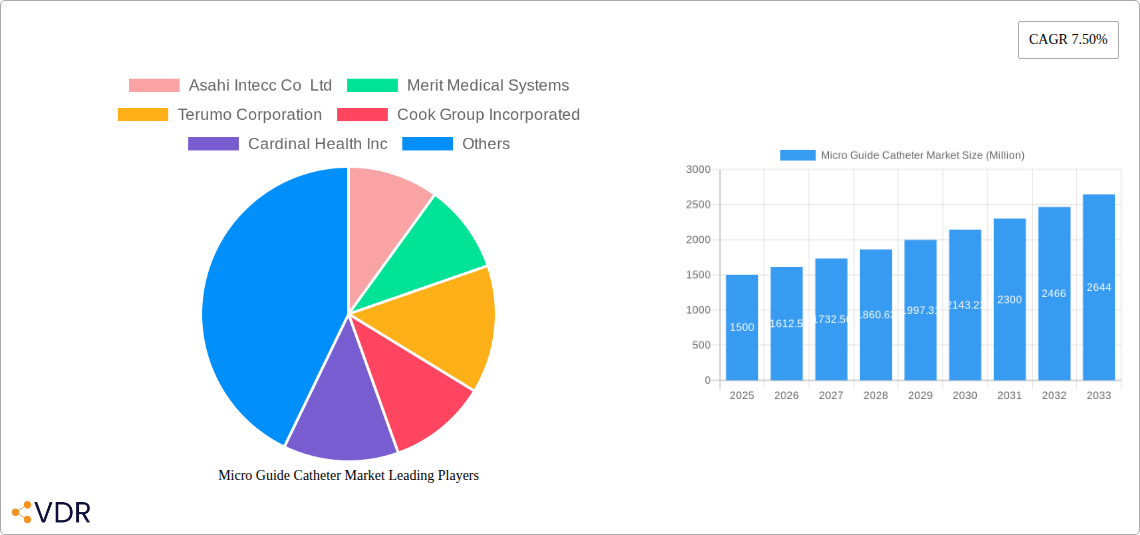
The global micro guide catheter market is experiencing robust growth, driven by the increasing prevalence of cardiovascular and neurovascular diseases, advancements in minimally invasive procedures, and the rising demand for sophisticated medical devices. The market's Compound Annual Growth Rate (CAGR) of 7.50% from 2019-2033 indicates a significant expansion, projected to reach a substantial market size by 2033. This growth is fueled by several key factors. Technological advancements leading to smaller, more flexible catheters with improved maneuverability are crucial. The increasing adoption of these catheters in various applications, including coronary interventions, neurovascular procedures, and peripheral vascular surgeries, is another significant driver. Furthermore, the growing preference for minimally invasive surgeries due to their shorter recovery times and reduced complications is boosting market expansion. The market is segmented by product type (over-the-wire and flow-directed), application (cardiovascular, neurovascular, and other applications), and end-user (hospitals/clinics and ambulatory surgical centers). North America currently holds a dominant market share due to high healthcare expenditure and technological advancements. However, the Asia-Pacific region is anticipated to witness the fastest growth rate due to rising healthcare infrastructure and increasing disposable incomes. Competition in the market is intense, with key players like Asahi Intecc Co Ltd, Merit Medical Systems, and Medtronic PLC constantly innovating and expanding their product portfolios.
Despite the positive outlook, several challenges could restrain market growth. These include stringent regulatory approvals, high manufacturing costs, and the potential risk of complications associated with the use of micro guide catheters. However, continuous technological advancements, increasing investments in research and development, and expanding applications are expected to mitigate these challenges and maintain the market's upward trajectory. The forecast period of 2025-2033 will likely witness substantial growth across all segments, with particular focus on the development of novel materials and features enhancing catheter performance and safety. The market is poised for continued expansion driven by the persistent need for advanced interventional tools and growing patient volumes needing such minimally invasive procedures.
Micro Guide Catheter Market: A Comprehensive Report (2019-2033)
This comprehensive report provides a detailed analysis of the Micro Guide Catheter Market, encompassing its parent market (Medical Devices) and child markets (Cardiovascular and Neurovascular interventions). We delve into market dynamics, growth trends, regional dominance, product landscape, key players, and future outlook, offering invaluable insights for industry professionals, investors, and strategic decision-makers. The report covers the period 2019-2033, with 2025 serving as the base and estimated year.
Micro Guide Catheter Market Market Dynamics & Structure
The Micro Guide Catheter market, valued at xx Million in 2025, is characterized by a moderately concentrated landscape with key players holding significant market share. Technological innovation, particularly in materials science and miniaturization, is a primary driver. Stringent regulatory frameworks governing medical devices influence market access and product development. Competitive pressures stem from substitute products and emerging technologies. The end-user demographic is primarily comprised of hospitals and specialized clinics, with a growing contribution from ambulatory surgical centers. Mergers and acquisitions (M&A) activity, while not excessively frequent, plays a role in shaping market consolidation and technological integration.
- Market Concentration: Moderate, with top 5 players holding approximately xx% market share in 2025.
- Technological Innovation: Focus on improved biocompatibility, reduced trauma, and enhanced imaging capabilities.
- Regulatory Landscape: Stringent approvals processes in key regions influence market entry and product lifecycle.
- Competitive Substitutes: Alternative minimally invasive techniques pose some level of competitive pressure.
- M&A Activity: xx deals recorded between 2019 and 2024, with a projected xx deals during 2025-2033.
- Innovation Barriers: High regulatory hurdles, significant R&D investment requirements.
Micro Guide Catheter Market Growth Trends & Insights
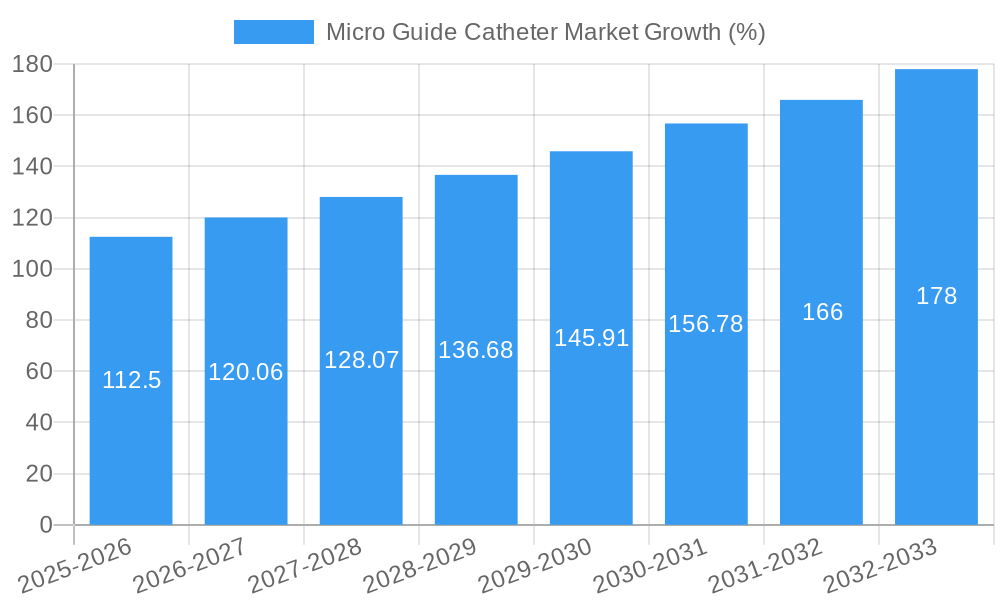
The Micro Guide Catheter market exhibits a robust growth trajectory, with a projected CAGR of xx% during the forecast period (2025-2033). This growth is fueled by several factors, including increasing prevalence of cardiovascular and neurovascular diseases, technological advancements leading to improved treatment outcomes, and a rising preference for minimally invasive procedures. Market penetration is highest in developed regions but is showing promising growth in emerging economies. Technological disruptions, such as the introduction of smart catheters and advanced imaging integration, are reshaping the market landscape. Shifting consumer behavior towards personalized medicine and improved healthcare access further contributes to market expansion. Market size is expected to reach xx Million by 2033.
Dominant Regions, Countries, or Segments in Micro Guide Catheter Market
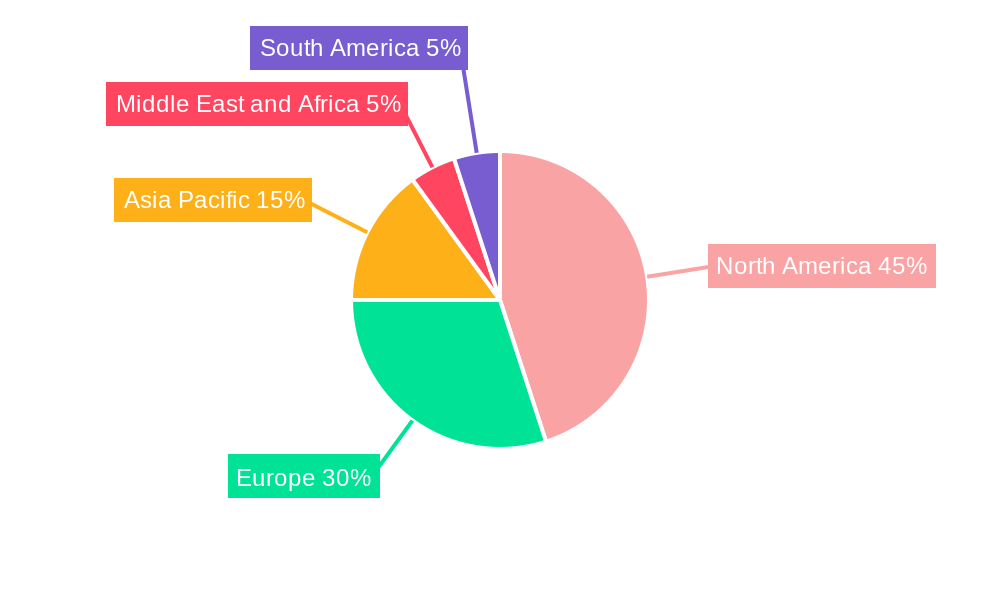
North America currently holds the largest market share, driven by high healthcare expenditure, advanced medical infrastructure, and a significant prevalence of target diseases. However, Asia-Pacific is expected to witness the fastest growth rate due to increasing healthcare awareness, rising disposable incomes, and expanding healthcare infrastructure. Within product segments, over-the-wire catheters currently dominate, although flow-directed catheters are gaining traction due to improved navigation capabilities. Cardiovascular applications hold the largest share within the application segment.
- North America: High market share due to advanced healthcare infrastructure and high adoption rates.
- Asia-Pacific: Fastest growth rate driven by rising healthcare expenditure and increasing prevalence of target diseases.
- Europe: Stable growth, driven by technological advancements and aging population.
- Over-the-wire Catheters: Dominant product segment due to established usage and cost-effectiveness.
- Cardiovascular Applications: Largest application segment due to high prevalence of cardiovascular diseases.
- Hospitals/Clinics: Major end-user segment due to specialized infrastructure and experienced medical professionals.
Micro Guide Catheter Market Product Landscape
The Micro Guide Catheter market features a diverse range of products, with ongoing innovations focused on enhancing flexibility, biocompatibility, and imaging capabilities. Over-the-wire catheters provide reliable navigation, while flow-directed catheters offer improved precision and reduced procedural time. Technological advancements encompass the use of advanced materials, such as shape-memory alloys, and integration with sophisticated imaging systems, improving both safety and efficiency. Unique selling propositions often include enhanced maneuverability, reduced trauma, and compatibility with various imaging modalities.
Key Drivers, Barriers & Challenges in Micro Guide Catheter Market
Key Drivers: Increasing prevalence of cardiovascular and neurovascular diseases, advancements in minimally invasive techniques, rising healthcare expenditure, and growing preference for less invasive procedures. Technological improvements leading to improved efficacy and safety are also driving the market forward.
Challenges & Restraints: High regulatory hurdles for new product approvals, stringent quality control standards, potential supply chain disruptions, and intense competition from established players. The high cost of advanced catheters can also limit accessibility in certain markets.
Emerging Opportunities in Micro Guide Catheter Market
Emerging opportunities lie in the development of smart catheters with embedded sensors, improved biocompatible materials, and integration with advanced imaging technologies. Untapped markets in emerging economies present significant growth potential. Furthermore, expansion into new applications, such as oncology and interventional radiology, offers further avenues for market expansion.
Growth Accelerators in the Micro Guide Catheter Market Industry
Technological breakthroughs, strategic partnerships, and expansion into untapped markets are key catalysts for long-term growth. The development of novel materials, such as super-elastic polymers, promises to enhance catheter performance and safety. Strategic collaborations among manufacturers, research institutions, and healthcare providers can accelerate innovation and market penetration. Focus on emerging economies and expansion into new therapeutic areas offer substantial growth potential.
Key Players Shaping the Micro Guide Catheter Market Market
- Asahi Intecc Co Ltd
- Merit Medical Systems
- Terumo Corporation
- Cook Group Incorporated
- Cardinal Health Inc
- Medtronic PLC
- Teleflex Incorporated
- Boston Scientific Corporation
- Integer Holdings Corporation
Notable Milestones in Micro Guide Catheter Market Sector
- 2020: Launch of a novel biocompatible micro guide catheter by Boston Scientific.
- 2021: Merger between two smaller micro guide catheter manufacturers.
- 2022: Approval of a new flow-directed catheter by the FDA.
- 2023: Introduction of a smart micro guide catheter with integrated sensors.
- 2024: Strategic partnership between a major catheter manufacturer and a medical imaging company.
In-Depth Micro Guide Catheter Market Market Outlook
The Micro Guide Catheter market is poised for continued growth, driven by technological advancements, expanding applications, and increasing demand in both developed and emerging markets. Strategic partnerships, investments in R&D, and a focus on developing innovative products will be critical for success. The market presents substantial opportunities for companies with strong technological capabilities and a robust regulatory strategy. The future holds significant potential for market expansion and consolidation.
Micro Guide Catheter Market Segmentation
-
1. Product
- 1.1. Over-the-wire
- 1.2. Flow-directed
-
2. Application
- 2.1. Cardiovascular
- 2.2. Neurovascular
- 2.3. Other Applications
-
3. End User
- 3.1. Hospitals/Clinics
- 3.2. Ambulatory Surgical Centers
Micro Guide Catheter Market Segmentation By Geography
-
1. North America
- 1.1. United States
- 1.2. Canada
- 1.3. Mexico
-
2. Europe
- 2.1. Germany
- 2.2. United Kingdom
- 2.3. France
- 2.4. Italy
- 2.5. Spain
- 2.6. Rest of Europe
-
3. Asia Pacific
- 3.1. China
- 3.2. Japan
- 3.3. India
- 3.4. Australia
- 3.5. South Korea
- 3.6. Rest of Asia Pacific
-
4. Middle East and Africa
- 4.1. GCC
- 4.2. South Africa
- 4.3. Rest of Middle East and Africa
-
5. South America
- 5.1. Brazil
- 5.2. Argentina
- 5.3. Rest of South America
Micro Guide Catheter Market REPORT HIGHLIGHTS
| Aspects | Details |
|---|---|
| Study Period | 2019-2033 |
| Base Year | 2024 |
| Estimated Year | 2025 |
| Forecast Period | 2025-2033 |
| Historical Period | 2019-2024 |
| Growth Rate | CAGR of 7.50% from 2019-2033 |
| Segmentation |
|
Table of Contents
- 1. Introduction
- 1.1. Research Scope
- 1.2. Market Segmentation
- 1.3. Research Methodology
- 1.4. Definitions and Assumptions
- 2. Executive Summary
- 2.1. Introduction
- 3. Market Dynamics
- 3.1. Introduction
- 3.2. Market Drivers
- 3.2.1. ; Growing Burden of Cardiac and Neurovascular Disorders; Increase in Adoption of Minimally Invasive Surgeries; Increasing Geriatric Population
- 3.3. Market Restrains
- 3.3.1. ; Lack of Skilled Physicians; Product Recalls
- 3.4. Market Trends
- 3.4.1. Hospital/Clinics Segment is Expected to Dominate the Market over the Forecast Period
- 4. Market Factor Analysis
- 4.1. Porters Five Forces
- 4.2. Supply/Value Chain
- 4.3. PESTEL analysis
- 4.4. Market Entropy
- 4.5. Patent/Trademark Analysis
- 5. Global Micro Guide Catheter Market Analysis, Insights and Forecast, 2019-2031
- 5.1. Market Analysis, Insights and Forecast - by Product
- 5.1.1. Over-the-wire
- 5.1.2. Flow-directed
- 5.2. Market Analysis, Insights and Forecast - by Application
- 5.2.1. Cardiovascular
- 5.2.2. Neurovascular
- 5.2.3. Other Applications
- 5.3. Market Analysis, Insights and Forecast - by End User
- 5.3.1. Hospitals/Clinics
- 5.3.2. Ambulatory Surgical Centers
- 5.4. Market Analysis, Insights and Forecast - by Region
- 5.4.1. North America
- 5.4.2. Europe
- 5.4.3. Asia Pacific
- 5.4.4. Middle East and Africa
- 5.4.5. South America
- 5.1. Market Analysis, Insights and Forecast - by Product
- 6. North America Micro Guide Catheter Market Analysis, Insights and Forecast, 2019-2031
- 6.1. Market Analysis, Insights and Forecast - by Product
- 6.1.1. Over-the-wire
- 6.1.2. Flow-directed
- 6.2. Market Analysis, Insights and Forecast - by Application
- 6.2.1. Cardiovascular
- 6.2.2. Neurovascular
- 6.2.3. Other Applications
- 6.3. Market Analysis, Insights and Forecast - by End User
- 6.3.1. Hospitals/Clinics
- 6.3.2. Ambulatory Surgical Centers
- 6.1. Market Analysis, Insights and Forecast - by Product
- 7. Europe Micro Guide Catheter Market Analysis, Insights and Forecast, 2019-2031
- 7.1. Market Analysis, Insights and Forecast - by Product
- 7.1.1. Over-the-wire
- 7.1.2. Flow-directed
- 7.2. Market Analysis, Insights and Forecast - by Application
- 7.2.1. Cardiovascular
- 7.2.2. Neurovascular
- 7.2.3. Other Applications
- 7.3. Market Analysis, Insights and Forecast - by End User
- 7.3.1. Hospitals/Clinics
- 7.3.2. Ambulatory Surgical Centers
- 7.1. Market Analysis, Insights and Forecast - by Product
- 8. Asia Pacific Micro Guide Catheter Market Analysis, Insights and Forecast, 2019-2031
- 8.1. Market Analysis, Insights and Forecast - by Product
- 8.1.1. Over-the-wire
- 8.1.2. Flow-directed
- 8.2. Market Analysis, Insights and Forecast - by Application
- 8.2.1. Cardiovascular
- 8.2.2. Neurovascular
- 8.2.3. Other Applications
- 8.3. Market Analysis, Insights and Forecast - by End User
- 8.3.1. Hospitals/Clinics
- 8.3.2. Ambulatory Surgical Centers
- 8.1. Market Analysis, Insights and Forecast - by Product
- 9. Middle East and Africa Micro Guide Catheter Market Analysis, Insights and Forecast, 2019-2031
- 9.1. Market Analysis, Insights and Forecast - by Product
- 9.1.1. Over-the-wire
- 9.1.2. Flow-directed
- 9.2. Market Analysis, Insights and Forecast - by Application
- 9.2.1. Cardiovascular
- 9.2.2. Neurovascular
- 9.2.3. Other Applications
- 9.3. Market Analysis, Insights and Forecast - by End User
- 9.3.1. Hospitals/Clinics
- 9.3.2. Ambulatory Surgical Centers
- 9.1. Market Analysis, Insights and Forecast - by Product
- 10. South America Micro Guide Catheter Market Analysis, Insights and Forecast, 2019-2031
- 10.1. Market Analysis, Insights and Forecast - by Product
- 10.1.1. Over-the-wire
- 10.1.2. Flow-directed
- 10.2. Market Analysis, Insights and Forecast - by Application
- 10.2.1. Cardiovascular
- 10.2.2. Neurovascular
- 10.2.3. Other Applications
- 10.3. Market Analysis, Insights and Forecast - by End User
- 10.3.1. Hospitals/Clinics
- 10.3.2. Ambulatory Surgical Centers
- 10.1. Market Analysis, Insights and Forecast - by Product
- 11. North America Micro Guide Catheter Market Analysis, Insights and Forecast, 2019-2031
- 11.1. Market Analysis, Insights and Forecast - By Country/Sub-region
- 11.1.1. undefined
- 12. Europe Micro Guide Catheter Market Analysis, Insights and Forecast, 2019-2031
- 12.1. Market Analysis, Insights and Forecast - By Country/Sub-region
- 12.1.1. undefined
- 13. Asia Pacific Micro Guide Catheter Market Analysis, Insights and Forecast, 2019-2031
- 13.1. Market Analysis, Insights and Forecast - By Country/Sub-region
- 13.1.1. undefined
- 14. Middle East and Africa Micro Guide Catheter Market Analysis, Insights and Forecast, 2019-2031
- 14.1. Market Analysis, Insights and Forecast - By Country/Sub-region
- 14.1.1. undefined
- 15. South America Micro Guide Catheter Market Analysis, Insights and Forecast, 2019-2031
- 15.1. Market Analysis, Insights and Forecast - By Country/Sub-region
- 15.1.1. undefined
- 16. Competitive Analysis
- 16.1. Global Market Share Analysis 2024
- 16.2. Company Profiles
- 16.2.1 Asahi Intecc Co Ltd
- 16.2.1.1. Overview
- 16.2.1.2. Products
- 16.2.1.3. SWOT Analysis
- 16.2.1.4. Recent Developments
- 16.2.1.5. Financials (Based on Availability)
- 16.2.2 Merit Medical Systems
- 16.2.2.1. Overview
- 16.2.2.2. Products
- 16.2.2.3. SWOT Analysis
- 16.2.2.4. Recent Developments
- 16.2.2.5. Financials (Based on Availability)
- 16.2.3 Terumo Corporation
- 16.2.3.1. Overview
- 16.2.3.2. Products
- 16.2.3.3. SWOT Analysis
- 16.2.3.4. Recent Developments
- 16.2.3.5. Financials (Based on Availability)
- 16.2.4 Cook Group Incorporated
- 16.2.4.1. Overview
- 16.2.4.2. Products
- 16.2.4.3. SWOT Analysis
- 16.2.4.4. Recent Developments
- 16.2.4.5. Financials (Based on Availability)
- 16.2.5 Cardinal Health Inc
- 16.2.5.1. Overview
- 16.2.5.2. Products
- 16.2.5.3. SWOT Analysis
- 16.2.5.4. Recent Developments
- 16.2.5.5. Financials (Based on Availability)
- 16.2.6 Medtronic PLC
- 16.2.6.1. Overview
- 16.2.6.2. Products
- 16.2.6.3. SWOT Analysis
- 16.2.6.4. Recent Developments
- 16.2.6.5. Financials (Based on Availability)
- 16.2.7 Teleflex Incorporated
- 16.2.7.1. Overview
- 16.2.7.2. Products
- 16.2.7.3. SWOT Analysis
- 16.2.7.4. Recent Developments
- 16.2.7.5. Financials (Based on Availability)
- 16.2.8 Boston Scientific Corporation
- 16.2.8.1. Overview
- 16.2.8.2. Products
- 16.2.8.3. SWOT Analysis
- 16.2.8.4. Recent Developments
- 16.2.8.5. Financials (Based on Availability)
- 16.2.9 Integer Holdings Corporation
- 16.2.9.1. Overview
- 16.2.9.2. Products
- 16.2.9.3. SWOT Analysis
- 16.2.9.4. Recent Developments
- 16.2.9.5. Financials (Based on Availability)
- 16.2.1 Asahi Intecc Co Ltd
List of Figures
- Figure 1: Global Micro Guide Catheter Market Revenue Breakdown (Million, %) by Region 2024 & 2032
- Figure 2: Global Micro Guide Catheter Market Volume Breakdown (K Unit, %) by Region 2024 & 2032
- Figure 3: North America Micro Guide Catheter Market Revenue (Million), by Country 2024 & 2032
- Figure 4: North America Micro Guide Catheter Market Volume (K Unit), by Country 2024 & 2032
- Figure 5: North America Micro Guide Catheter Market Revenue Share (%), by Country 2024 & 2032
- Figure 6: North America Micro Guide Catheter Market Volume Share (%), by Country 2024 & 2032
- Figure 7: Europe Micro Guide Catheter Market Revenue (Million), by Country 2024 & 2032
- Figure 8: Europe Micro Guide Catheter Market Volume (K Unit), by Country 2024 & 2032
- Figure 9: Europe Micro Guide Catheter Market Revenue Share (%), by Country 2024 & 2032
- Figure 10: Europe Micro Guide Catheter Market Volume Share (%), by Country 2024 & 2032
- Figure 11: Asia Pacific Micro Guide Catheter Market Revenue (Million), by Country 2024 & 2032
- Figure 12: Asia Pacific Micro Guide Catheter Market Volume (K Unit), by Country 2024 & 2032
- Figure 13: Asia Pacific Micro Guide Catheter Market Revenue Share (%), by Country 2024 & 2032
- Figure 14: Asia Pacific Micro Guide Catheter Market Volume Share (%), by Country 2024 & 2032
- Figure 15: Middle East and Africa Micro Guide Catheter Market Revenue (Million), by Country 2024 & 2032
- Figure 16: Middle East and Africa Micro Guide Catheter Market Volume (K Unit), by Country 2024 & 2032
- Figure 17: Middle East and Africa Micro Guide Catheter Market Revenue Share (%), by Country 2024 & 2032
- Figure 18: Middle East and Africa Micro Guide Catheter Market Volume Share (%), by Country 2024 & 2032
- Figure 19: South America Micro Guide Catheter Market Revenue (Million), by Country 2024 & 2032
- Figure 20: South America Micro Guide Catheter Market Volume (K Unit), by Country 2024 & 2032
- Figure 21: South America Micro Guide Catheter Market Revenue Share (%), by Country 2024 & 2032
- Figure 22: South America Micro Guide Catheter Market Volume Share (%), by Country 2024 & 2032
- Figure 23: North America Micro Guide Catheter Market Revenue (Million), by Product 2024 & 2032
- Figure 24: North America Micro Guide Catheter Market Volume (K Unit), by Product 2024 & 2032
- Figure 25: North America Micro Guide Catheter Market Revenue Share (%), by Product 2024 & 2032
- Figure 26: North America Micro Guide Catheter Market Volume Share (%), by Product 2024 & 2032
- Figure 27: North America Micro Guide Catheter Market Revenue (Million), by Application 2024 & 2032
- Figure 28: North America Micro Guide Catheter Market Volume (K Unit), by Application 2024 & 2032
- Figure 29: North America Micro Guide Catheter Market Revenue Share (%), by Application 2024 & 2032
- Figure 30: North America Micro Guide Catheter Market Volume Share (%), by Application 2024 & 2032
- Figure 31: North America Micro Guide Catheter Market Revenue (Million), by End User 2024 & 2032
- Figure 32: North America Micro Guide Catheter Market Volume (K Unit), by End User 2024 & 2032
- Figure 33: North America Micro Guide Catheter Market Revenue Share (%), by End User 2024 & 2032
- Figure 34: North America Micro Guide Catheter Market Volume Share (%), by End User 2024 & 2032
- Figure 35: North America Micro Guide Catheter Market Revenue (Million), by Country 2024 & 2032
- Figure 36: North America Micro Guide Catheter Market Volume (K Unit), by Country 2024 & 2032
- Figure 37: North America Micro Guide Catheter Market Revenue Share (%), by Country 2024 & 2032
- Figure 38: North America Micro Guide Catheter Market Volume Share (%), by Country 2024 & 2032
- Figure 39: Europe Micro Guide Catheter Market Revenue (Million), by Product 2024 & 2032
- Figure 40: Europe Micro Guide Catheter Market Volume (K Unit), by Product 2024 & 2032
- Figure 41: Europe Micro Guide Catheter Market Revenue Share (%), by Product 2024 & 2032
- Figure 42: Europe Micro Guide Catheter Market Volume Share (%), by Product 2024 & 2032
- Figure 43: Europe Micro Guide Catheter Market Revenue (Million), by Application 2024 & 2032
- Figure 44: Europe Micro Guide Catheter Market Volume (K Unit), by Application 2024 & 2032
- Figure 45: Europe Micro Guide Catheter Market Revenue Share (%), by Application 2024 & 2032
- Figure 46: Europe Micro Guide Catheter Market Volume Share (%), by Application 2024 & 2032
- Figure 47: Europe Micro Guide Catheter Market Revenue (Million), by End User 2024 & 2032
- Figure 48: Europe Micro Guide Catheter Market Volume (K Unit), by End User 2024 & 2032
- Figure 49: Europe Micro Guide Catheter Market Revenue Share (%), by End User 2024 & 2032
- Figure 50: Europe Micro Guide Catheter Market Volume Share (%), by End User 2024 & 2032
- Figure 51: Europe Micro Guide Catheter Market Revenue (Million), by Country 2024 & 2032
- Figure 52: Europe Micro Guide Catheter Market Volume (K Unit), by Country 2024 & 2032
- Figure 53: Europe Micro Guide Catheter Market Revenue Share (%), by Country 2024 & 2032
- Figure 54: Europe Micro Guide Catheter Market Volume Share (%), by Country 2024 & 2032
- Figure 55: Asia Pacific Micro Guide Catheter Market Revenue (Million), by Product 2024 & 2032
- Figure 56: Asia Pacific Micro Guide Catheter Market Volume (K Unit), by Product 2024 & 2032
- Figure 57: Asia Pacific Micro Guide Catheter Market Revenue Share (%), by Product 2024 & 2032
- Figure 58: Asia Pacific Micro Guide Catheter Market Volume Share (%), by Product 2024 & 2032
- Figure 59: Asia Pacific Micro Guide Catheter Market Revenue (Million), by Application 2024 & 2032
- Figure 60: Asia Pacific Micro Guide Catheter Market Volume (K Unit), by Application 2024 & 2032
- Figure 61: Asia Pacific Micro Guide Catheter Market Revenue Share (%), by Application 2024 & 2032
- Figure 62: Asia Pacific Micro Guide Catheter Market Volume Share (%), by Application 2024 & 2032
- Figure 63: Asia Pacific Micro Guide Catheter Market Revenue (Million), by End User 2024 & 2032
- Figure 64: Asia Pacific Micro Guide Catheter Market Volume (K Unit), by End User 2024 & 2032
- Figure 65: Asia Pacific Micro Guide Catheter Market Revenue Share (%), by End User 2024 & 2032
- Figure 66: Asia Pacific Micro Guide Catheter Market Volume Share (%), by End User 2024 & 2032
- Figure 67: Asia Pacific Micro Guide Catheter Market Revenue (Million), by Country 2024 & 2032
- Figure 68: Asia Pacific Micro Guide Catheter Market Volume (K Unit), by Country 2024 & 2032
- Figure 69: Asia Pacific Micro Guide Catheter Market Revenue Share (%), by Country 2024 & 2032
- Figure 70: Asia Pacific Micro Guide Catheter Market Volume Share (%), by Country 2024 & 2032
- Figure 71: Middle East and Africa Micro Guide Catheter Market Revenue (Million), by Product 2024 & 2032
- Figure 72: Middle East and Africa Micro Guide Catheter Market Volume (K Unit), by Product 2024 & 2032
- Figure 73: Middle East and Africa Micro Guide Catheter Market Revenue Share (%), by Product 2024 & 2032
- Figure 74: Middle East and Africa Micro Guide Catheter Market Volume Share (%), by Product 2024 & 2032
- Figure 75: Middle East and Africa Micro Guide Catheter Market Revenue (Million), by Application 2024 & 2032
- Figure 76: Middle East and Africa Micro Guide Catheter Market Volume (K Unit), by Application 2024 & 2032
- Figure 77: Middle East and Africa Micro Guide Catheter Market Revenue Share (%), by Application 2024 & 2032
- Figure 78: Middle East and Africa Micro Guide Catheter Market Volume Share (%), by Application 2024 & 2032
- Figure 79: Middle East and Africa Micro Guide Catheter Market Revenue (Million), by End User 2024 & 2032
- Figure 80: Middle East and Africa Micro Guide Catheter Market Volume (K Unit), by End User 2024 & 2032
- Figure 81: Middle East and Africa Micro Guide Catheter Market Revenue Share (%), by End User 2024 & 2032
- Figure 82: Middle East and Africa Micro Guide Catheter Market Volume Share (%), by End User 2024 & 2032
- Figure 83: Middle East and Africa Micro Guide Catheter Market Revenue (Million), by Country 2024 & 2032
- Figure 84: Middle East and Africa Micro Guide Catheter Market Volume (K Unit), by Country 2024 & 2032
- Figure 85: Middle East and Africa Micro Guide Catheter Market Revenue Share (%), by Country 2024 & 2032
- Figure 86: Middle East and Africa Micro Guide Catheter Market Volume Share (%), by Country 2024 & 2032
- Figure 87: South America Micro Guide Catheter Market Revenue (Million), by Product 2024 & 2032
- Figure 88: South America Micro Guide Catheter Market Volume (K Unit), by Product 2024 & 2032
- Figure 89: South America Micro Guide Catheter Market Revenue Share (%), by Product 2024 & 2032
- Figure 90: South America Micro Guide Catheter Market Volume Share (%), by Product 2024 & 2032
- Figure 91: South America Micro Guide Catheter Market Revenue (Million), by Application 2024 & 2032
- Figure 92: South America Micro Guide Catheter Market Volume (K Unit), by Application 2024 & 2032
- Figure 93: South America Micro Guide Catheter Market Revenue Share (%), by Application 2024 & 2032
- Figure 94: South America Micro Guide Catheter Market Volume Share (%), by Application 2024 & 2032
- Figure 95: South America Micro Guide Catheter Market Revenue (Million), by End User 2024 & 2032
- Figure 96: South America Micro Guide Catheter Market Volume (K Unit), by End User 2024 & 2032
- Figure 97: South America Micro Guide Catheter Market Revenue Share (%), by End User 2024 & 2032
- Figure 98: South America Micro Guide Catheter Market Volume Share (%), by End User 2024 & 2032
- Figure 99: South America Micro Guide Catheter Market Revenue (Million), by Country 2024 & 2032
- Figure 100: South America Micro Guide Catheter Market Volume (K Unit), by Country 2024 & 2032
- Figure 101: South America Micro Guide Catheter Market Revenue Share (%), by Country 2024 & 2032
- Figure 102: South America Micro Guide Catheter Market Volume Share (%), by Country 2024 & 2032
List of Tables
- Table 1: Global Micro Guide Catheter Market Revenue Million Forecast, by Region 2019 & 2032
- Table 2: Global Micro Guide Catheter Market Volume K Unit Forecast, by Region 2019 & 2032
- Table 3: Global Micro Guide Catheter Market Revenue Million Forecast, by Product 2019 & 2032
- Table 4: Global Micro Guide Catheter Market Volume K Unit Forecast, by Product 2019 & 2032
- Table 5: Global Micro Guide Catheter Market Revenue Million Forecast, by Application 2019 & 2032
- Table 6: Global Micro Guide Catheter Market Volume K Unit Forecast, by Application 2019 & 2032
- Table 7: Global Micro Guide Catheter Market Revenue Million Forecast, by End User 2019 & 2032
- Table 8: Global Micro Guide Catheter Market Volume K Unit Forecast, by End User 2019 & 2032
- Table 9: Global Micro Guide Catheter Market Revenue Million Forecast, by Region 2019 & 2032
- Table 10: Global Micro Guide Catheter Market Volume K Unit Forecast, by Region 2019 & 2032
- Table 11: Global Micro Guide Catheter Market Revenue Million Forecast, by Country 2019 & 2032
- Table 12: Global Micro Guide Catheter Market Volume K Unit Forecast, by Country 2019 & 2032
- Table 13: Global Micro Guide Catheter Market Revenue Million Forecast, by Country 2019 & 2032
- Table 14: Global Micro Guide Catheter Market Volume K Unit Forecast, by Country 2019 & 2032
- Table 15: Global Micro Guide Catheter Market Revenue Million Forecast, by Country 2019 & 2032
- Table 16: Global Micro Guide Catheter Market Volume K Unit Forecast, by Country 2019 & 2032
- Table 17: Global Micro Guide Catheter Market Revenue Million Forecast, by Country 2019 & 2032
- Table 18: Global Micro Guide Catheter Market Volume K Unit Forecast, by Country 2019 & 2032
- Table 19: Global Micro Guide Catheter Market Revenue Million Forecast, by Country 2019 & 2032
- Table 20: Global Micro Guide Catheter Market Volume K Unit Forecast, by Country 2019 & 2032
- Table 21: Global Micro Guide Catheter Market Revenue Million Forecast, by Product 2019 & 2032
- Table 22: Global Micro Guide Catheter Market Volume K Unit Forecast, by Product 2019 & 2032
- Table 23: Global Micro Guide Catheter Market Revenue Million Forecast, by Application 2019 & 2032
- Table 24: Global Micro Guide Catheter Market Volume K Unit Forecast, by Application 2019 & 2032
- Table 25: Global Micro Guide Catheter Market Revenue Million Forecast, by End User 2019 & 2032
- Table 26: Global Micro Guide Catheter Market Volume K Unit Forecast, by End User 2019 & 2032
- Table 27: Global Micro Guide Catheter Market Revenue Million Forecast, by Country 2019 & 2032
- Table 28: Global Micro Guide Catheter Market Volume K Unit Forecast, by Country 2019 & 2032
- Table 29: United States Micro Guide Catheter Market Revenue (Million) Forecast, by Application 2019 & 2032
- Table 30: United States Micro Guide Catheter Market Volume (K Unit) Forecast, by Application 2019 & 2032
- Table 31: Canada Micro Guide Catheter Market Revenue (Million) Forecast, by Application 2019 & 2032
- Table 32: Canada Micro Guide Catheter Market Volume (K Unit) Forecast, by Application 2019 & 2032
- Table 33: Mexico Micro Guide Catheter Market Revenue (Million) Forecast, by Application 2019 & 2032
- Table 34: Mexico Micro Guide Catheter Market Volume (K Unit) Forecast, by Application 2019 & 2032
- Table 35: Global Micro Guide Catheter Market Revenue Million Forecast, by Product 2019 & 2032
- Table 36: Global Micro Guide Catheter Market Volume K Unit Forecast, by Product 2019 & 2032
- Table 37: Global Micro Guide Catheter Market Revenue Million Forecast, by Application 2019 & 2032
- Table 38: Global Micro Guide Catheter Market Volume K Unit Forecast, by Application 2019 & 2032
- Table 39: Global Micro Guide Catheter Market Revenue Million Forecast, by End User 2019 & 2032
- Table 40: Global Micro Guide Catheter Market Volume K Unit Forecast, by End User 2019 & 2032
- Table 41: Global Micro Guide Catheter Market Revenue Million Forecast, by Country 2019 & 2032
- Table 42: Global Micro Guide Catheter Market Volume K Unit Forecast, by Country 2019 & 2032
- Table 43: Germany Micro Guide Catheter Market Revenue (Million) Forecast, by Application 2019 & 2032
- Table 44: Germany Micro Guide Catheter Market Volume (K Unit) Forecast, by Application 2019 & 2032
- Table 45: United Kingdom Micro Guide Catheter Market Revenue (Million) Forecast, by Application 2019 & 2032
- Table 46: United Kingdom Micro Guide Catheter Market Volume (K Unit) Forecast, by Application 2019 & 2032
- Table 47: France Micro Guide Catheter Market Revenue (Million) Forecast, by Application 2019 & 2032
- Table 48: France Micro Guide Catheter Market Volume (K Unit) Forecast, by Application 2019 & 2032
- Table 49: Italy Micro Guide Catheter Market Revenue (Million) Forecast, by Application 2019 & 2032
- Table 50: Italy Micro Guide Catheter Market Volume (K Unit) Forecast, by Application 2019 & 2032
- Table 51: Spain Micro Guide Catheter Market Revenue (Million) Forecast, by Application 2019 & 2032
- Table 52: Spain Micro Guide Catheter Market Volume (K Unit) Forecast, by Application 2019 & 2032
- Table 53: Rest of Europe Micro Guide Catheter Market Revenue (Million) Forecast, by Application 2019 & 2032
- Table 54: Rest of Europe Micro Guide Catheter Market Volume (K Unit) Forecast, by Application 2019 & 2032
- Table 55: Global Micro Guide Catheter Market Revenue Million Forecast, by Product 2019 & 2032
- Table 56: Global Micro Guide Catheter Market Volume K Unit Forecast, by Product 2019 & 2032
- Table 57: Global Micro Guide Catheter Market Revenue Million Forecast, by Application 2019 & 2032
- Table 58: Global Micro Guide Catheter Market Volume K Unit Forecast, by Application 2019 & 2032
- Table 59: Global Micro Guide Catheter Market Revenue Million Forecast, by End User 2019 & 2032
- Table 60: Global Micro Guide Catheter Market Volume K Unit Forecast, by End User 2019 & 2032
- Table 61: Global Micro Guide Catheter Market Revenue Million Forecast, by Country 2019 & 2032
- Table 62: Global Micro Guide Catheter Market Volume K Unit Forecast, by Country 2019 & 2032
- Table 63: China Micro Guide Catheter Market Revenue (Million) Forecast, by Application 2019 & 2032
- Table 64: China Micro Guide Catheter Market Volume (K Unit) Forecast, by Application 2019 & 2032
- Table 65: Japan Micro Guide Catheter Market Revenue (Million) Forecast, by Application 2019 & 2032
- Table 66: Japan Micro Guide Catheter Market Volume (K Unit) Forecast, by Application 2019 & 2032
- Table 67: India Micro Guide Catheter Market Revenue (Million) Forecast, by Application 2019 & 2032
- Table 68: India Micro Guide Catheter Market Volume (K Unit) Forecast, by Application 2019 & 2032
- Table 69: Australia Micro Guide Catheter Market Revenue (Million) Forecast, by Application 2019 & 2032
- Table 70: Australia Micro Guide Catheter Market Volume (K Unit) Forecast, by Application 2019 & 2032
- Table 71: South Korea Micro Guide Catheter Market Revenue (Million) Forecast, by Application 2019 & 2032
- Table 72: South Korea Micro Guide Catheter Market Volume (K Unit) Forecast, by Application 2019 & 2032
- Table 73: Rest of Asia Pacific Micro Guide Catheter Market Revenue (Million) Forecast, by Application 2019 & 2032
- Table 74: Rest of Asia Pacific Micro Guide Catheter Market Volume (K Unit) Forecast, by Application 2019 & 2032
- Table 75: Global Micro Guide Catheter Market Revenue Million Forecast, by Product 2019 & 2032
- Table 76: Global Micro Guide Catheter Market Volume K Unit Forecast, by Product 2019 & 2032
- Table 77: Global Micro Guide Catheter Market Revenue Million Forecast, by Application 2019 & 2032
- Table 78: Global Micro Guide Catheter Market Volume K Unit Forecast, by Application 2019 & 2032
- Table 79: Global Micro Guide Catheter Market Revenue Million Forecast, by End User 2019 & 2032
- Table 80: Global Micro Guide Catheter Market Volume K Unit Forecast, by End User 2019 & 2032
- Table 81: Global Micro Guide Catheter Market Revenue Million Forecast, by Country 2019 & 2032
- Table 82: Global Micro Guide Catheter Market Volume K Unit Forecast, by Country 2019 & 2032
- Table 83: GCC Micro Guide Catheter Market Revenue (Million) Forecast, by Application 2019 & 2032
- Table 84: GCC Micro Guide Catheter Market Volume (K Unit) Forecast, by Application 2019 & 2032
- Table 85: South Africa Micro Guide Catheter Market Revenue (Million) Forecast, by Application 2019 & 2032
- Table 86: South Africa Micro Guide Catheter Market Volume (K Unit) Forecast, by Application 2019 & 2032
- Table 87: Rest of Middle East and Africa Micro Guide Catheter Market Revenue (Million) Forecast, by Application 2019 & 2032
- Table 88: Rest of Middle East and Africa Micro Guide Catheter Market Volume (K Unit) Forecast, by Application 2019 & 2032
- Table 89: Global Micro Guide Catheter Market Revenue Million Forecast, by Product 2019 & 2032
- Table 90: Global Micro Guide Catheter Market Volume K Unit Forecast, by Product 2019 & 2032
- Table 91: Global Micro Guide Catheter Market Revenue Million Forecast, by Application 2019 & 2032
- Table 92: Global Micro Guide Catheter Market Volume K Unit Forecast, by Application 2019 & 2032
- Table 93: Global Micro Guide Catheter Market Revenue Million Forecast, by End User 2019 & 2032
- Table 94: Global Micro Guide Catheter Market Volume K Unit Forecast, by End User 2019 & 2032
- Table 95: Global Micro Guide Catheter Market Revenue Million Forecast, by Country 2019 & 2032
- Table 96: Global Micro Guide Catheter Market Volume K Unit Forecast, by Country 2019 & 2032
- Table 97: Brazil Micro Guide Catheter Market Revenue (Million) Forecast, by Application 2019 & 2032
- Table 98: Brazil Micro Guide Catheter Market Volume (K Unit) Forecast, by Application 2019 & 2032
- Table 99: Argentina Micro Guide Catheter Market Revenue (Million) Forecast, by Application 2019 & 2032
- Table 100: Argentina Micro Guide Catheter Market Volume (K Unit) Forecast, by Application 2019 & 2032
- Table 101: Rest of South America Micro Guide Catheter Market Revenue (Million) Forecast, by Application 2019 & 2032
- Table 102: Rest of South America Micro Guide Catheter Market Volume (K Unit) Forecast, by Application 2019 & 2032
Frequently Asked Questions
1. What is the projected Compound Annual Growth Rate (CAGR) of the Micro Guide Catheter Market?
The projected CAGR is approximately 7.50%.
2. Which companies are prominent players in the Micro Guide Catheter Market?
Key companies in the market include Asahi Intecc Co Ltd, Merit Medical Systems, Terumo Corporation, Cook Group Incorporated, Cardinal Health Inc, Medtronic PLC, Teleflex Incorporated, Boston Scientific Corporation, Integer Holdings Corporation.
3. What are the main segments of the Micro Guide Catheter Market?
The market segments include Product, Application, End User.
4. Can you provide details about the market size?
The market size is estimated to be USD XX Million as of 2022.
5. What are some drivers contributing to market growth?
; Growing Burden of Cardiac and Neurovascular Disorders; Increase in Adoption of Minimally Invasive Surgeries; Increasing Geriatric Population.
6. What are the notable trends driving market growth?
Hospital/Clinics Segment is Expected to Dominate the Market over the Forecast Period.
7. Are there any restraints impacting market growth?
; Lack of Skilled Physicians; Product Recalls.
8. Can you provide examples of recent developments in the market?
N/A
9. What pricing options are available for accessing the report?
Pricing options include single-user, multi-user, and enterprise licenses priced at USD 4750, USD 5250, and USD 8750 respectively.
10. Is the market size provided in terms of value or volume?
The market size is provided in terms of value, measured in Million and volume, measured in K Unit.
11. Are there any specific market keywords associated with the report?
Yes, the market keyword associated with the report is "Micro Guide Catheter Market," which aids in identifying and referencing the specific market segment covered.
12. How do I determine which pricing option suits my needs best?
The pricing options vary based on user requirements and access needs. Individual users may opt for single-user licenses, while businesses requiring broader access may choose multi-user or enterprise licenses for cost-effective access to the report.
13. Are there any additional resources or data provided in the Micro Guide Catheter Market report?
While the report offers comprehensive insights, it's advisable to review the specific contents or supplementary materials provided to ascertain if additional resources or data are available.
14. How can I stay updated on further developments or reports in the Micro Guide Catheter Market?
To stay informed about further developments, trends, and reports in the Micro Guide Catheter Market, consider subscribing to industry newsletters, following relevant companies and organizations, or regularly checking reputable industry news sources and publications.
Methodology
Step 1 - Identification of Relevant Samples Size from Population Database


Step 2 - Approaches for Defining Global Market Size (Value, Volume* & Price*)

Note*: In applicable scenarios
Step 3 - Data Sources
Primary Research
- Web Analytics
- Survey Reports
- Research Institute
- Latest Research Reports
- Opinion Leaders
Secondary Research
- Annual Reports
- White Paper
- Latest Press Release
- Industry Association
- Paid Database
- Investor Presentations

Step 4 - Data Triangulation
Involves using different sources of information in order to increase the validity of a study
These sources are likely to be stakeholders in a program - participants, other researchers, program staff, other community members, and so on.
Then we put all data in single framework & apply various statistical tools to find out the dynamic on the market.
During the analysis stage, feedback from the stakeholder groups would be compared to determine areas of agreement as well as areas of divergence


