
Key Insights
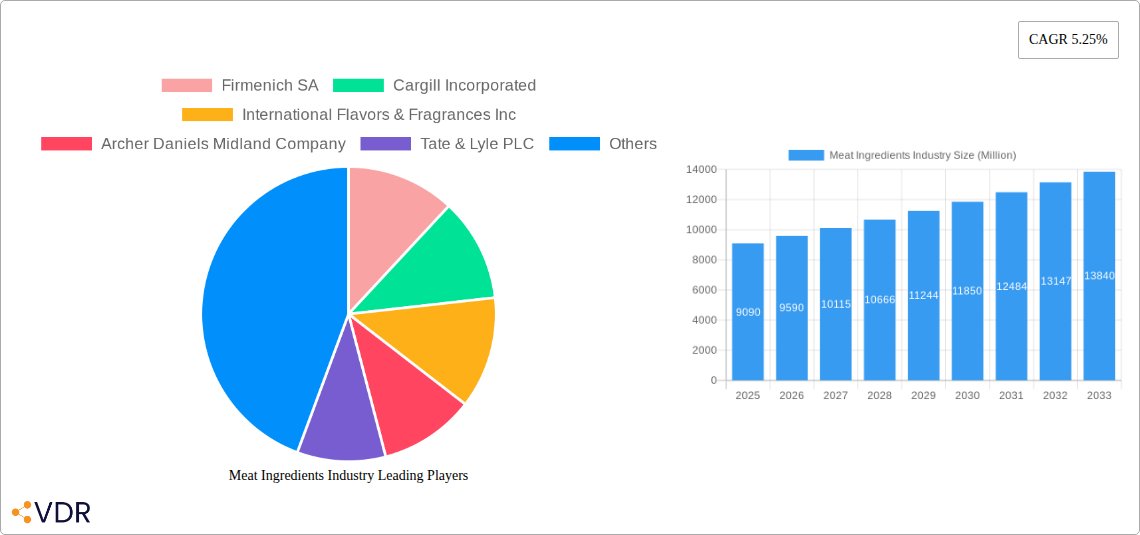
The global meat ingredients market, valued at $9.09 billion in 2025, is projected to experience robust growth, driven by increasing meat consumption, particularly in developing economies, and the rising demand for processed meat products. The market's compound annual growth rate (CAGR) of 5.25% from 2019 to 2024 indicates a consistent upward trajectory, expected to continue through 2033. Key drivers include the expanding food processing industry, the need for cost-effective and convenient meat alternatives, and advancements in food technology leading to innovative ingredient solutions. Growing consumer preference for healthier and more natural meat products is also influencing market trends, with a surge in demand for clean-label ingredients and natural preservatives. However, stringent regulations regarding food safety and labeling, along with fluctuating raw material prices, pose challenges to market growth. The segment analysis reveals that binders, extenders, and fillers constitute a significant portion of the market, reflecting the importance of these ingredients in improving texture and yield in processed meat products. Leading players like Firmenich SA, Cargill Incorporated, and International Flavors & Fragrances Inc. are driving innovation and expanding their product portfolios to cater to evolving consumer demands and industry needs. Geographic segmentation shows a strong presence across North America and Europe, with Asia-Pacific demonstrating significant growth potential due to its burgeoning population and rising disposable incomes.
The market's future growth will largely depend on the successful adaptation of manufacturers to changing consumer preferences, regulatory landscapes, and technological advancements. Continued innovation in meat processing technologies, alongside the development of sustainable and ethically sourced ingredients, will play a pivotal role in shaping the industry's trajectory. The increasing focus on reducing sodium content and improving the nutritional profile of meat products presents both opportunities and challenges. Companies are investing in research and development to create healthier alternatives while maintaining the sensory appeal of meat products, contributing to the continued expansion of the meat ingredients market. Specific regional growth will depend on factors such as economic development, dietary habits, and the prevalence of food processing industries within each area. Competition is intense, with large multinational corporations and smaller specialized companies vying for market share, leading to ongoing innovation and product diversification.
Meat Ingredients Industry Market Report: 2019-2033
This comprehensive report provides a deep dive into the Meat Ingredients Industry, analyzing market dynamics, growth trends, key players, and future opportunities. With a focus on parent and child markets, this study offers actionable insights for industry professionals, investors, and strategic decision-makers. The report covers the period 2019-2033, with a base year of 2025 and a forecast period of 2025-2033. The market size is presented in million units.
Meat Ingredients Industry Market Dynamics & Structure
The Meat Ingredients market is characterized by a moderately concentrated landscape, with several major players holding significant market share. Firmenich SA, Cargill Incorporated, International Flavors & Fragrances Inc., and Archer Daniels Midland Company are among the leading companies, collectively controlling an estimated xx% of the global market in 2025. However, smaller, specialized firms are also significant contributors, particularly in niche segments.
Market growth is fueled by technological innovation in areas such as natural and sustainable ingredients. Stricter food safety regulations and evolving consumer preferences towards healthier, cleaner-label products are major drivers. The industry faces competition from substitute ingredients and faces challenges related to fluctuating raw material prices and supply chain disruptions. Furthermore, M&A activity remains prevalent, with a significant number of deals (xx) recorded between 2019 and 2024, largely driven by expansion into new markets and access to innovative technologies.
- Market Concentration: Moderately concentrated, with top players holding xx% market share (2025).
- Technological Innovation: Focus on natural, sustainable, and clean-label ingredients.
- Regulatory Framework: Stringent food safety and labeling regulations impacting product development.
- Competitive Substitutes: Plant-based alternatives and other functional ingredients present competitive pressure.
- End-User Demographics: Growing demand from processed meat manufacturers and food service industries.
- M&A Trends: Significant M&A activity (xx deals, 2019-2024) driven by expansion and innovation access.
Meat Ingredients Industry Growth Trends & Insights
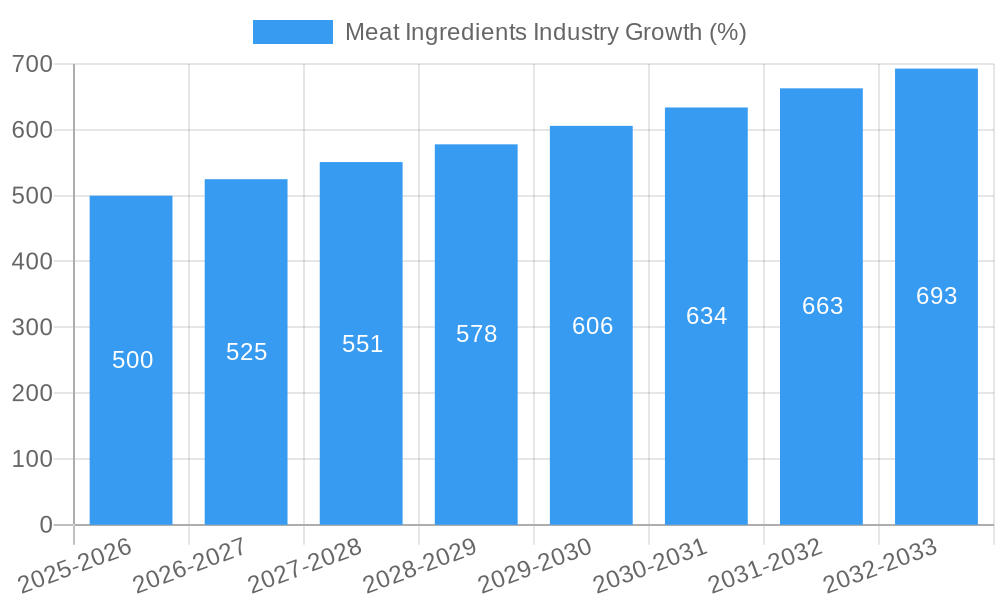
The Meat Ingredients market exhibited a CAGR of xx% during the historical period (2019-2024), reaching a market size of xx million units in 2024. The forecast period (2025-2033) projects continued growth, driven by factors such as increasing meat consumption in developing economies, rising demand for convenient and ready-to-eat meals, and the growing popularity of processed meat products. Technological advancements, specifically in areas like flavor enhancement and preservation, are further boosting market expansion. Consumer preferences are shifting towards healthier and more sustainable meat products, influencing the demand for specific ingredients, such as natural preservatives and coloring agents. Market penetration of innovative ingredients is expected to increase steadily, reaching xx% by 2033.
Dominant Regions, Countries, or Segments in Meat Ingredients Industry
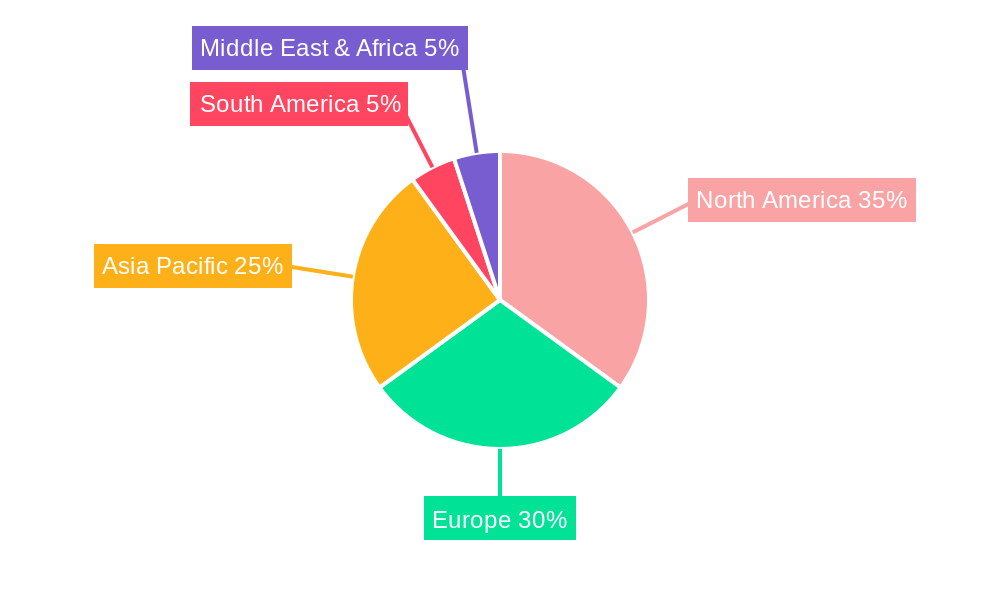
North America currently holds the largest market share in the meat ingredients industry, driven by high meat consumption, established food processing infrastructure, and significant investments in research and development. Europe follows as a substantial market, while Asia-Pacific is experiencing the fastest growth rate due to rapid economic development and increasing demand for processed meat products. Within ingredient segments, Flavoring Agents and Preservatives are currently the most dominant, contributing to a significant portion of the overall market value. This is attributed to the increasing need for enhanced taste and extended shelf life in meat products.
- North America: High meat consumption, advanced infrastructure, and R&D investment drive market dominance.
- Europe: Established market with substantial demand for processed meat and specialized ingredients.
- Asia-Pacific: Fastest-growing region due to rising disposable incomes and increasing meat consumption.
- Dominant Segments: Flavoring Agents and Preservatives lead due to demand for taste enhancement and longer shelf life.
Meat Ingredients Industry Product Landscape
The Meat Ingredients market is marked by a diverse range of products, including binders, extenders, fillers, coloring agents, flavoring agents, preservatives, texturing agents, and salts. Recent innovations focus on natural, clean-label ingredients to meet consumer demands for healthier and more sustainable products. These advancements involve using plant-based alternatives, sustainably sourced materials, and improved processing techniques. The unique selling propositions often center on improved functionality, enhanced sensory attributes, and cost-effectiveness.
Key Drivers, Barriers & Challenges in Meat Ingredients Industry
Key Drivers:
- Rising meat consumption globally.
- Increasing demand for convenient and processed meat products.
- Growing focus on clean-label and natural ingredients.
- Technological advancements in flavor enhancement and preservation.
Key Challenges:
- Fluctuating raw material prices, impacting profitability.
- Stringent regulatory requirements and compliance costs.
- Intense competition from established and emerging players.
- Supply chain disruptions and logistical challenges impacting timely delivery. This resulted in a xx% increase in ingredient costs in 2022.
Emerging Opportunities in Meat Ingredients Industry
- Plant-based meat alternatives: Growing demand for meat alternatives presents opportunities for specialized ingredients.
- Sustainable and ethical sourcing: Consumers are increasingly conscious of sourcing practices, creating demand for sustainably sourced ingredients.
- Functional ingredients: Demand for ingredients with health benefits (e.g., antioxidants, probiotics) is rising.
- Personalized nutrition: Tailoring meat products to specific dietary needs presents growth prospects for specialized ingredients.
Growth Accelerators in the Meat Ingredients Industry
Strategic partnerships and collaborations among ingredient suppliers, food manufacturers, and technology providers are driving market growth. Technological breakthroughs in ingredient modification and processing are enhancing product functionality and efficiency. Expansion into new and emerging markets, particularly in developing economies with increasing meat consumption, presents significant opportunities for future growth.
Key Players Shaping the Meat Ingredients Industry Market
- Firmenich SA
- Cargill Incorporated
- International Flavors & Fragrances Inc
- Archer Daniels Midland Company
- Tate & Lyle PLC
- Koninklijke DSM N V
- Roquette Frères
- Corbion N V
- Ingredion Incorporated
- Givaudan SA
- Süddeutsche Zuckerrübenverwertungs-Genossenschaft eG (Beneo)
- Kerry Group plc
Notable Milestones in Meat Ingredients Industry Sector
- November 2021: Tate & Lyle PLC partnered with Nutriati for chickpea protein distribution.
- February 2022: Givaudan launched PrimeLock+, a plant-based fat mimetic solution.
- May 2022: Kerry Group opened a new EUR 38 million manufacturing plant in Africa.
In-Depth Meat Ingredients Industry Market Outlook
The Meat Ingredients market is poised for significant growth in the coming years, driven by the factors discussed previously. Strategic investments in research and development, expansion into new markets, and a focus on sustainable and innovative ingredients will shape the future landscape. Companies that can effectively adapt to evolving consumer preferences and regulatory requirements will be best positioned for success.
Meat Ingredients Industry Segmentation
-
1. Ingredient
- 1.1. Binders
- 1.2. Extenders
- 1.3. Fillers
- 1.4. Coloring Agents
- 1.5. Flavoring Agents
- 1.6. Preservatives
- 1.7. Texturing Agents
- 1.8. Salts
Meat Ingredients Industry Segmentation By Geography
-
1. North America
- 1.1. United States
- 1.2. Canada
- 1.3. Mexico
- 1.4. Rest of North America
-
2. Europe
- 2.1. Germany
- 2.2. United Kingdom
- 2.3. France
- 2.4. Spain
- 2.5. Italy
- 2.6. Russia
- 2.7. Rest of Europe
-
3. Asia Pacific
- 3.1. China
- 3.2. India
- 3.3. Japan
- 3.4. Australia
- 3.5. Rest of Asia Pacific
-
4. South America
- 4.1. Brazil
- 4.2. Argentina
- 4.3. Rest of South America
- 5. Middle East
-
6. Saudi Arabia
- 6.1. South Africa
- 6.2. Rest of Middle East
Meat Ingredients Industry REPORT HIGHLIGHTS
| Aspects | Details |
|---|---|
| Study Period | 2019-2033 |
| Base Year | 2024 |
| Estimated Year | 2025 |
| Forecast Period | 2025-2033 |
| Historical Period | 2019-2024 |
| Growth Rate | CAGR of 5.25% from 2019-2033 |
| Segmentation |
|
Table of Contents
- 1. Introduction
- 1.1. Research Scope
- 1.2. Market Segmentation
- 1.3. Research Methodology
- 1.4. Definitions and Assumptions
- 2. Executive Summary
- 2.1. Introduction
- 3. Market Dynamics
- 3.1. Introduction
- 3.2. Market Drivers
- 3.2.1. Demand for Vegan and Meat Alternatives; Multi-sensory Medication
- 3.3. Market Restrains
- 3.3.1. Changing Regulatory Landscape
- 3.4. Market Trends
- 3.4.1. Increasing Demand for Clean Label Meat Products
- 4. Market Factor Analysis
- 4.1. Porters Five Forces
- 4.2. Supply/Value Chain
- 4.3. PESTEL analysis
- 4.4. Market Entropy
- 4.5. Patent/Trademark Analysis
- 5. Global Meat Ingredients Industry Analysis, Insights and Forecast, 2019-2031
- 5.1. Market Analysis, Insights and Forecast - by Ingredient
- 5.1.1. Binders
- 5.1.2. Extenders
- 5.1.3. Fillers
- 5.1.4. Coloring Agents
- 5.1.5. Flavoring Agents
- 5.1.6. Preservatives
- 5.1.7. Texturing Agents
- 5.1.8. Salts
- 5.2. Market Analysis, Insights and Forecast - by Region
- 5.2.1. North America
- 5.2.2. Europe
- 5.2.3. Asia Pacific
- 5.2.4. South America
- 5.2.5. Middle East
- 5.2.6. Saudi Arabia
- 5.1. Market Analysis, Insights and Forecast - by Ingredient
- 6. North America Meat Ingredients Industry Analysis, Insights and Forecast, 2019-2031
- 6.1. Market Analysis, Insights and Forecast - by Ingredient
- 6.1.1. Binders
- 6.1.2. Extenders
- 6.1.3. Fillers
- 6.1.4. Coloring Agents
- 6.1.5. Flavoring Agents
- 6.1.6. Preservatives
- 6.1.7. Texturing Agents
- 6.1.8. Salts
- 6.1. Market Analysis, Insights and Forecast - by Ingredient
- 7. Europe Meat Ingredients Industry Analysis, Insights and Forecast, 2019-2031
- 7.1. Market Analysis, Insights and Forecast - by Ingredient
- 7.1.1. Binders
- 7.1.2. Extenders
- 7.1.3. Fillers
- 7.1.4. Coloring Agents
- 7.1.5. Flavoring Agents
- 7.1.6. Preservatives
- 7.1.7. Texturing Agents
- 7.1.8. Salts
- 7.1. Market Analysis, Insights and Forecast - by Ingredient
- 8. Asia Pacific Meat Ingredients Industry Analysis, Insights and Forecast, 2019-2031
- 8.1. Market Analysis, Insights and Forecast - by Ingredient
- 8.1.1. Binders
- 8.1.2. Extenders
- 8.1.3. Fillers
- 8.1.4. Coloring Agents
- 8.1.5. Flavoring Agents
- 8.1.6. Preservatives
- 8.1.7. Texturing Agents
- 8.1.8. Salts
- 8.1. Market Analysis, Insights and Forecast - by Ingredient
- 9. South America Meat Ingredients Industry Analysis, Insights and Forecast, 2019-2031
- 9.1. Market Analysis, Insights and Forecast - by Ingredient
- 9.1.1. Binders
- 9.1.2. Extenders
- 9.1.3. Fillers
- 9.1.4. Coloring Agents
- 9.1.5. Flavoring Agents
- 9.1.6. Preservatives
- 9.1.7. Texturing Agents
- 9.1.8. Salts
- 9.1. Market Analysis, Insights and Forecast - by Ingredient
- 10. Middle East Meat Ingredients Industry Analysis, Insights and Forecast, 2019-2031
- 10.1. Market Analysis, Insights and Forecast - by Ingredient
- 10.1.1. Binders
- 10.1.2. Extenders
- 10.1.3. Fillers
- 10.1.4. Coloring Agents
- 10.1.5. Flavoring Agents
- 10.1.6. Preservatives
- 10.1.7. Texturing Agents
- 10.1.8. Salts
- 10.1. Market Analysis, Insights and Forecast - by Ingredient
- 11. Saudi Arabia Meat Ingredients Industry Analysis, Insights and Forecast, 2019-2031
- 11.1. Market Analysis, Insights and Forecast - by Ingredient
- 11.1.1. Binders
- 11.1.2. Extenders
- 11.1.3. Fillers
- 11.1.4. Coloring Agents
- 11.1.5. Flavoring Agents
- 11.1.6. Preservatives
- 11.1.7. Texturing Agents
- 11.1.8. Salts
- 11.1. Market Analysis, Insights and Forecast - by Ingredient
- 12. North America Meat Ingredients Industry Analysis, Insights and Forecast, 2019-2031
- 12.1. Market Analysis, Insights and Forecast - By Country/Sub-region
- 12.1.1 United States
- 12.1.2 Canada
- 12.1.3 Mexico
- 12.1.4 Rest of North America
- 13. Europe Meat Ingredients Industry Analysis, Insights and Forecast, 2019-2031
- 13.1. Market Analysis, Insights and Forecast - By Country/Sub-region
- 13.1.1 Germany
- 13.1.2 United Kingdom
- 13.1.3 France
- 13.1.4 Spain
- 13.1.5 Italy
- 13.1.6 Russia
- 13.1.7 Rest of Europe
- 14. Asia Pacific Meat Ingredients Industry Analysis, Insights and Forecast, 2019-2031
- 14.1. Market Analysis, Insights and Forecast - By Country/Sub-region
- 14.1.1 China
- 14.1.2 India
- 14.1.3 Japan
- 14.1.4 Australia
- 14.1.5 Rest of Asia Pacific
- 15. South America Meat Ingredients Industry Analysis, Insights and Forecast, 2019-2031
- 15.1. Market Analysis, Insights and Forecast - By Country/Sub-region
- 15.1.1 Brazil
- 15.1.2 Argentina
- 15.1.3 Rest of South America
- 16. Middle East & Africa Meat Ingredients Industry Analysis, Insights and Forecast, 2019-2031
- 16.1. Market Analysis, Insights and Forecast - By Country/Sub-region
- 16.1.1 UAE
- 16.1.2 South Africa
- 16.1.3 Saudi Arabia
- 16.1.4 Rest of MEA
- 17. Competitive Analysis
- 17.1. Global Market Share Analysis 2024
- 17.2. Company Profiles
- 17.2.1 Firmenich SA
- 17.2.1.1. Overview
- 17.2.1.2. Products
- 17.2.1.3. SWOT Analysis
- 17.2.1.4. Recent Developments
- 17.2.1.5. Financials (Based on Availability)
- 17.2.2 Cargill Incorporated
- 17.2.2.1. Overview
- 17.2.2.2. Products
- 17.2.2.3. SWOT Analysis
- 17.2.2.4. Recent Developments
- 17.2.2.5. Financials (Based on Availability)
- 17.2.3 International Flavors & Fragrances Inc
- 17.2.3.1. Overview
- 17.2.3.2. Products
- 17.2.3.3. SWOT Analysis
- 17.2.3.4. Recent Developments
- 17.2.3.5. Financials (Based on Availability)
- 17.2.4 Archer Daniels Midland Company
- 17.2.4.1. Overview
- 17.2.4.2. Products
- 17.2.4.3. SWOT Analysis
- 17.2.4.4. Recent Developments
- 17.2.4.5. Financials (Based on Availability)
- 17.2.5 Tate & Lyle PLC
- 17.2.5.1. Overview
- 17.2.5.2. Products
- 17.2.5.3. SWOT Analysis
- 17.2.5.4. Recent Developments
- 17.2.5.5. Financials (Based on Availability)
- 17.2.6 Koninklijke DSM N V
- 17.2.6.1. Overview
- 17.2.6.2. Products
- 17.2.6.3. SWOT Analysis
- 17.2.6.4. Recent Developments
- 17.2.6.5. Financials (Based on Availability)
- 17.2.7 Roquette Frères
- 17.2.7.1. Overview
- 17.2.7.2. Products
- 17.2.7.3. SWOT Analysis
- 17.2.7.4. Recent Developments
- 17.2.7.5. Financials (Based on Availability)
- 17.2.8 Corbion N V
- 17.2.8.1. Overview
- 17.2.8.2. Products
- 17.2.8.3. SWOT Analysis
- 17.2.8.4. Recent Developments
- 17.2.8.5. Financials (Based on Availability)
- 17.2.9 Ingredion Incorporated
- 17.2.9.1. Overview
- 17.2.9.2. Products
- 17.2.9.3. SWOT Analysis
- 17.2.9.4. Recent Developments
- 17.2.9.5. Financials (Based on Availability)
- 17.2.10 Givaudan SA*List Not Exhaustive
- 17.2.10.1. Overview
- 17.2.10.2. Products
- 17.2.10.3. SWOT Analysis
- 17.2.10.4. Recent Developments
- 17.2.10.5. Financials (Based on Availability)
- 17.2.11 Süddeutsche Zuckerrübenverwertungs-Genossenschaft eG (Beneo)
- 17.2.11.1. Overview
- 17.2.11.2. Products
- 17.2.11.3. SWOT Analysis
- 17.2.11.4. Recent Developments
- 17.2.11.5. Financials (Based on Availability)
- 17.2.12 Kerry Group plc
- 17.2.12.1. Overview
- 17.2.12.2. Products
- 17.2.12.3. SWOT Analysis
- 17.2.12.4. Recent Developments
- 17.2.12.5. Financials (Based on Availability)
- 17.2.1 Firmenich SA
List of Figures
- Figure 1: Global Meat Ingredients Industry Revenue Breakdown (Million, %) by Region 2024 & 2032
- Figure 2: North America Meat Ingredients Industry Revenue (Million), by Country 2024 & 2032
- Figure 3: North America Meat Ingredients Industry Revenue Share (%), by Country 2024 & 2032
- Figure 4: Europe Meat Ingredients Industry Revenue (Million), by Country 2024 & 2032
- Figure 5: Europe Meat Ingredients Industry Revenue Share (%), by Country 2024 & 2032
- Figure 6: Asia Pacific Meat Ingredients Industry Revenue (Million), by Country 2024 & 2032
- Figure 7: Asia Pacific Meat Ingredients Industry Revenue Share (%), by Country 2024 & 2032
- Figure 8: South America Meat Ingredients Industry Revenue (Million), by Country 2024 & 2032
- Figure 9: South America Meat Ingredients Industry Revenue Share (%), by Country 2024 & 2032
- Figure 10: Middle East & Africa Meat Ingredients Industry Revenue (Million), by Country 2024 & 2032
- Figure 11: Middle East & Africa Meat Ingredients Industry Revenue Share (%), by Country 2024 & 2032
- Figure 12: North America Meat Ingredients Industry Revenue (Million), by Ingredient 2024 & 2032
- Figure 13: North America Meat Ingredients Industry Revenue Share (%), by Ingredient 2024 & 2032
- Figure 14: North America Meat Ingredients Industry Revenue (Million), by Country 2024 & 2032
- Figure 15: North America Meat Ingredients Industry Revenue Share (%), by Country 2024 & 2032
- Figure 16: Europe Meat Ingredients Industry Revenue (Million), by Ingredient 2024 & 2032
- Figure 17: Europe Meat Ingredients Industry Revenue Share (%), by Ingredient 2024 & 2032
- Figure 18: Europe Meat Ingredients Industry Revenue (Million), by Country 2024 & 2032
- Figure 19: Europe Meat Ingredients Industry Revenue Share (%), by Country 2024 & 2032
- Figure 20: Asia Pacific Meat Ingredients Industry Revenue (Million), by Ingredient 2024 & 2032
- Figure 21: Asia Pacific Meat Ingredients Industry Revenue Share (%), by Ingredient 2024 & 2032
- Figure 22: Asia Pacific Meat Ingredients Industry Revenue (Million), by Country 2024 & 2032
- Figure 23: Asia Pacific Meat Ingredients Industry Revenue Share (%), by Country 2024 & 2032
- Figure 24: South America Meat Ingredients Industry Revenue (Million), by Ingredient 2024 & 2032
- Figure 25: South America Meat Ingredients Industry Revenue Share (%), by Ingredient 2024 & 2032
- Figure 26: South America Meat Ingredients Industry Revenue (Million), by Country 2024 & 2032
- Figure 27: South America Meat Ingredients Industry Revenue Share (%), by Country 2024 & 2032
- Figure 28: Middle East Meat Ingredients Industry Revenue (Million), by Ingredient 2024 & 2032
- Figure 29: Middle East Meat Ingredients Industry Revenue Share (%), by Ingredient 2024 & 2032
- Figure 30: Middle East Meat Ingredients Industry Revenue (Million), by Country 2024 & 2032
- Figure 31: Middle East Meat Ingredients Industry Revenue Share (%), by Country 2024 & 2032
- Figure 32: Saudi Arabia Meat Ingredients Industry Revenue (Million), by Ingredient 2024 & 2032
- Figure 33: Saudi Arabia Meat Ingredients Industry Revenue Share (%), by Ingredient 2024 & 2032
- Figure 34: Saudi Arabia Meat Ingredients Industry Revenue (Million), by Country 2024 & 2032
- Figure 35: Saudi Arabia Meat Ingredients Industry Revenue Share (%), by Country 2024 & 2032
List of Tables
- Table 1: Global Meat Ingredients Industry Revenue Million Forecast, by Region 2019 & 2032
- Table 2: Global Meat Ingredients Industry Revenue Million Forecast, by Ingredient 2019 & 2032
- Table 3: Global Meat Ingredients Industry Revenue Million Forecast, by Region 2019 & 2032
- Table 4: Global Meat Ingredients Industry Revenue Million Forecast, by Country 2019 & 2032
- Table 5: United States Meat Ingredients Industry Revenue (Million) Forecast, by Application 2019 & 2032
- Table 6: Canada Meat Ingredients Industry Revenue (Million) Forecast, by Application 2019 & 2032
- Table 7: Mexico Meat Ingredients Industry Revenue (Million) Forecast, by Application 2019 & 2032
- Table 8: Rest of North America Meat Ingredients Industry Revenue (Million) Forecast, by Application 2019 & 2032
- Table 9: Global Meat Ingredients Industry Revenue Million Forecast, by Country 2019 & 2032
- Table 10: Germany Meat Ingredients Industry Revenue (Million) Forecast, by Application 2019 & 2032
- Table 11: United Kingdom Meat Ingredients Industry Revenue (Million) Forecast, by Application 2019 & 2032
- Table 12: France Meat Ingredients Industry Revenue (Million) Forecast, by Application 2019 & 2032
- Table 13: Spain Meat Ingredients Industry Revenue (Million) Forecast, by Application 2019 & 2032
- Table 14: Italy Meat Ingredients Industry Revenue (Million) Forecast, by Application 2019 & 2032
- Table 15: Russia Meat Ingredients Industry Revenue (Million) Forecast, by Application 2019 & 2032
- Table 16: Rest of Europe Meat Ingredients Industry Revenue (Million) Forecast, by Application 2019 & 2032
- Table 17: Global Meat Ingredients Industry Revenue Million Forecast, by Country 2019 & 2032
- Table 18: China Meat Ingredients Industry Revenue (Million) Forecast, by Application 2019 & 2032
- Table 19: India Meat Ingredients Industry Revenue (Million) Forecast, by Application 2019 & 2032
- Table 20: Japan Meat Ingredients Industry Revenue (Million) Forecast, by Application 2019 & 2032
- Table 21: Australia Meat Ingredients Industry Revenue (Million) Forecast, by Application 2019 & 2032
- Table 22: Rest of Asia Pacific Meat Ingredients Industry Revenue (Million) Forecast, by Application 2019 & 2032
- Table 23: Global Meat Ingredients Industry Revenue Million Forecast, by Country 2019 & 2032
- Table 24: Brazil Meat Ingredients Industry Revenue (Million) Forecast, by Application 2019 & 2032
- Table 25: Argentina Meat Ingredients Industry Revenue (Million) Forecast, by Application 2019 & 2032
- Table 26: Rest of South America Meat Ingredients Industry Revenue (Million) Forecast, by Application 2019 & 2032
- Table 27: Global Meat Ingredients Industry Revenue Million Forecast, by Country 2019 & 2032
- Table 28: UAE Meat Ingredients Industry Revenue (Million) Forecast, by Application 2019 & 2032
- Table 29: South Africa Meat Ingredients Industry Revenue (Million) Forecast, by Application 2019 & 2032
- Table 30: Saudi Arabia Meat Ingredients Industry Revenue (Million) Forecast, by Application 2019 & 2032
- Table 31: Rest of MEA Meat Ingredients Industry Revenue (Million) Forecast, by Application 2019 & 2032
- Table 32: Global Meat Ingredients Industry Revenue Million Forecast, by Ingredient 2019 & 2032
- Table 33: Global Meat Ingredients Industry Revenue Million Forecast, by Country 2019 & 2032
- Table 34: United States Meat Ingredients Industry Revenue (Million) Forecast, by Application 2019 & 2032
- Table 35: Canada Meat Ingredients Industry Revenue (Million) Forecast, by Application 2019 & 2032
- Table 36: Mexico Meat Ingredients Industry Revenue (Million) Forecast, by Application 2019 & 2032
- Table 37: Rest of North America Meat Ingredients Industry Revenue (Million) Forecast, by Application 2019 & 2032
- Table 38: Global Meat Ingredients Industry Revenue Million Forecast, by Ingredient 2019 & 2032
- Table 39: Global Meat Ingredients Industry Revenue Million Forecast, by Country 2019 & 2032
- Table 40: Germany Meat Ingredients Industry Revenue (Million) Forecast, by Application 2019 & 2032
- Table 41: United Kingdom Meat Ingredients Industry Revenue (Million) Forecast, by Application 2019 & 2032
- Table 42: France Meat Ingredients Industry Revenue (Million) Forecast, by Application 2019 & 2032
- Table 43: Spain Meat Ingredients Industry Revenue (Million) Forecast, by Application 2019 & 2032
- Table 44: Italy Meat Ingredients Industry Revenue (Million) Forecast, by Application 2019 & 2032
- Table 45: Russia Meat Ingredients Industry Revenue (Million) Forecast, by Application 2019 & 2032
- Table 46: Rest of Europe Meat Ingredients Industry Revenue (Million) Forecast, by Application 2019 & 2032
- Table 47: Global Meat Ingredients Industry Revenue Million Forecast, by Ingredient 2019 & 2032
- Table 48: Global Meat Ingredients Industry Revenue Million Forecast, by Country 2019 & 2032
- Table 49: China Meat Ingredients Industry Revenue (Million) Forecast, by Application 2019 & 2032
- Table 50: India Meat Ingredients Industry Revenue (Million) Forecast, by Application 2019 & 2032
- Table 51: Japan Meat Ingredients Industry Revenue (Million) Forecast, by Application 2019 & 2032
- Table 52: Australia Meat Ingredients Industry Revenue (Million) Forecast, by Application 2019 & 2032
- Table 53: Rest of Asia Pacific Meat Ingredients Industry Revenue (Million) Forecast, by Application 2019 & 2032
- Table 54: Global Meat Ingredients Industry Revenue Million Forecast, by Ingredient 2019 & 2032
- Table 55: Global Meat Ingredients Industry Revenue Million Forecast, by Country 2019 & 2032
- Table 56: Brazil Meat Ingredients Industry Revenue (Million) Forecast, by Application 2019 & 2032
- Table 57: Argentina Meat Ingredients Industry Revenue (Million) Forecast, by Application 2019 & 2032
- Table 58: Rest of South America Meat Ingredients Industry Revenue (Million) Forecast, by Application 2019 & 2032
- Table 59: Global Meat Ingredients Industry Revenue Million Forecast, by Ingredient 2019 & 2032
- Table 60: Global Meat Ingredients Industry Revenue Million Forecast, by Country 2019 & 2032
- Table 61: Global Meat Ingredients Industry Revenue Million Forecast, by Ingredient 2019 & 2032
- Table 62: Global Meat Ingredients Industry Revenue Million Forecast, by Country 2019 & 2032
- Table 63: South Africa Meat Ingredients Industry Revenue (Million) Forecast, by Application 2019 & 2032
- Table 64: Rest of Middle East Meat Ingredients Industry Revenue (Million) Forecast, by Application 2019 & 2032
Frequently Asked Questions
1. What is the projected Compound Annual Growth Rate (CAGR) of the Meat Ingredients Industry?
The projected CAGR is approximately 5.25%.
2. Which companies are prominent players in the Meat Ingredients Industry?
Key companies in the market include Firmenich SA, Cargill Incorporated, International Flavors & Fragrances Inc, Archer Daniels Midland Company, Tate & Lyle PLC, Koninklijke DSM N V, Roquette Frères, Corbion N V, Ingredion Incorporated, Givaudan SA*List Not Exhaustive, Süddeutsche Zuckerrübenverwertungs-Genossenschaft eG (Beneo), Kerry Group plc.
3. What are the main segments of the Meat Ingredients Industry?
The market segments include Ingredient.
4. Can you provide details about the market size?
The market size is estimated to be USD 9.09 Million as of 2022.
5. What are some drivers contributing to market growth?
Demand for Vegan and Meat Alternatives; Multi-sensory Medication.
6. What are the notable trends driving market growth?
Increasing Demand for Clean Label Meat Products.
7. Are there any restraints impacting market growth?
Changing Regulatory Landscape.
8. Can you provide examples of recent developments in the market?
May 2022: Kerry Group opened a new EUR 38 million (USD 40 million) manufacturing plant in Africa. The 10,000-square-meter plant is to produce sustainable nutrition products that will be consumed across Africa. The facility will advance Kerry's F&B production capacity by 40% to 40,000 tons per annum and expect to reach 50,000 tons in a future expansion.
9. What pricing options are available for accessing the report?
Pricing options include single-user, multi-user, and enterprise licenses priced at USD 4750, USD 5250, and USD 8750 respectively.
10. Is the market size provided in terms of value or volume?
The market size is provided in terms of value, measured in Million.
11. Are there any specific market keywords associated with the report?
Yes, the market keyword associated with the report is "Meat Ingredients Industry," which aids in identifying and referencing the specific market segment covered.
12. How do I determine which pricing option suits my needs best?
The pricing options vary based on user requirements and access needs. Individual users may opt for single-user licenses, while businesses requiring broader access may choose multi-user or enterprise licenses for cost-effective access to the report.
13. Are there any additional resources or data provided in the Meat Ingredients Industry report?
While the report offers comprehensive insights, it's advisable to review the specific contents or supplementary materials provided to ascertain if additional resources or data are available.
14. How can I stay updated on further developments or reports in the Meat Ingredients Industry?
To stay informed about further developments, trends, and reports in the Meat Ingredients Industry, consider subscribing to industry newsletters, following relevant companies and organizations, or regularly checking reputable industry news sources and publications.
Methodology
Step 1 - Identification of Relevant Samples Size from Population Database


Step 2 - Approaches for Defining Global Market Size (Value, Volume* & Price*)

Note*: In applicable scenarios
Step 3 - Data Sources
Primary Research
- Web Analytics
- Survey Reports
- Research Institute
- Latest Research Reports
- Opinion Leaders
Secondary Research
- Annual Reports
- White Paper
- Latest Press Release
- Industry Association
- Paid Database
- Investor Presentations

Step 4 - Data Triangulation
Involves using different sources of information in order to increase the validity of a study
These sources are likely to be stakeholders in a program - participants, other researchers, program staff, other community members, and so on.
Then we put all data in single framework & apply various statistical tools to find out the dynamic on the market.
During the analysis stage, feedback from the stakeholder groups would be compared to determine areas of agreement as well as areas of divergence


