
Key Insights
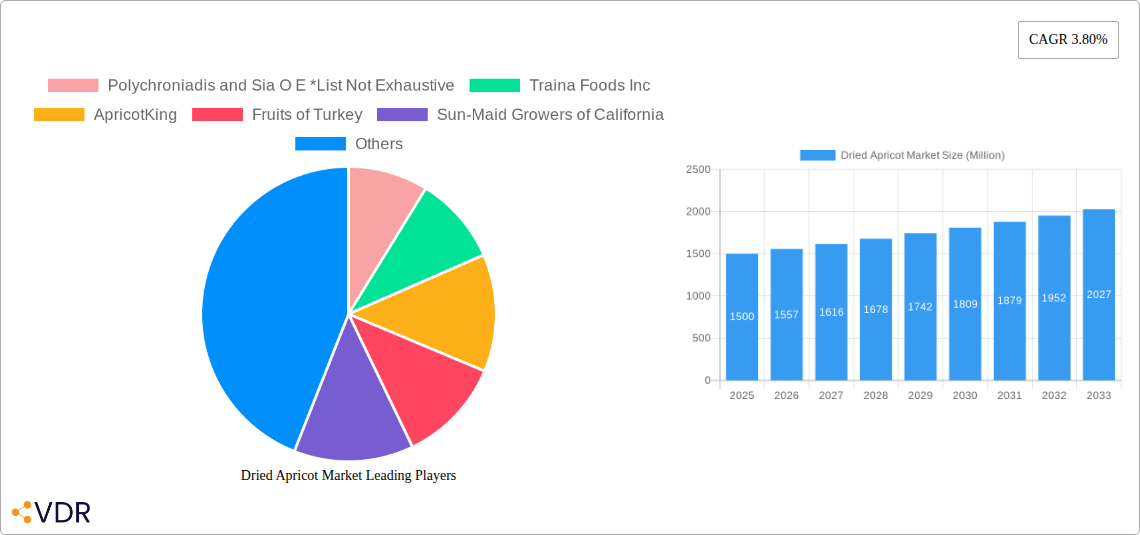
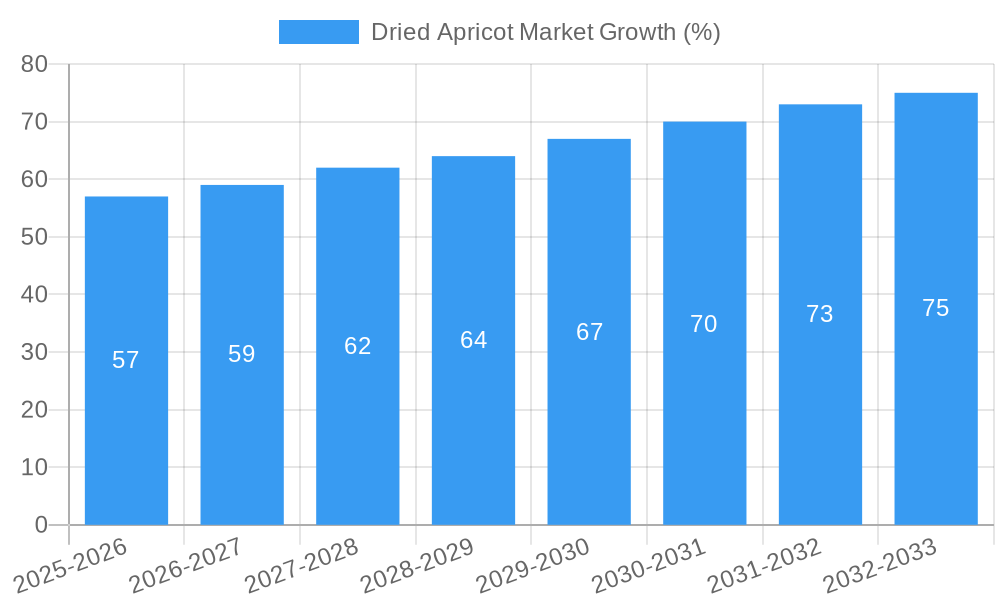
The global dried apricot market, valued at approximately $1.5 billion in 2025, is projected to experience steady growth, driven by increasing consumer demand for convenient and nutritious snacks. A compound annual growth rate (CAGR) of 3.8% is anticipated from 2025 to 2033, leading to a market size exceeding $2.2 billion by the end of the forecast period. Several factors contribute to this positive outlook. The rising popularity of health-conscious diets, emphasizing natural and minimally processed foods, fuels the demand for dried apricots, rich in fiber, vitamins, and antioxidants. Furthermore, the growing adoption of dried apricots in various food products, including breakfast cereals, baked goods, and confectionery, expands market opportunities. The market segmentation reveals a strong preference for conventional dried apricots, followed by organic varieties, with whole apricots dominating the form segment. Supermarkets and hypermarkets remain the primary distribution channel, though convenience stores and specialist retailers are also experiencing growth. Key players, such as Sun-Maid Growers of California and Bergin Fruit and Nut Company, are leveraging brand recognition and established distribution networks to maintain a competitive edge.
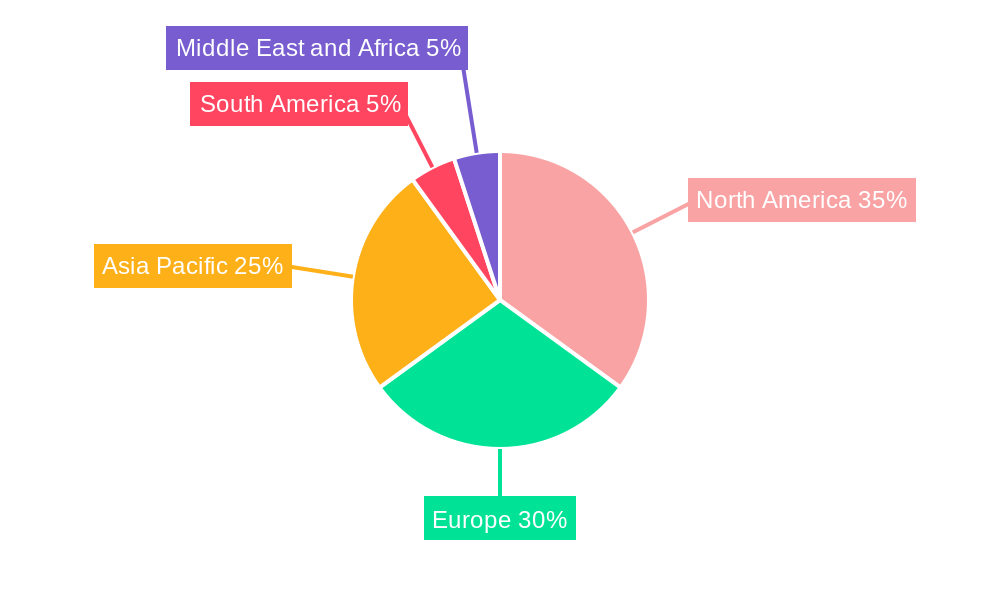
Geographic analysis suggests that North America and Europe currently hold the largest market shares, driven by high per capita consumption and strong consumer awareness of dried apricots' health benefits. However, Asia Pacific, particularly China and India, is expected to witness significant growth in the coming years due to rising disposable incomes and expanding middle classes. While the market faces challenges such as price fluctuations due to climate change and supply chain disruptions, the overall growth trajectory remains positive. The introduction of innovative product formats, such as flavored dried apricots and convenient snack packs, along with marketing efforts that highlight the health benefits, will be crucial for continued market expansion. Moreover, addressing concerns about pesticide residues and ensuring sustainable farming practices are becoming increasingly important to cater to the growing preference for organic and sustainably sourced products.
Dried Apricot Market: A Comprehensive Report (2019-2033)
This comprehensive report provides an in-depth analysis of the Dried Apricot Market, encompassing market dynamics, growth trends, regional analysis, competitive landscape, and future outlook. The study period covers 2019-2033, with 2025 as the base and estimated year. The report segments the market by type (conventional, organic), form (whole, diced, powdered), and distribution channel (supermarkets/hypermarkets, convenience stores, specialist retailers, other channels), providing granular insights into this dynamic industry. The parent market is the dried fruit market, while the child market is specifically dried apricots. This report is essential for industry professionals, investors, and anyone seeking a detailed understanding of the Dried Apricot Market. Market values are presented in million units.
Dried Apricot Market Market Dynamics & Structure
The Dried Apricot Market exhibits a moderately consolidated structure, with several key players holding significant market share. Market concentration is influenced by factors such as economies of scale in production and distribution, as well as brand recognition. Technological innovation, primarily in processing and packaging, plays a vital role in enhancing product quality, shelf life, and consumer appeal. Regulatory frameworks concerning food safety and labeling impact production practices and market access. Competition from other dried fruits and snack options poses a challenge, while mergers and acquisitions (M&A) activity shapes the competitive landscape.
- Market Concentration: xx% of the market is controlled by the top 5 players in 2025.
- Technological Innovation: Focus on improved drying techniques, packaging to extend shelf life, and sustainable sourcing.
- Regulatory Framework: Compliance with food safety standards and labeling regulations varies across regions.
- Competitive Substitutes: Raisins, prunes, dates, and other dried fruits compete for consumer spending.
- M&A Activity: An average of xx M&A deals per year were recorded during 2019-2024.
- Innovation Barriers: High initial investment costs for advanced technology and stringent regulatory compliance.
Dried Apricot Market Growth Trends & Insights
The Dried Apricot Market witnessed robust growth during the historical period (2019-2024), driven by increasing consumer demand for healthy snacks and convenient food options. The market is projected to continue its expansion during the forecast period (2025-2033), fueled by rising health consciousness, growing adoption of plant-based diets, and expanding distribution networks. Technological advancements, such as improved drying techniques and innovative packaging solutions, contribute to enhanced product quality and shelf life, further stimulating market growth. Consumer behavior shifts towards healthier lifestyles and the increasing popularity of dried apricots in various food applications (e.g., baking, confectionery) are key growth drivers. The CAGR for the Dried Apricot Market is projected to be xx% during 2025-2033. Market penetration for organic dried apricots is expected to reach xx% by 2033.
Dominant Regions, Countries, or Segments in Dried Apricot Market
The dominant region in the Dried Apricot Market is currently [Region Name], accounting for xx% of the global market share in 2025. This dominance is driven by factors including favorable climatic conditions for apricot cultivation, robust agricultural infrastructure, and strong local demand. [Country Name] is a leading country within this region, boasting a thriving dried apricot industry. Within the segment analysis:
Type: The Conventional segment holds the largest market share (xx%), followed by the Organic segment (xx%).
Form: The Whole segment dominates (xx%), with Diced and Powdered segments showing significant growth potential.
Distribution Channel: Supermarkets/Hypermarkets are the leading distribution channel (xx%), followed by convenience stores and specialist retailers.
Key Drivers for [Region Name]: Favorable growing conditions, established supply chains, strong export capabilities.
Key Drivers for [Country Name]: Government support for agricultural sector, efficient processing infrastructure.
Dried Apricot Market Product Landscape
Dried apricot products are continually evolving, with a focus on enhanced quality, convenience, and diverse applications. Innovations include new drying techniques that preserve nutrient content and flavor, along with convenient packaging formats such as resealable pouches and individual servings. Value-added products, like flavored or sweetened dried apricots, are gaining traction among consumers. The emphasis is on natural ingredients, clean labels, and sustainability.
Key Drivers, Barriers & Challenges in Dried Apricot Market
Key Drivers:
- Rising health consciousness and increasing demand for healthy snacks.
- Growing preference for natural and organic food products.
- Expanding distribution networks and increased market accessibility.
Challenges & Restraints:
- Fluctuations in apricot yields due to weather conditions impacting supply.
- Price volatility of raw materials and transportation costs.
- Intense competition from other dried fruits and snack alternatives.
Emerging Opportunities in Dried Apricot Market
Emerging opportunities include expanding into untapped markets in developing economies, developing innovative product formats (e.g., energy bars, trail mixes), and catering to specific dietary needs (e.g., gluten-free, vegan). Focus on sustainability initiatives and eco-friendly packaging also presents significant opportunities. The growing demand for functional foods may lead to more products fortified with vitamins or minerals.
Growth Accelerators in the Dried Apricot Market Industry
Technological advancements in drying and processing techniques, strategic partnerships between producers and retailers, and expansion into new geographical markets are key growth accelerators. Increased investments in research and development to create value-added products and sustainable practices will also propel market growth.
Key Players Shaping the Dried Apricot Market Market
- Polychroniadis and Sia O E
- Traina Foods Inc
- ApricotKing
- Fruits of Turkey
- Sun-Maid Growers of California
- Bergin Fruit and Nut Company
- Purcell Mountain Farms
Notable Milestones in Dried Apricot Market Sector
- 2021: Launch of a new line of organic dried apricots by [Company Name].
- 2022: Acquisition of [Company A] by [Company B], expanding market reach.
- 2023: Introduction of innovative packaging technology extending shelf life by xx%.
- 2024: Significant investment in sustainable farming practices by several key players.
In-Depth Dried Apricot Market Market Outlook
The Dried Apricot Market is poised for continued growth, driven by increasing consumer preference for healthy and convenient snacks. Strategic investments in innovation, sustainable sourcing, and market expansion will be crucial for players to maintain competitiveness. The focus on value-added products, functional foods, and environmentally friendly practices will shape the future of this market. The market is projected to reach xx million units by 2033, representing significant growth potential for industry stakeholders.
Dried Apricot Market Segmentation
-
1. Type
- 1.1. Conventional
- 1.2. Organic
-
2. Form
- 2.1. Whole
- 2.2. Diced
- 2.3. Powdered
-
3. Distribution Channel
- 3.1. Supermarkets/Hypermarkets
- 3.2. Convenience Stores
- 3.3. Specialist Retailers
- 3.4. Other Channels
Dried Apricot Market Segmentation By Geography
-
1. North America
- 1.1. United States
- 1.2. Canada
- 1.3. Mexico
- 1.4. Rest of North America
-
2. Europe
- 2.1. Germany
- 2.2. United Kingdom
- 2.3. France
- 2.4. Spain
- 2.5. Russia
- 2.6. Italy
- 2.7. Rest of Europe
-
3. Asia Pacific
- 3.1. China
- 3.2. Japan
- 3.3. India
- 3.4. Australia
- 3.5. Rest of Asia Pacific
-
4. South America
- 4.1. Brazil
- 4.2. Argentina
- 4.3. Rest of South America
-
5. Middle East and Africa
- 5.1. Turkey
- 5.2. Saudi Arabia
- 5.3. South Africa
- 5.4. Rest of Middle East and Africa
Dried Apricot Market REPORT HIGHLIGHTS
| Aspects | Details |
|---|---|
| Study Period | 2019-2033 |
| Base Year | 2024 |
| Estimated Year | 2025 |
| Forecast Period | 2025-2033 |
| Historical Period | 2019-2024 |
| Growth Rate | CAGR of 3.80% from 2019-2033 |
| Segmentation |
|
Table of Contents
- 1. Introduction
- 1.1. Research Scope
- 1.2. Market Segmentation
- 1.3. Research Methodology
- 1.4. Definitions and Assumptions
- 2. Executive Summary
- 2.1. Introduction
- 3. Market Dynamics
- 3.1. Introduction
- 3.2. Market Drivers
- 3.2.1. Increasing application of Gelatin in healthcare and pharmaceutical sector
- 3.3. Market Restrains
- 3.3.1. Rising demand for clean label products
- 3.4. Market Trends
- 3.4.1. Increasing Demand for Organic Dried Apricots
- 4. Market Factor Analysis
- 4.1. Porters Five Forces
- 4.2. Supply/Value Chain
- 4.3. PESTEL analysis
- 4.4. Market Entropy
- 4.5. Patent/Trademark Analysis
- 5. Global Dried Apricot Market Analysis, Insights and Forecast, 2019-2031
- 5.1. Market Analysis, Insights and Forecast - by Type
- 5.1.1. Conventional
- 5.1.2. Organic
- 5.2. Market Analysis, Insights and Forecast - by Form
- 5.2.1. Whole
- 5.2.2. Diced
- 5.2.3. Powdered
- 5.3. Market Analysis, Insights and Forecast - by Distribution Channel
- 5.3.1. Supermarkets/Hypermarkets
- 5.3.2. Convenience Stores
- 5.3.3. Specialist Retailers
- 5.3.4. Other Channels
- 5.4. Market Analysis, Insights and Forecast - by Region
- 5.4.1. North America
- 5.4.2. Europe
- 5.4.3. Asia Pacific
- 5.4.4. South America
- 5.4.5. Middle East and Africa
- 5.1. Market Analysis, Insights and Forecast - by Type
- 6. North America Dried Apricot Market Analysis, Insights and Forecast, 2019-2031
- 6.1. Market Analysis, Insights and Forecast - by Type
- 6.1.1. Conventional
- 6.1.2. Organic
- 6.2. Market Analysis, Insights and Forecast - by Form
- 6.2.1. Whole
- 6.2.2. Diced
- 6.2.3. Powdered
- 6.3. Market Analysis, Insights and Forecast - by Distribution Channel
- 6.3.1. Supermarkets/Hypermarkets
- 6.3.2. Convenience Stores
- 6.3.3. Specialist Retailers
- 6.3.4. Other Channels
- 6.1. Market Analysis, Insights and Forecast - by Type
- 7. Europe Dried Apricot Market Analysis, Insights and Forecast, 2019-2031
- 7.1. Market Analysis, Insights and Forecast - by Type
- 7.1.1. Conventional
- 7.1.2. Organic
- 7.2. Market Analysis, Insights and Forecast - by Form
- 7.2.1. Whole
- 7.2.2. Diced
- 7.2.3. Powdered
- 7.3. Market Analysis, Insights and Forecast - by Distribution Channel
- 7.3.1. Supermarkets/Hypermarkets
- 7.3.2. Convenience Stores
- 7.3.3. Specialist Retailers
- 7.3.4. Other Channels
- 7.1. Market Analysis, Insights and Forecast - by Type
- 8. Asia Pacific Dried Apricot Market Analysis, Insights and Forecast, 2019-2031
- 8.1. Market Analysis, Insights and Forecast - by Type
- 8.1.1. Conventional
- 8.1.2. Organic
- 8.2. Market Analysis, Insights and Forecast - by Form
- 8.2.1. Whole
- 8.2.2. Diced
- 8.2.3. Powdered
- 8.3. Market Analysis, Insights and Forecast - by Distribution Channel
- 8.3.1. Supermarkets/Hypermarkets
- 8.3.2. Convenience Stores
- 8.3.3. Specialist Retailers
- 8.3.4. Other Channels
- 8.1. Market Analysis, Insights and Forecast - by Type
- 9. South America Dried Apricot Market Analysis, Insights and Forecast, 2019-2031
- 9.1. Market Analysis, Insights and Forecast - by Type
- 9.1.1. Conventional
- 9.1.2. Organic
- 9.2. Market Analysis, Insights and Forecast - by Form
- 9.2.1. Whole
- 9.2.2. Diced
- 9.2.3. Powdered
- 9.3. Market Analysis, Insights and Forecast - by Distribution Channel
- 9.3.1. Supermarkets/Hypermarkets
- 9.3.2. Convenience Stores
- 9.3.3. Specialist Retailers
- 9.3.4. Other Channels
- 9.1. Market Analysis, Insights and Forecast - by Type
- 10. Middle East and Africa Dried Apricot Market Analysis, Insights and Forecast, 2019-2031
- 10.1. Market Analysis, Insights and Forecast - by Type
- 10.1.1. Conventional
- 10.1.2. Organic
- 10.2. Market Analysis, Insights and Forecast - by Form
- 10.2.1. Whole
- 10.2.2. Diced
- 10.2.3. Powdered
- 10.3. Market Analysis, Insights and Forecast - by Distribution Channel
- 10.3.1. Supermarkets/Hypermarkets
- 10.3.2. Convenience Stores
- 10.3.3. Specialist Retailers
- 10.3.4. Other Channels
- 10.1. Market Analysis, Insights and Forecast - by Type
- 11. North America Dried Apricot Market Analysis, Insights and Forecast, 2019-2031
- 11.1. Market Analysis, Insights and Forecast - By Country/Sub-region
- 11.1.1 United States
- 11.1.2 Canada
- 11.1.3 Mexico
- 11.1.4 Rest of North America
- 12. Europe Dried Apricot Market Analysis, Insights and Forecast, 2019-2031
- 12.1. Market Analysis, Insights and Forecast - By Country/Sub-region
- 12.1.1 Germany
- 12.1.2 United Kingdom
- 12.1.3 France
- 12.1.4 Spain
- 12.1.5 Russia
- 12.1.6 Italy
- 12.1.7 Rest of Europe
- 13. Asia Pacific Dried Apricot Market Analysis, Insights and Forecast, 2019-2031
- 13.1. Market Analysis, Insights and Forecast - By Country/Sub-region
- 13.1.1 China
- 13.1.2 Japan
- 13.1.3 India
- 13.1.4 Australia
- 13.1.5 Rest of Asia Pacific
- 14. South America Dried Apricot Market Analysis, Insights and Forecast, 2019-2031
- 14.1. Market Analysis, Insights and Forecast - By Country/Sub-region
- 14.1.1 Brazil
- 14.1.2 Argentina
- 14.1.3 Rest of South America
- 15. Middle East and Africa Dried Apricot Market Analysis, Insights and Forecast, 2019-2031
- 15.1. Market Analysis, Insights and Forecast - By Country/Sub-region
- 15.1.1 Turkey
- 15.1.2 Saudi Arabia
- 15.1.3 South Africa
- 15.1.4 Rest of Middle East and Africa
- 16. Competitive Analysis
- 16.1. Global Market Share Analysis 2024
- 16.2. Company Profiles
- 16.2.1 Polychroniadis and Sia O E *List Not Exhaustive
- 16.2.1.1. Overview
- 16.2.1.2. Products
- 16.2.1.3. SWOT Analysis
- 16.2.1.4. Recent Developments
- 16.2.1.5. Financials (Based on Availability)
- 16.2.2 Traina Foods Inc
- 16.2.2.1. Overview
- 16.2.2.2. Products
- 16.2.2.3. SWOT Analysis
- 16.2.2.4. Recent Developments
- 16.2.2.5. Financials (Based on Availability)
- 16.2.3 ApricotKing
- 16.2.3.1. Overview
- 16.2.3.2. Products
- 16.2.3.3. SWOT Analysis
- 16.2.3.4. Recent Developments
- 16.2.3.5. Financials (Based on Availability)
- 16.2.4 Fruits of Turkey
- 16.2.4.1. Overview
- 16.2.4.2. Products
- 16.2.4.3. SWOT Analysis
- 16.2.4.4. Recent Developments
- 16.2.4.5. Financials (Based on Availability)
- 16.2.5 Sun-Maid Growers of California
- 16.2.5.1. Overview
- 16.2.5.2. Products
- 16.2.5.3. SWOT Analysis
- 16.2.5.4. Recent Developments
- 16.2.5.5. Financials (Based on Availability)
- 16.2.6 Bergin Fruit and Nut Company
- 16.2.6.1. Overview
- 16.2.6.2. Products
- 16.2.6.3. SWOT Analysis
- 16.2.6.4. Recent Developments
- 16.2.6.5. Financials (Based on Availability)
- 16.2.7 Purcell Mountain Farms
- 16.2.7.1. Overview
- 16.2.7.2. Products
- 16.2.7.3. SWOT Analysis
- 16.2.7.4. Recent Developments
- 16.2.7.5. Financials (Based on Availability)
- 16.2.1 Polychroniadis and Sia O E *List Not Exhaustive
List of Figures
- Figure 1: Global Dried Apricot Market Revenue Breakdown (Million, %) by Region 2024 & 2032
- Figure 2: Global Dried Apricot Market Volume Breakdown (K Units, %) by Region 2024 & 2032
- Figure 3: North America Dried Apricot Market Revenue (Million), by Country 2024 & 2032
- Figure 4: North America Dried Apricot Market Volume (K Units), by Country 2024 & 2032
- Figure 5: North America Dried Apricot Market Revenue Share (%), by Country 2024 & 2032
- Figure 6: North America Dried Apricot Market Volume Share (%), by Country 2024 & 2032
- Figure 7: Europe Dried Apricot Market Revenue (Million), by Country 2024 & 2032
- Figure 8: Europe Dried Apricot Market Volume (K Units), by Country 2024 & 2032
- Figure 9: Europe Dried Apricot Market Revenue Share (%), by Country 2024 & 2032
- Figure 10: Europe Dried Apricot Market Volume Share (%), by Country 2024 & 2032
- Figure 11: Asia Pacific Dried Apricot Market Revenue (Million), by Country 2024 & 2032
- Figure 12: Asia Pacific Dried Apricot Market Volume (K Units), by Country 2024 & 2032
- Figure 13: Asia Pacific Dried Apricot Market Revenue Share (%), by Country 2024 & 2032
- Figure 14: Asia Pacific Dried Apricot Market Volume Share (%), by Country 2024 & 2032
- Figure 15: South America Dried Apricot Market Revenue (Million), by Country 2024 & 2032
- Figure 16: South America Dried Apricot Market Volume (K Units), by Country 2024 & 2032
- Figure 17: South America Dried Apricot Market Revenue Share (%), by Country 2024 & 2032
- Figure 18: South America Dried Apricot Market Volume Share (%), by Country 2024 & 2032
- Figure 19: Middle East and Africa Dried Apricot Market Revenue (Million), by Country 2024 & 2032
- Figure 20: Middle East and Africa Dried Apricot Market Volume (K Units), by Country 2024 & 2032
- Figure 21: Middle East and Africa Dried Apricot Market Revenue Share (%), by Country 2024 & 2032
- Figure 22: Middle East and Africa Dried Apricot Market Volume Share (%), by Country 2024 & 2032
- Figure 23: North America Dried Apricot Market Revenue (Million), by Type 2024 & 2032
- Figure 24: North America Dried Apricot Market Volume (K Units), by Type 2024 & 2032
- Figure 25: North America Dried Apricot Market Revenue Share (%), by Type 2024 & 2032
- Figure 26: North America Dried Apricot Market Volume Share (%), by Type 2024 & 2032
- Figure 27: North America Dried Apricot Market Revenue (Million), by Form 2024 & 2032
- Figure 28: North America Dried Apricot Market Volume (K Units), by Form 2024 & 2032
- Figure 29: North America Dried Apricot Market Revenue Share (%), by Form 2024 & 2032
- Figure 30: North America Dried Apricot Market Volume Share (%), by Form 2024 & 2032
- Figure 31: North America Dried Apricot Market Revenue (Million), by Distribution Channel 2024 & 2032
- Figure 32: North America Dried Apricot Market Volume (K Units), by Distribution Channel 2024 & 2032
- Figure 33: North America Dried Apricot Market Revenue Share (%), by Distribution Channel 2024 & 2032
- Figure 34: North America Dried Apricot Market Volume Share (%), by Distribution Channel 2024 & 2032
- Figure 35: North America Dried Apricot Market Revenue (Million), by Country 2024 & 2032
- Figure 36: North America Dried Apricot Market Volume (K Units), by Country 2024 & 2032
- Figure 37: North America Dried Apricot Market Revenue Share (%), by Country 2024 & 2032
- Figure 38: North America Dried Apricot Market Volume Share (%), by Country 2024 & 2032
- Figure 39: Europe Dried Apricot Market Revenue (Million), by Type 2024 & 2032
- Figure 40: Europe Dried Apricot Market Volume (K Units), by Type 2024 & 2032
- Figure 41: Europe Dried Apricot Market Revenue Share (%), by Type 2024 & 2032
- Figure 42: Europe Dried Apricot Market Volume Share (%), by Type 2024 & 2032
- Figure 43: Europe Dried Apricot Market Revenue (Million), by Form 2024 & 2032
- Figure 44: Europe Dried Apricot Market Volume (K Units), by Form 2024 & 2032
- Figure 45: Europe Dried Apricot Market Revenue Share (%), by Form 2024 & 2032
- Figure 46: Europe Dried Apricot Market Volume Share (%), by Form 2024 & 2032
- Figure 47: Europe Dried Apricot Market Revenue (Million), by Distribution Channel 2024 & 2032
- Figure 48: Europe Dried Apricot Market Volume (K Units), by Distribution Channel 2024 & 2032
- Figure 49: Europe Dried Apricot Market Revenue Share (%), by Distribution Channel 2024 & 2032
- Figure 50: Europe Dried Apricot Market Volume Share (%), by Distribution Channel 2024 & 2032
- Figure 51: Europe Dried Apricot Market Revenue (Million), by Country 2024 & 2032
- Figure 52: Europe Dried Apricot Market Volume (K Units), by Country 2024 & 2032
- Figure 53: Europe Dried Apricot Market Revenue Share (%), by Country 2024 & 2032
- Figure 54: Europe Dried Apricot Market Volume Share (%), by Country 2024 & 2032
- Figure 55: Asia Pacific Dried Apricot Market Revenue (Million), by Type 2024 & 2032
- Figure 56: Asia Pacific Dried Apricot Market Volume (K Units), by Type 2024 & 2032
- Figure 57: Asia Pacific Dried Apricot Market Revenue Share (%), by Type 2024 & 2032
- Figure 58: Asia Pacific Dried Apricot Market Volume Share (%), by Type 2024 & 2032
- Figure 59: Asia Pacific Dried Apricot Market Revenue (Million), by Form 2024 & 2032
- Figure 60: Asia Pacific Dried Apricot Market Volume (K Units), by Form 2024 & 2032
- Figure 61: Asia Pacific Dried Apricot Market Revenue Share (%), by Form 2024 & 2032
- Figure 62: Asia Pacific Dried Apricot Market Volume Share (%), by Form 2024 & 2032
- Figure 63: Asia Pacific Dried Apricot Market Revenue (Million), by Distribution Channel 2024 & 2032
- Figure 64: Asia Pacific Dried Apricot Market Volume (K Units), by Distribution Channel 2024 & 2032
- Figure 65: Asia Pacific Dried Apricot Market Revenue Share (%), by Distribution Channel 2024 & 2032
- Figure 66: Asia Pacific Dried Apricot Market Volume Share (%), by Distribution Channel 2024 & 2032
- Figure 67: Asia Pacific Dried Apricot Market Revenue (Million), by Country 2024 & 2032
- Figure 68: Asia Pacific Dried Apricot Market Volume (K Units), by Country 2024 & 2032
- Figure 69: Asia Pacific Dried Apricot Market Revenue Share (%), by Country 2024 & 2032
- Figure 70: Asia Pacific Dried Apricot Market Volume Share (%), by Country 2024 & 2032
- Figure 71: South America Dried Apricot Market Revenue (Million), by Type 2024 & 2032
- Figure 72: South America Dried Apricot Market Volume (K Units), by Type 2024 & 2032
- Figure 73: South America Dried Apricot Market Revenue Share (%), by Type 2024 & 2032
- Figure 74: South America Dried Apricot Market Volume Share (%), by Type 2024 & 2032
- Figure 75: South America Dried Apricot Market Revenue (Million), by Form 2024 & 2032
- Figure 76: South America Dried Apricot Market Volume (K Units), by Form 2024 & 2032
- Figure 77: South America Dried Apricot Market Revenue Share (%), by Form 2024 & 2032
- Figure 78: South America Dried Apricot Market Volume Share (%), by Form 2024 & 2032
- Figure 79: South America Dried Apricot Market Revenue (Million), by Distribution Channel 2024 & 2032
- Figure 80: South America Dried Apricot Market Volume (K Units), by Distribution Channel 2024 & 2032
- Figure 81: South America Dried Apricot Market Revenue Share (%), by Distribution Channel 2024 & 2032
- Figure 82: South America Dried Apricot Market Volume Share (%), by Distribution Channel 2024 & 2032
- Figure 83: South America Dried Apricot Market Revenue (Million), by Country 2024 & 2032
- Figure 84: South America Dried Apricot Market Volume (K Units), by Country 2024 & 2032
- Figure 85: South America Dried Apricot Market Revenue Share (%), by Country 2024 & 2032
- Figure 86: South America Dried Apricot Market Volume Share (%), by Country 2024 & 2032
- Figure 87: Middle East and Africa Dried Apricot Market Revenue (Million), by Type 2024 & 2032
- Figure 88: Middle East and Africa Dried Apricot Market Volume (K Units), by Type 2024 & 2032
- Figure 89: Middle East and Africa Dried Apricot Market Revenue Share (%), by Type 2024 & 2032
- Figure 90: Middle East and Africa Dried Apricot Market Volume Share (%), by Type 2024 & 2032
- Figure 91: Middle East and Africa Dried Apricot Market Revenue (Million), by Form 2024 & 2032
- Figure 92: Middle East and Africa Dried Apricot Market Volume (K Units), by Form 2024 & 2032
- Figure 93: Middle East and Africa Dried Apricot Market Revenue Share (%), by Form 2024 & 2032
- Figure 94: Middle East and Africa Dried Apricot Market Volume Share (%), by Form 2024 & 2032
- Figure 95: Middle East and Africa Dried Apricot Market Revenue (Million), by Distribution Channel 2024 & 2032
- Figure 96: Middle East and Africa Dried Apricot Market Volume (K Units), by Distribution Channel 2024 & 2032
- Figure 97: Middle East and Africa Dried Apricot Market Revenue Share (%), by Distribution Channel 2024 & 2032
- Figure 98: Middle East and Africa Dried Apricot Market Volume Share (%), by Distribution Channel 2024 & 2032
- Figure 99: Middle East and Africa Dried Apricot Market Revenue (Million), by Country 2024 & 2032
- Figure 100: Middle East and Africa Dried Apricot Market Volume (K Units), by Country 2024 & 2032
- Figure 101: Middle East and Africa Dried Apricot Market Revenue Share (%), by Country 2024 & 2032
- Figure 102: Middle East and Africa Dried Apricot Market Volume Share (%), by Country 2024 & 2032
List of Tables
- Table 1: Global Dried Apricot Market Revenue Million Forecast, by Region 2019 & 2032
- Table 2: Global Dried Apricot Market Volume K Units Forecast, by Region 2019 & 2032
- Table 3: Global Dried Apricot Market Revenue Million Forecast, by Type 2019 & 2032
- Table 4: Global Dried Apricot Market Volume K Units Forecast, by Type 2019 & 2032
- Table 5: Global Dried Apricot Market Revenue Million Forecast, by Form 2019 & 2032
- Table 6: Global Dried Apricot Market Volume K Units Forecast, by Form 2019 & 2032
- Table 7: Global Dried Apricot Market Revenue Million Forecast, by Distribution Channel 2019 & 2032
- Table 8: Global Dried Apricot Market Volume K Units Forecast, by Distribution Channel 2019 & 2032
- Table 9: Global Dried Apricot Market Revenue Million Forecast, by Region 2019 & 2032
- Table 10: Global Dried Apricot Market Volume K Units Forecast, by Region 2019 & 2032
- Table 11: Global Dried Apricot Market Revenue Million Forecast, by Country 2019 & 2032
- Table 12: Global Dried Apricot Market Volume K Units Forecast, by Country 2019 & 2032
- Table 13: United States Dried Apricot Market Revenue (Million) Forecast, by Application 2019 & 2032
- Table 14: United States Dried Apricot Market Volume (K Units) Forecast, by Application 2019 & 2032
- Table 15: Canada Dried Apricot Market Revenue (Million) Forecast, by Application 2019 & 2032
- Table 16: Canada Dried Apricot Market Volume (K Units) Forecast, by Application 2019 & 2032
- Table 17: Mexico Dried Apricot Market Revenue (Million) Forecast, by Application 2019 & 2032
- Table 18: Mexico Dried Apricot Market Volume (K Units) Forecast, by Application 2019 & 2032
- Table 19: Rest of North America Dried Apricot Market Revenue (Million) Forecast, by Application 2019 & 2032
- Table 20: Rest of North America Dried Apricot Market Volume (K Units) Forecast, by Application 2019 & 2032
- Table 21: Global Dried Apricot Market Revenue Million Forecast, by Country 2019 & 2032
- Table 22: Global Dried Apricot Market Volume K Units Forecast, by Country 2019 & 2032
- Table 23: Germany Dried Apricot Market Revenue (Million) Forecast, by Application 2019 & 2032
- Table 24: Germany Dried Apricot Market Volume (K Units) Forecast, by Application 2019 & 2032
- Table 25: United Kingdom Dried Apricot Market Revenue (Million) Forecast, by Application 2019 & 2032
- Table 26: United Kingdom Dried Apricot Market Volume (K Units) Forecast, by Application 2019 & 2032
- Table 27: France Dried Apricot Market Revenue (Million) Forecast, by Application 2019 & 2032
- Table 28: France Dried Apricot Market Volume (K Units) Forecast, by Application 2019 & 2032
- Table 29: Spain Dried Apricot Market Revenue (Million) Forecast, by Application 2019 & 2032
- Table 30: Spain Dried Apricot Market Volume (K Units) Forecast, by Application 2019 & 2032
- Table 31: Russia Dried Apricot Market Revenue (Million) Forecast, by Application 2019 & 2032
- Table 32: Russia Dried Apricot Market Volume (K Units) Forecast, by Application 2019 & 2032
- Table 33: Italy Dried Apricot Market Revenue (Million) Forecast, by Application 2019 & 2032
- Table 34: Italy Dried Apricot Market Volume (K Units) Forecast, by Application 2019 & 2032
- Table 35: Rest of Europe Dried Apricot Market Revenue (Million) Forecast, by Application 2019 & 2032
- Table 36: Rest of Europe Dried Apricot Market Volume (K Units) Forecast, by Application 2019 & 2032
- Table 37: Global Dried Apricot Market Revenue Million Forecast, by Country 2019 & 2032
- Table 38: Global Dried Apricot Market Volume K Units Forecast, by Country 2019 & 2032
- Table 39: China Dried Apricot Market Revenue (Million) Forecast, by Application 2019 & 2032
- Table 40: China Dried Apricot Market Volume (K Units) Forecast, by Application 2019 & 2032
- Table 41: Japan Dried Apricot Market Revenue (Million) Forecast, by Application 2019 & 2032
- Table 42: Japan Dried Apricot Market Volume (K Units) Forecast, by Application 2019 & 2032
- Table 43: India Dried Apricot Market Revenue (Million) Forecast, by Application 2019 & 2032
- Table 44: India Dried Apricot Market Volume (K Units) Forecast, by Application 2019 & 2032
- Table 45: Australia Dried Apricot Market Revenue (Million) Forecast, by Application 2019 & 2032
- Table 46: Australia Dried Apricot Market Volume (K Units) Forecast, by Application 2019 & 2032
- Table 47: Rest of Asia Pacific Dried Apricot Market Revenue (Million) Forecast, by Application 2019 & 2032
- Table 48: Rest of Asia Pacific Dried Apricot Market Volume (K Units) Forecast, by Application 2019 & 2032
- Table 49: Global Dried Apricot Market Revenue Million Forecast, by Country 2019 & 2032
- Table 50: Global Dried Apricot Market Volume K Units Forecast, by Country 2019 & 2032
- Table 51: Brazil Dried Apricot Market Revenue (Million) Forecast, by Application 2019 & 2032
- Table 52: Brazil Dried Apricot Market Volume (K Units) Forecast, by Application 2019 & 2032
- Table 53: Argentina Dried Apricot Market Revenue (Million) Forecast, by Application 2019 & 2032
- Table 54: Argentina Dried Apricot Market Volume (K Units) Forecast, by Application 2019 & 2032
- Table 55: Rest of South America Dried Apricot Market Revenue (Million) Forecast, by Application 2019 & 2032
- Table 56: Rest of South America Dried Apricot Market Volume (K Units) Forecast, by Application 2019 & 2032
- Table 57: Global Dried Apricot Market Revenue Million Forecast, by Country 2019 & 2032
- Table 58: Global Dried Apricot Market Volume K Units Forecast, by Country 2019 & 2032
- Table 59: Turkey Dried Apricot Market Revenue (Million) Forecast, by Application 2019 & 2032
- Table 60: Turkey Dried Apricot Market Volume (K Units) Forecast, by Application 2019 & 2032
- Table 61: Saudi Arabia Dried Apricot Market Revenue (Million) Forecast, by Application 2019 & 2032
- Table 62: Saudi Arabia Dried Apricot Market Volume (K Units) Forecast, by Application 2019 & 2032
- Table 63: South Africa Dried Apricot Market Revenue (Million) Forecast, by Application 2019 & 2032
- Table 64: South Africa Dried Apricot Market Volume (K Units) Forecast, by Application 2019 & 2032
- Table 65: Rest of Middle East and Africa Dried Apricot Market Revenue (Million) Forecast, by Application 2019 & 2032
- Table 66: Rest of Middle East and Africa Dried Apricot Market Volume (K Units) Forecast, by Application 2019 & 2032
- Table 67: Global Dried Apricot Market Revenue Million Forecast, by Type 2019 & 2032
- Table 68: Global Dried Apricot Market Volume K Units Forecast, by Type 2019 & 2032
- Table 69: Global Dried Apricot Market Revenue Million Forecast, by Form 2019 & 2032
- Table 70: Global Dried Apricot Market Volume K Units Forecast, by Form 2019 & 2032
- Table 71: Global Dried Apricot Market Revenue Million Forecast, by Distribution Channel 2019 & 2032
- Table 72: Global Dried Apricot Market Volume K Units Forecast, by Distribution Channel 2019 & 2032
- Table 73: Global Dried Apricot Market Revenue Million Forecast, by Country 2019 & 2032
- Table 74: Global Dried Apricot Market Volume K Units Forecast, by Country 2019 & 2032
- Table 75: United States Dried Apricot Market Revenue (Million) Forecast, by Application 2019 & 2032
- Table 76: United States Dried Apricot Market Volume (K Units) Forecast, by Application 2019 & 2032
- Table 77: Canada Dried Apricot Market Revenue (Million) Forecast, by Application 2019 & 2032
- Table 78: Canada Dried Apricot Market Volume (K Units) Forecast, by Application 2019 & 2032
- Table 79: Mexico Dried Apricot Market Revenue (Million) Forecast, by Application 2019 & 2032
- Table 80: Mexico Dried Apricot Market Volume (K Units) Forecast, by Application 2019 & 2032
- Table 81: Rest of North America Dried Apricot Market Revenue (Million) Forecast, by Application 2019 & 2032
- Table 82: Rest of North America Dried Apricot Market Volume (K Units) Forecast, by Application 2019 & 2032
- Table 83: Global Dried Apricot Market Revenue Million Forecast, by Type 2019 & 2032
- Table 84: Global Dried Apricot Market Volume K Units Forecast, by Type 2019 & 2032
- Table 85: Global Dried Apricot Market Revenue Million Forecast, by Form 2019 & 2032
- Table 86: Global Dried Apricot Market Volume K Units Forecast, by Form 2019 & 2032
- Table 87: Global Dried Apricot Market Revenue Million Forecast, by Distribution Channel 2019 & 2032
- Table 88: Global Dried Apricot Market Volume K Units Forecast, by Distribution Channel 2019 & 2032
- Table 89: Global Dried Apricot Market Revenue Million Forecast, by Country 2019 & 2032
- Table 90: Global Dried Apricot Market Volume K Units Forecast, by Country 2019 & 2032
- Table 91: Germany Dried Apricot Market Revenue (Million) Forecast, by Application 2019 & 2032
- Table 92: Germany Dried Apricot Market Volume (K Units) Forecast, by Application 2019 & 2032
- Table 93: United Kingdom Dried Apricot Market Revenue (Million) Forecast, by Application 2019 & 2032
- Table 94: United Kingdom Dried Apricot Market Volume (K Units) Forecast, by Application 2019 & 2032
- Table 95: France Dried Apricot Market Revenue (Million) Forecast, by Application 2019 & 2032
- Table 96: France Dried Apricot Market Volume (K Units) Forecast, by Application 2019 & 2032
- Table 97: Spain Dried Apricot Market Revenue (Million) Forecast, by Application 2019 & 2032
- Table 98: Spain Dried Apricot Market Volume (K Units) Forecast, by Application 2019 & 2032
- Table 99: Russia Dried Apricot Market Revenue (Million) Forecast, by Application 2019 & 2032
- Table 100: Russia Dried Apricot Market Volume (K Units) Forecast, by Application 2019 & 2032
- Table 101: Italy Dried Apricot Market Revenue (Million) Forecast, by Application 2019 & 2032
- Table 102: Italy Dried Apricot Market Volume (K Units) Forecast, by Application 2019 & 2032
- Table 103: Rest of Europe Dried Apricot Market Revenue (Million) Forecast, by Application 2019 & 2032
- Table 104: Rest of Europe Dried Apricot Market Volume (K Units) Forecast, by Application 2019 & 2032
- Table 105: Global Dried Apricot Market Revenue Million Forecast, by Type 2019 & 2032
- Table 106: Global Dried Apricot Market Volume K Units Forecast, by Type 2019 & 2032
- Table 107: Global Dried Apricot Market Revenue Million Forecast, by Form 2019 & 2032
- Table 108: Global Dried Apricot Market Volume K Units Forecast, by Form 2019 & 2032
- Table 109: Global Dried Apricot Market Revenue Million Forecast, by Distribution Channel 2019 & 2032
- Table 110: Global Dried Apricot Market Volume K Units Forecast, by Distribution Channel 2019 & 2032
- Table 111: Global Dried Apricot Market Revenue Million Forecast, by Country 2019 & 2032
- Table 112: Global Dried Apricot Market Volume K Units Forecast, by Country 2019 & 2032
- Table 113: China Dried Apricot Market Revenue (Million) Forecast, by Application 2019 & 2032
- Table 114: China Dried Apricot Market Volume (K Units) Forecast, by Application 2019 & 2032
- Table 115: Japan Dried Apricot Market Revenue (Million) Forecast, by Application 2019 & 2032
- Table 116: Japan Dried Apricot Market Volume (K Units) Forecast, by Application 2019 & 2032
- Table 117: India Dried Apricot Market Revenue (Million) Forecast, by Application 2019 & 2032
- Table 118: India Dried Apricot Market Volume (K Units) Forecast, by Application 2019 & 2032
- Table 119: Australia Dried Apricot Market Revenue (Million) Forecast, by Application 2019 & 2032
- Table 120: Australia Dried Apricot Market Volume (K Units) Forecast, by Application 2019 & 2032
- Table 121: Rest of Asia Pacific Dried Apricot Market Revenue (Million) Forecast, by Application 2019 & 2032
- Table 122: Rest of Asia Pacific Dried Apricot Market Volume (K Units) Forecast, by Application 2019 & 2032
- Table 123: Global Dried Apricot Market Revenue Million Forecast, by Type 2019 & 2032
- Table 124: Global Dried Apricot Market Volume K Units Forecast, by Type 2019 & 2032
- Table 125: Global Dried Apricot Market Revenue Million Forecast, by Form 2019 & 2032
- Table 126: Global Dried Apricot Market Volume K Units Forecast, by Form 2019 & 2032
- Table 127: Global Dried Apricot Market Revenue Million Forecast, by Distribution Channel 2019 & 2032
- Table 128: Global Dried Apricot Market Volume K Units Forecast, by Distribution Channel 2019 & 2032
- Table 129: Global Dried Apricot Market Revenue Million Forecast, by Country 2019 & 2032
- Table 130: Global Dried Apricot Market Volume K Units Forecast, by Country 2019 & 2032
- Table 131: Brazil Dried Apricot Market Revenue (Million) Forecast, by Application 2019 & 2032
- Table 132: Brazil Dried Apricot Market Volume (K Units) Forecast, by Application 2019 & 2032
- Table 133: Argentina Dried Apricot Market Revenue (Million) Forecast, by Application 2019 & 2032
- Table 134: Argentina Dried Apricot Market Volume (K Units) Forecast, by Application 2019 & 2032
- Table 135: Rest of South America Dried Apricot Market Revenue (Million) Forecast, by Application 2019 & 2032
- Table 136: Rest of South America Dried Apricot Market Volume (K Units) Forecast, by Application 2019 & 2032
- Table 137: Global Dried Apricot Market Revenue Million Forecast, by Type 2019 & 2032
- Table 138: Global Dried Apricot Market Volume K Units Forecast, by Type 2019 & 2032
- Table 139: Global Dried Apricot Market Revenue Million Forecast, by Form 2019 & 2032
- Table 140: Global Dried Apricot Market Volume K Units Forecast, by Form 2019 & 2032
- Table 141: Global Dried Apricot Market Revenue Million Forecast, by Distribution Channel 2019 & 2032
- Table 142: Global Dried Apricot Market Volume K Units Forecast, by Distribution Channel 2019 & 2032
- Table 143: Global Dried Apricot Market Revenue Million Forecast, by Country 2019 & 2032
- Table 144: Global Dried Apricot Market Volume K Units Forecast, by Country 2019 & 2032
- Table 145: Turkey Dried Apricot Market Revenue (Million) Forecast, by Application 2019 & 2032
- Table 146: Turkey Dried Apricot Market Volume (K Units) Forecast, by Application 2019 & 2032
- Table 147: Saudi Arabia Dried Apricot Market Revenue (Million) Forecast, by Application 2019 & 2032
- Table 148: Saudi Arabia Dried Apricot Market Volume (K Units) Forecast, by Application 2019 & 2032
- Table 149: South Africa Dried Apricot Market Revenue (Million) Forecast, by Application 2019 & 2032
- Table 150: South Africa Dried Apricot Market Volume (K Units) Forecast, by Application 2019 & 2032
- Table 151: Rest of Middle East and Africa Dried Apricot Market Revenue (Million) Forecast, by Application 2019 & 2032
- Table 152: Rest of Middle East and Africa Dried Apricot Market Volume (K Units) Forecast, by Application 2019 & 2032
Frequently Asked Questions
1. What is the projected Compound Annual Growth Rate (CAGR) of the Dried Apricot Market?
The projected CAGR is approximately 3.80%.
2. Which companies are prominent players in the Dried Apricot Market?
Key companies in the market include Polychroniadis and Sia O E *List Not Exhaustive, Traina Foods Inc, ApricotKing, Fruits of Turkey, Sun-Maid Growers of California, Bergin Fruit and Nut Company, Purcell Mountain Farms.
3. What are the main segments of the Dried Apricot Market?
The market segments include Type, Form, Distribution Channel.
4. Can you provide details about the market size?
The market size is estimated to be USD XX Million as of 2022.
5. What are some drivers contributing to market growth?
Increasing application of Gelatin in healthcare and pharmaceutical sector.
6. What are the notable trends driving market growth?
Increasing Demand for Organic Dried Apricots.
7. Are there any restraints impacting market growth?
Rising demand for clean label products.
8. Can you provide examples of recent developments in the market?
N/A
9. What pricing options are available for accessing the report?
Pricing options include single-user, multi-user, and enterprise licenses priced at USD 4750, USD 5250, and USD 8750 respectively.
10. Is the market size provided in terms of value or volume?
The market size is provided in terms of value, measured in Million and volume, measured in K Units.
11. Are there any specific market keywords associated with the report?
Yes, the market keyword associated with the report is "Dried Apricot Market," which aids in identifying and referencing the specific market segment covered.
12. How do I determine which pricing option suits my needs best?
The pricing options vary based on user requirements and access needs. Individual users may opt for single-user licenses, while businesses requiring broader access may choose multi-user or enterprise licenses for cost-effective access to the report.
13. Are there any additional resources or data provided in the Dried Apricot Market report?
While the report offers comprehensive insights, it's advisable to review the specific contents or supplementary materials provided to ascertain if additional resources or data are available.
14. How can I stay updated on further developments or reports in the Dried Apricot Market?
To stay informed about further developments, trends, and reports in the Dried Apricot Market, consider subscribing to industry newsletters, following relevant companies and organizations, or regularly checking reputable industry news sources and publications.
Methodology
Step 1 - Identification of Relevant Samples Size from Population Database


Step 2 - Approaches for Defining Global Market Size (Value, Volume* & Price*)

Note*: In applicable scenarios
Step 3 - Data Sources
Primary Research
- Web Analytics
- Survey Reports
- Research Institute
- Latest Research Reports
- Opinion Leaders
Secondary Research
- Annual Reports
- White Paper
- Latest Press Release
- Industry Association
- Paid Database
- Investor Presentations

Step 4 - Data Triangulation
Involves using different sources of information in order to increase the validity of a study
These sources are likely to be stakeholders in a program - participants, other researchers, program staff, other community members, and so on.
Then we put all data in single framework & apply various statistical tools to find out the dynamic on the market.
During the analysis stage, feedback from the stakeholder groups would be compared to determine areas of agreement as well as areas of divergence


