
Key Insights
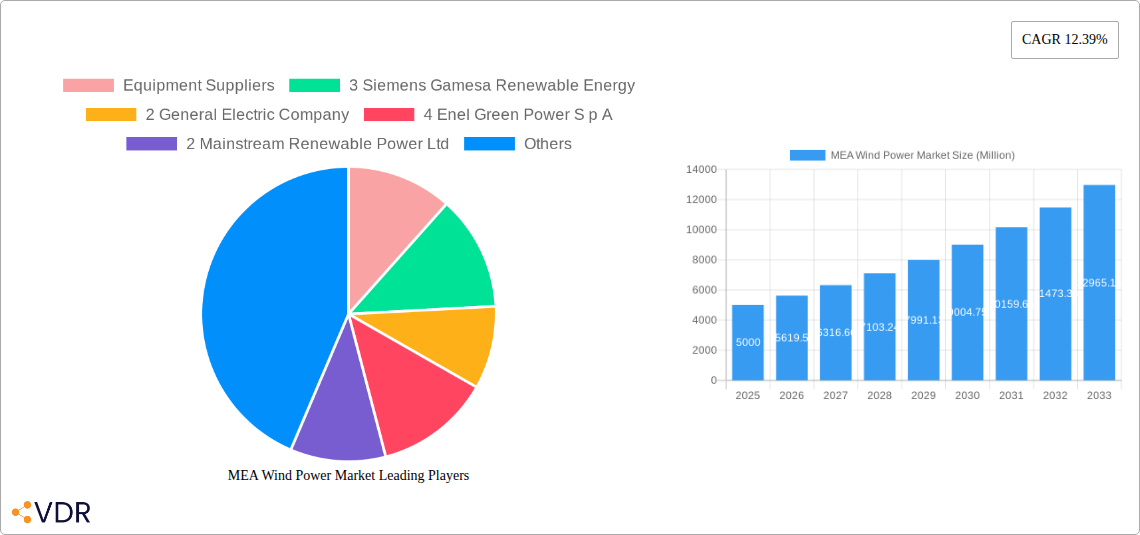
The MEA wind power market is experiencing robust growth, driven by the region's increasing energy demands, supportive government policies promoting renewable energy adoption, and the declining cost of wind turbine technology. The substantial untapped wind energy potential across countries like Saudi Arabia, the UAE, and South Africa, coupled with ambitious national renewable energy targets, is fueling significant investments in both onshore and offshore wind projects. A CAGR of 12.39% from 2019 to 2024 indicates a consistently expanding market, likely exceeding estimations based on historical data alone. Major players like Siemens Gamesa, General Electric, and Vestas are actively participating, contributing to the supply side of the market. The growing interest from both equipment suppliers and wind farm operators signals a healthy market ecosystem, likely to attract further international investment.
The segmentation of the market into onshore and offshore projects reflects the diverse geographical landscapes and resource availability within the MEA region. While onshore wind remains the dominant segment currently, the potential for offshore wind projects is rapidly gaining traction, particularly in coastal areas with high wind speeds. The competitive landscape involves a mix of global and regional players, suggesting a dynamic market with opportunities for both established and emerging companies. This rapid growth is anticipated to continue in the forecast period (2025-2033), driven by ongoing policy support, technological advancements, and an increased focus on energy security and sustainability within the region. The focus on renewable energy within the MEA region to diversify energy sources will likely drive continued development and growth for the foreseeable future.
MEA Wind Power Market: A Comprehensive Report (2019-2033)
This comprehensive report provides an in-depth analysis of the Middle East & Africa (MEA) wind power market, encompassing market dynamics, growth trends, key players, and future outlook. The study covers the period from 2019 to 2033, with a focus on the 2025-2033 forecast period. This report is essential for industry professionals, investors, and policymakers seeking a thorough understanding of this rapidly evolving sector. The report analyzes both parent market (Renewable Energy) and child market (Wind Power), offering a granular view of the MEA landscape. Market size is presented in Million units.
MEA Wind Power Market Market Dynamics & Structure
The MEA wind power market is characterized by a dynamic interplay of factors influencing its structure and growth trajectory. Market concentration is moderate, with a few dominant players alongside several regional operators. Technological innovation, particularly in turbine design and energy storage solutions, is a key driver. However, innovation is hampered by high upfront capital costs and limited access to advanced technologies in some regions. Regulatory frameworks vary across the MEA, with some countries offering supportive policies and incentives, while others lag behind. Hydropower and solar power present significant competitive substitutes, particularly in areas with abundant solar resources. The end-user demographics are diverse, encompassing utilities, independent power producers (IPPs), and industrial consumers. Mergers and acquisitions (M&A) activity has been significant, with larger players consolidating their market share and expanding their geographic reach. Over the historical period (2019-2024), approximately xx M&A deals were recorded in the MEA wind power sector, resulting in a xx% increase in market consolidation.
- Market Concentration: Moderate, with xx% market share held by the top 5 players.
- Technological Innovation: Driven by advancements in turbine efficiency and smart grid integration. Barriers include high R&D costs and skill gaps.
- Regulatory Framework: Varied across MEA countries; supportive policies accelerate growth in certain regions.
- Competitive Substitutes: Hydropower and solar PV are major competitors.
- End-User Demographics: Utilities, IPPs, and industrial consumers.
- M&A Activity: Significant consolidation observed in recent years (2019-2024), xx deals recorded, resulting in xx% increased market concentration.
MEA Wind Power Market Growth Trends & Insights
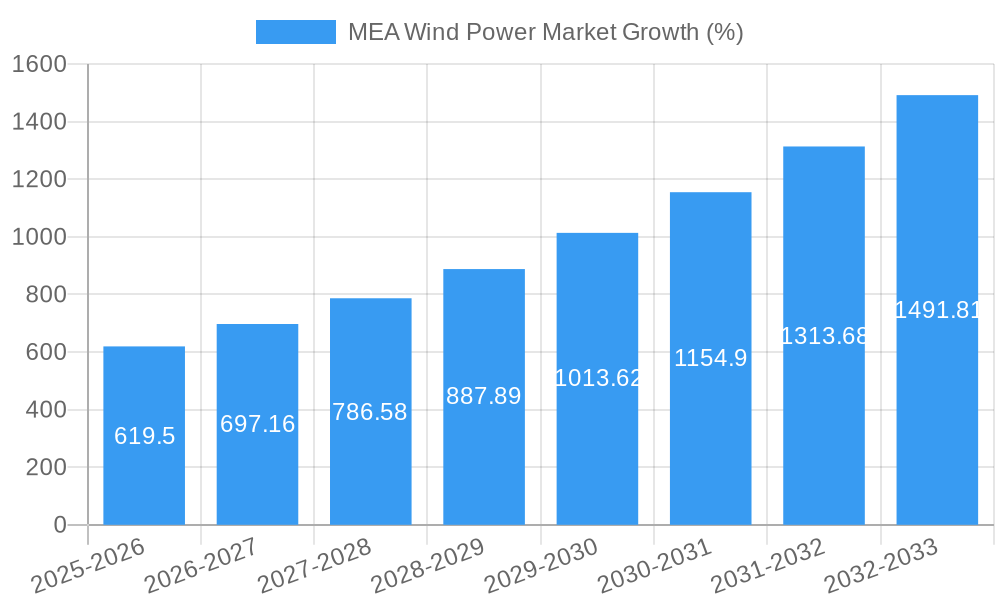
The MEA wind power market has experienced significant growth over the past few years, driven by factors such as increasing energy demand, government support for renewable energy, and decreasing technology costs. The market size increased from xx Million units in 2019 to xx Million units in 2024, exhibiting a Compound Annual Growth Rate (CAGR) of xx%. Market penetration is projected to reach xx% by 2033. Technological disruptions, such as the adoption of larger and more efficient turbines, have played a significant role in boosting capacity additions. Shifting consumer preferences towards sustainable energy sources further strengthens market growth. Significant investment in offshore wind projects is anticipated in the coming years, leading to a substantial market expansion.
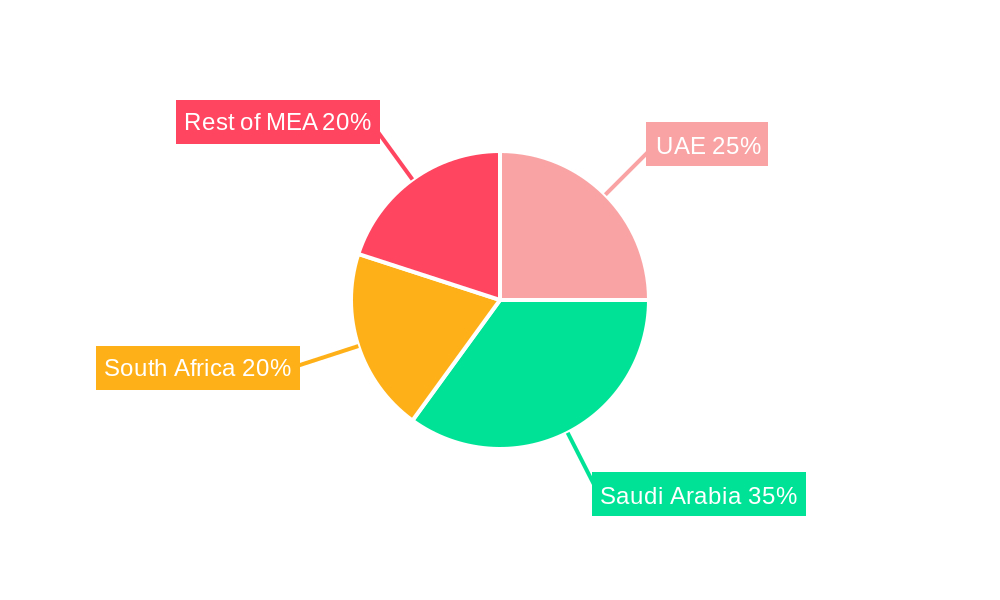
Dominant Regions, Countries, or Segments in MEA Wind Power Market
The onshore segment currently dominates the MEA wind power market due to lower installation costs and established infrastructure compared to offshore projects. However, the offshore wind sector is expected to witness significant growth during the forecast period. Several countries, including South Africa, Egypt, and Morocco, are spearheading the growth of wind energy capacity due to favorable government policies, and abundant wind resources.
- Key Drivers for Onshore Wind:
- Favorable government policies and incentives.
- Relatively lower installation costs compared to offshore.
- Abundant wind resources in certain regions.
- Key Drivers for Offshore Wind:
- Potential for higher capacity factors.
- Increasing technological advancements making offshore wind more viable.
- Government investments and project development in coastal areas.
Specific countries within the MEA will be detailed in the full report, analyzing their market share and growth potential.
MEA Wind Power Market Product Landscape
The MEA wind power market is characterized by a range of turbine technologies, including onshore and offshore wind turbines of varying capacities. Advancements in blade design, turbine control systems, and digital technologies are enhancing efficiency and reducing operational costs. The focus is shifting towards larger capacity turbines, improving energy yield and reducing levelized cost of energy (LCOE). Furthermore, innovative solutions such as hybrid wind-solar projects are gaining traction, providing a more reliable and efficient energy supply.
Key Drivers, Barriers & Challenges in MEA Wind Power Market
Key Drivers:
- Increasing energy demand and commitment to renewable energy targets by various governments.
- Decreasing technology costs, making wind power a more competitive energy source.
- Favorable government policies and financial incentives to support renewable energy adoption.
- Abundant wind resources in several regions.
Key Challenges:
- High initial capital investment required for large-scale wind farm projects.
- Grid infrastructure limitations in some regions, hindering the integration of wind power.
- Intermittency of wind power, necessitating energy storage solutions or grid balancing measures.
- Potential environmental impacts on birds and other wildlife, requiring mitigation strategies.
- xx% increase in raw material costs in 2024 compared to 2019 affected profitability and project timelines.
Emerging Opportunities in MEA Wind Power Market
- Untapped wind resources in many regions of MEA offer significant growth potential.
- Integration of wind energy with other renewable energy sources (hybrid systems) for improved energy security and cost-effectiveness.
- Development of innovative financing models to attract investments in wind power projects.
- Growing demand for wind power from industrial consumers and businesses looking to reduce carbon emissions.
- Expansion into offshore wind energy, with projects along the coastal regions providing a major avenue for growth.
Growth Accelerators in the MEA Wind Power Market Industry
Technological breakthroughs in turbine design, improved energy storage solutions, and advancements in smart grid technologies are key accelerators for long-term growth. Strategic partnerships between international companies and local developers will facilitate knowledge transfer and capacity building. Market expansion strategies, focusing on underserved regions and exploring new applications, like powering remote communities, will also be crucial.
Key Players Shaping the MEA Wind Power Market Market
Equipment Suppliers:
- Siemens Gamesa Renewable Energy
- General Electric Company
- Enel Green Power S p A
- Mainstream Renewable Power Ltd
- Envision Energy
- Vestas Wind Systems AS
Wind Farm Operators:
- Sulzon Energy Limited
- EDF SA
- Xinjiang Goldwind Science & Technology Co Ltd (Goldwind)
- Acciona Energia SA
Notable Milestones in MEA Wind Power Market Sector
- 2020: Successful commissioning of the xx MW wind farm in [Country Name], showcasing large-scale project implementation.
- 2022: Announced partnerships between international and local companies to develop significant wind capacity in the region.
- 2023: Implementation of new regulatory frameworks and incentives in several countries to accelerate wind energy growth. (Specific examples will be included in the full report).
In-Depth MEA Wind Power Market Market Outlook
The MEA wind power market is poised for robust growth in the coming years, driven by strong government support, increasing energy demand, and declining technology costs. Strategic opportunities lie in expanding into untapped regions, developing innovative financing models, and leveraging technological advancements to enhance efficiency and reduce costs. The offshore wind segment is anticipated to contribute significantly to the overall market growth. The potential for creating green jobs and boosting economic development through wind power investments is substantial, making the MEA region a key focus for global investors and developers.
MEA Wind Power Market Segmentation
-
1. Location
- 1.1. Onshore
- 1.2. Offshore
-
2. Geography
- 2.1. South Africa
- 2.2. Egypt
- 2.3. Morocco
- 2.4. Kenya
- 2.5. Rest of Middle-East and Africa
MEA Wind Power Market Segmentation By Geography
- 1. South Africa
- 2. Egypt
- 3. Morocco
- 4. Kenya
- 5. Rest of Middle East and Africa
MEA Wind Power Market REPORT HIGHLIGHTS
| Aspects | Details |
|---|---|
| Study Period | 2019-2033 |
| Base Year | 2024 |
| Estimated Year | 2025 |
| Forecast Period | 2025-2033 |
| Historical Period | 2019-2024 |
| Growth Rate | CAGR of 12.39% from 2019-2033 |
| Segmentation |
|
Table of Contents
- 1. Introduction
- 1.1. Research Scope
- 1.2. Market Segmentation
- 1.3. Research Methodology
- 1.4. Definitions and Assumptions
- 2. Executive Summary
- 2.1. Introduction
- 3. Market Dynamics
- 3.1. Introduction
- 3.2. Market Drivers
- 3.2.1. 4.; Increasing Investments in Offshore Wind Power Projects4.; Supportive Government Policies
- 3.3. Market Restrains
- 3.3.1. 4.; Increasing Adopting of Alternative Clean Energy Sources (Ex
- 3.4. Market Trends
- 3.4.1. Onshore Segment to Dominate the Market
- 4. Market Factor Analysis
- 4.1. Porters Five Forces
- 4.2. Supply/Value Chain
- 4.3. PESTEL analysis
- 4.4. Market Entropy
- 4.5. Patent/Trademark Analysis
- 5. MEA Wind Power Market Analysis, Insights and Forecast, 2019-2031
- 5.1. Market Analysis, Insights and Forecast - by Location
- 5.1.1. Onshore
- 5.1.2. Offshore
- 5.2. Market Analysis, Insights and Forecast - by Geography
- 5.2.1. South Africa
- 5.2.2. Egypt
- 5.2.3. Morocco
- 5.2.4. Kenya
- 5.2.5. Rest of Middle-East and Africa
- 5.3. Market Analysis, Insights and Forecast - by Region
- 5.3.1. South Africa
- 5.3.2. Egypt
- 5.3.3. Morocco
- 5.3.4. Kenya
- 5.3.5. Rest of Middle East and Africa
- 5.1. Market Analysis, Insights and Forecast - by Location
- 6. South Africa MEA Wind Power Market Analysis, Insights and Forecast, 2019-2031
- 6.1. Market Analysis, Insights and Forecast - by Location
- 6.1.1. Onshore
- 6.1.2. Offshore
- 6.2. Market Analysis, Insights and Forecast - by Geography
- 6.2.1. South Africa
- 6.2.2. Egypt
- 6.2.3. Morocco
- 6.2.4. Kenya
- 6.2.5. Rest of Middle-East and Africa
- 6.1. Market Analysis, Insights and Forecast - by Location
- 7. Egypt MEA Wind Power Market Analysis, Insights and Forecast, 2019-2031
- 7.1. Market Analysis, Insights and Forecast - by Location
- 7.1.1. Onshore
- 7.1.2. Offshore
- 7.2. Market Analysis, Insights and Forecast - by Geography
- 7.2.1. South Africa
- 7.2.2. Egypt
- 7.2.3. Morocco
- 7.2.4. Kenya
- 7.2.5. Rest of Middle-East and Africa
- 7.1. Market Analysis, Insights and Forecast - by Location
- 8. Morocco MEA Wind Power Market Analysis, Insights and Forecast, 2019-2031
- 8.1. Market Analysis, Insights and Forecast - by Location
- 8.1.1. Onshore
- 8.1.2. Offshore
- 8.2. Market Analysis, Insights and Forecast - by Geography
- 8.2.1. South Africa
- 8.2.2. Egypt
- 8.2.3. Morocco
- 8.2.4. Kenya
- 8.2.5. Rest of Middle-East and Africa
- 8.1. Market Analysis, Insights and Forecast - by Location
- 9. Kenya MEA Wind Power Market Analysis, Insights and Forecast, 2019-2031
- 9.1. Market Analysis, Insights and Forecast - by Location
- 9.1.1. Onshore
- 9.1.2. Offshore
- 9.2. Market Analysis, Insights and Forecast - by Geography
- 9.2.1. South Africa
- 9.2.2. Egypt
- 9.2.3. Morocco
- 9.2.4. Kenya
- 9.2.5. Rest of Middle-East and Africa
- 9.1. Market Analysis, Insights and Forecast - by Location
- 10. Rest of Middle East and Africa MEA Wind Power Market Analysis, Insights and Forecast, 2019-2031
- 10.1. Market Analysis, Insights and Forecast - by Location
- 10.1.1. Onshore
- 10.1.2. Offshore
- 10.2. Market Analysis, Insights and Forecast - by Geography
- 10.2.1. South Africa
- 10.2.2. Egypt
- 10.2.3. Morocco
- 10.2.4. Kenya
- 10.2.5. Rest of Middle-East and Africa
- 10.1. Market Analysis, Insights and Forecast - by Location
- 11. United Arab Emirates MEA Wind Power Market Analysis, Insights and Forecast, 2019-2031
- 12. Saudi Arabia MEA Wind Power Market Analysis, Insights and Forecast, 2019-2031
- 13. South Africa MEA Wind Power Market Analysis, Insights and Forecast, 2019-2031
- 14. Rest of Middle East and Africa MEA Wind Power Market Analysis, Insights and Forecast, 2019-2031
- 15. Competitive Analysis
- 15.1. Market Share Analysis 2024
- 15.2. Company Profiles
- 15.2.1 Equipment Suppliers
- 15.2.1.1. Overview
- 15.2.1.2. Products
- 15.2.1.3. SWOT Analysis
- 15.2.1.4. Recent Developments
- 15.2.1.5. Financials (Based on Availability)
- 15.2.2 3 Siemens Gamesa Renewable Energy
- 15.2.2.1. Overview
- 15.2.2.2. Products
- 15.2.2.3. SWOT Analysis
- 15.2.2.4. Recent Developments
- 15.2.2.5. Financials (Based on Availability)
- 15.2.3 2 General Electric Company
- 15.2.3.1. Overview
- 15.2.3.2. Products
- 15.2.3.3. SWOT Analysis
- 15.2.3.4. Recent Developments
- 15.2.3.5. Financials (Based on Availability)
- 15.2.4 4 Enel Green Power S p A
- 15.2.4.1. Overview
- 15.2.4.2. Products
- 15.2.4.3. SWOT Analysis
- 15.2.4.4. Recent Developments
- 15.2.4.5. Financials (Based on Availability)
- 15.2.5 2 Mainstream Renewable Power Ltd
- 15.2.5.1. Overview
- 15.2.5.2. Products
- 15.2.5.3. SWOT Analysis
- 15.2.5.4. Recent Developments
- 15.2.5.5. Financials (Based on Availability)
- 15.2.6 1 Envision Energy
- 15.2.6.1. Overview
- 15.2.6.2. Products
- 15.2.6.3. SWOT Analysis
- 15.2.6.4. Recent Developments
- 15.2.6.5. Financials (Based on Availability)
- 15.2.7 6 Vestas Wind Systems AS
- 15.2.7.1. Overview
- 15.2.7.2. Products
- 15.2.7.3. SWOT Analysis
- 15.2.7.4. Recent Developments
- 15.2.7.5. Financials (Based on Availability)
- 15.2.8 Wind Farm Operators
- 15.2.8.1. Overview
- 15.2.8.2. Products
- 15.2.8.3. SWOT Analysis
- 15.2.8.4. Recent Developments
- 15.2.8.5. Financials (Based on Availability)
- 15.2.9 4 Sulzon Energy Limited
- 15.2.9.1. Overview
- 15.2.9.2. Products
- 15.2.9.3. SWOT Analysis
- 15.2.9.4. Recent Developments
- 15.2.9.5. Financials (Based on Availability)
- 15.2.10 3 EDF SA
- 15.2.10.1. Overview
- 15.2.10.2. Products
- 15.2.10.3. SWOT Analysis
- 15.2.10.4. Recent Developments
- 15.2.10.5. Financials (Based on Availability)
- 15.2.11 5 Xinjiang Goldwind Science & Technology Co Ltd (Goldwind)
- 15.2.11.1. Overview
- 15.2.11.2. Products
- 15.2.11.3. SWOT Analysis
- 15.2.11.4. Recent Developments
- 15.2.11.5. Financials (Based on Availability)
- 15.2.12 1 Acciona Energia SA
- 15.2.12.1. Overview
- 15.2.12.2. Products
- 15.2.12.3. SWOT Analysis
- 15.2.12.4. Recent Developments
- 15.2.12.5. Financials (Based on Availability)
- 15.2.1 Equipment Suppliers
List of Figures
- Figure 1: MEA Wind Power Market Revenue Breakdown (Million, %) by Product 2024 & 2032
- Figure 2: MEA Wind Power Market Share (%) by Company 2024
List of Tables
- Table 1: MEA Wind Power Market Revenue Million Forecast, by Region 2019 & 2032
- Table 2: MEA Wind Power Market Volume Thousand Forecast, by Region 2019 & 2032
- Table 3: MEA Wind Power Market Revenue Million Forecast, by Location 2019 & 2032
- Table 4: MEA Wind Power Market Volume Thousand Forecast, by Location 2019 & 2032
- Table 5: MEA Wind Power Market Revenue Million Forecast, by Geography 2019 & 2032
- Table 6: MEA Wind Power Market Volume Thousand Forecast, by Geography 2019 & 2032
- Table 7: MEA Wind Power Market Revenue Million Forecast, by Region 2019 & 2032
- Table 8: MEA Wind Power Market Volume Thousand Forecast, by Region 2019 & 2032
- Table 9: MEA Wind Power Market Revenue Million Forecast, by Country 2019 & 2032
- Table 10: MEA Wind Power Market Volume Thousand Forecast, by Country 2019 & 2032
- Table 11: United Arab Emirates MEA Wind Power Market Revenue (Million) Forecast, by Application 2019 & 2032
- Table 12: United Arab Emirates MEA Wind Power Market Volume (Thousand) Forecast, by Application 2019 & 2032
- Table 13: Saudi Arabia MEA Wind Power Market Revenue (Million) Forecast, by Application 2019 & 2032
- Table 14: Saudi Arabia MEA Wind Power Market Volume (Thousand) Forecast, by Application 2019 & 2032
- Table 15: South Africa MEA Wind Power Market Revenue (Million) Forecast, by Application 2019 & 2032
- Table 16: South Africa MEA Wind Power Market Volume (Thousand) Forecast, by Application 2019 & 2032
- Table 17: Rest of Middle East and Africa MEA Wind Power Market Revenue (Million) Forecast, by Application 2019 & 2032
- Table 18: Rest of Middle East and Africa MEA Wind Power Market Volume (Thousand) Forecast, by Application 2019 & 2032
- Table 19: MEA Wind Power Market Revenue Million Forecast, by Location 2019 & 2032
- Table 20: MEA Wind Power Market Volume Thousand Forecast, by Location 2019 & 2032
- Table 21: MEA Wind Power Market Revenue Million Forecast, by Geography 2019 & 2032
- Table 22: MEA Wind Power Market Volume Thousand Forecast, by Geography 2019 & 2032
- Table 23: MEA Wind Power Market Revenue Million Forecast, by Country 2019 & 2032
- Table 24: MEA Wind Power Market Volume Thousand Forecast, by Country 2019 & 2032
- Table 25: MEA Wind Power Market Revenue Million Forecast, by Location 2019 & 2032
- Table 26: MEA Wind Power Market Volume Thousand Forecast, by Location 2019 & 2032
- Table 27: MEA Wind Power Market Revenue Million Forecast, by Geography 2019 & 2032
- Table 28: MEA Wind Power Market Volume Thousand Forecast, by Geography 2019 & 2032
- Table 29: MEA Wind Power Market Revenue Million Forecast, by Country 2019 & 2032
- Table 30: MEA Wind Power Market Volume Thousand Forecast, by Country 2019 & 2032
- Table 31: MEA Wind Power Market Revenue Million Forecast, by Location 2019 & 2032
- Table 32: MEA Wind Power Market Volume Thousand Forecast, by Location 2019 & 2032
- Table 33: MEA Wind Power Market Revenue Million Forecast, by Geography 2019 & 2032
- Table 34: MEA Wind Power Market Volume Thousand Forecast, by Geography 2019 & 2032
- Table 35: MEA Wind Power Market Revenue Million Forecast, by Country 2019 & 2032
- Table 36: MEA Wind Power Market Volume Thousand Forecast, by Country 2019 & 2032
- Table 37: MEA Wind Power Market Revenue Million Forecast, by Location 2019 & 2032
- Table 38: MEA Wind Power Market Volume Thousand Forecast, by Location 2019 & 2032
- Table 39: MEA Wind Power Market Revenue Million Forecast, by Geography 2019 & 2032
- Table 40: MEA Wind Power Market Volume Thousand Forecast, by Geography 2019 & 2032
- Table 41: MEA Wind Power Market Revenue Million Forecast, by Country 2019 & 2032
- Table 42: MEA Wind Power Market Volume Thousand Forecast, by Country 2019 & 2032
- Table 43: MEA Wind Power Market Revenue Million Forecast, by Location 2019 & 2032
- Table 44: MEA Wind Power Market Volume Thousand Forecast, by Location 2019 & 2032
- Table 45: MEA Wind Power Market Revenue Million Forecast, by Geography 2019 & 2032
- Table 46: MEA Wind Power Market Volume Thousand Forecast, by Geography 2019 & 2032
- Table 47: MEA Wind Power Market Revenue Million Forecast, by Country 2019 & 2032
- Table 48: MEA Wind Power Market Volume Thousand Forecast, by Country 2019 & 2032
Frequently Asked Questions
1. What is the projected Compound Annual Growth Rate (CAGR) of the MEA Wind Power Market?
The projected CAGR is approximately 12.39%.
2. Which companies are prominent players in the MEA Wind Power Market?
Key companies in the market include Equipment Suppliers, 3 Siemens Gamesa Renewable Energy, 2 General Electric Company, 4 Enel Green Power S p A, 2 Mainstream Renewable Power Ltd, 1 Envision Energy, 6 Vestas Wind Systems AS, Wind Farm Operators, 4 Sulzon Energy Limited, 3 EDF SA, 5 Xinjiang Goldwind Science & Technology Co Ltd (Goldwind), 1 Acciona Energia SA.
3. What are the main segments of the MEA Wind Power Market?
The market segments include Location, Geography.
4. Can you provide details about the market size?
The market size is estimated to be USD XX Million as of 2022.
5. What are some drivers contributing to market growth?
4.; Increasing Investments in Offshore Wind Power Projects4.; Supportive Government Policies.
6. What are the notable trends driving market growth?
Onshore Segment to Dominate the Market.
7. Are there any restraints impacting market growth?
4.; Increasing Adopting of Alternative Clean Energy Sources (Ex: Solar. Hydro).
8. Can you provide examples of recent developments in the market?
N/A
9. What pricing options are available for accessing the report?
Pricing options include single-user, multi-user, and enterprise licenses priced at USD 4750, USD 5250, and USD 8750 respectively.
10. Is the market size provided in terms of value or volume?
The market size is provided in terms of value, measured in Million and volume, measured in Thousand.
11. Are there any specific market keywords associated with the report?
Yes, the market keyword associated with the report is "MEA Wind Power Market," which aids in identifying and referencing the specific market segment covered.
12. How do I determine which pricing option suits my needs best?
The pricing options vary based on user requirements and access needs. Individual users may opt for single-user licenses, while businesses requiring broader access may choose multi-user or enterprise licenses for cost-effective access to the report.
13. Are there any additional resources or data provided in the MEA Wind Power Market report?
While the report offers comprehensive insights, it's advisable to review the specific contents or supplementary materials provided to ascertain if additional resources or data are available.
14. How can I stay updated on further developments or reports in the MEA Wind Power Market?
To stay informed about further developments, trends, and reports in the MEA Wind Power Market, consider subscribing to industry newsletters, following relevant companies and organizations, or regularly checking reputable industry news sources and publications.
Methodology
Step 1 - Identification of Relevant Samples Size from Population Database


Step 2 - Approaches for Defining Global Market Size (Value, Volume* & Price*)

Note*: In applicable scenarios
Step 3 - Data Sources
Primary Research
- Web Analytics
- Survey Reports
- Research Institute
- Latest Research Reports
- Opinion Leaders
Secondary Research
- Annual Reports
- White Paper
- Latest Press Release
- Industry Association
- Paid Database
- Investor Presentations

Step 4 - Data Triangulation
Involves using different sources of information in order to increase the validity of a study
These sources are likely to be stakeholders in a program - participants, other researchers, program staff, other community members, and so on.
Then we put all data in single framework & apply various statistical tools to find out the dynamic on the market.
During the analysis stage, feedback from the stakeholder groups would be compared to determine areas of agreement as well as areas of divergence


