
Key Insights
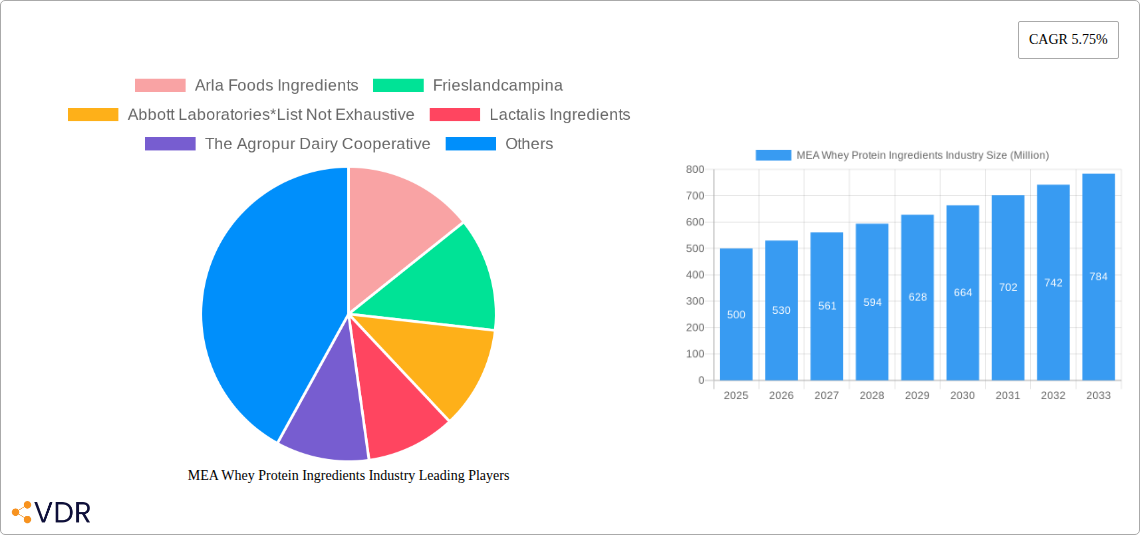
The Middle East and Africa (MEA) whey protein ingredients market, valued at $500 million in 2025, is projected to experience robust growth, driven by a rising health-conscious population increasingly incorporating protein supplements into their diets. This surge in demand is particularly evident in the sports and performance nutrition segment, fueled by the expanding fitness industry and growing participation in athletic activities across the region. Furthermore, the increasing utilization of whey protein in functional foods and infant formula contributes significantly to market expansion. Key countries like South Africa, Saudi Arabia, and the UAE are leading this growth, driven by higher disposable incomes and a greater awareness of the health benefits associated with whey protein. However, challenges remain, including price fluctuations in raw materials (milk) and potential regulatory hurdles related to food safety and labeling. The market is segmented by product type (whey protein concentrate, isolate, and hydrolysate) with whey protein concentrate currently dominating due to its cost-effectiveness. Competition is fierce, with both international giants like Arla Foods and Fonterra, and regional players vying for market share. The forecast period (2025-2033) anticipates sustained growth, propelled by rising consumer awareness and product innovation within the functional food and beverage categories. The CAGR of 5.75% indicates a steady and consistent expansion of the market over the next decade.
Despite challenges, the MEA whey protein ingredients market exhibits considerable potential for growth. The increasing prevalence of chronic diseases and the rising demand for convenient and nutritious food products are bolstering the use of whey protein in functional foods and infant formulas. This, coupled with rising health consciousness, particularly among the younger generations, further reinforces market expansion. Strategic partnerships, product diversification, and targeted marketing strategies will be crucial for companies aiming to capture a larger share of this expanding market. Innovation in product formulations, focusing on specific health benefits, and catering to the diverse dietary preferences across the MEA region will be key differentiators in this competitive landscape. The focus on sustainability and ethical sourcing of raw materials will also become increasingly important to attract environmentally conscious consumers.
MEA Whey Protein Ingredients Industry Market Report: 2019-2033
This comprehensive report provides a detailed analysis of the Middle East and Africa (MEA) whey protein ingredients industry, offering invaluable insights for industry professionals, investors, and strategic decision-makers. Covering the period from 2019 to 2033, with a focus on 2025, this report dissects market dynamics, growth trends, and future prospects across various segments and key players. The MEA whey protein market, a crucial sub-sector within the larger global dairy and food ingredients market, is poised for significant expansion, driven by factors including rising health consciousness, increasing demand for sports nutrition, and the growing infant formula market.
MEA Whey Protein Ingredients Industry Market Dynamics & Structure
This section analyzes the MEA whey protein ingredients market's competitive landscape, technological advancements, regulatory environment, and market trends. We examine market concentration, identifying key players and their respective market shares. The report assesses the impact of technological innovations on production efficiency and product development, including the role of advanced processing techniques and quality control measures. Furthermore, we explore the influence of regulatory frameworks on market access and product safety, as well as the presence of competitive substitutes and their impact on market share. The analysis delves into end-user demographics, identifying key consumer segments driving demand, and explores merger and acquisition (M&A) activities within the industry, quantifying deal volumes and their strategic implications.
- Market Concentration: xx% controlled by top 5 players (2024).
- Technological Innovation: Focus on improving protein yield and functional properties.
- Regulatory Framework: Varied across MEA countries; impact on labeling and import/export.
- Competitive Substitutes: Plant-based protein alternatives pose a growing challenge.
- M&A Activity: xx deals recorded between 2019-2024, with a focus on expanding production capacity and geographic reach.
- End-User Demographics: Growing middle class and increasing health awareness drive demand.
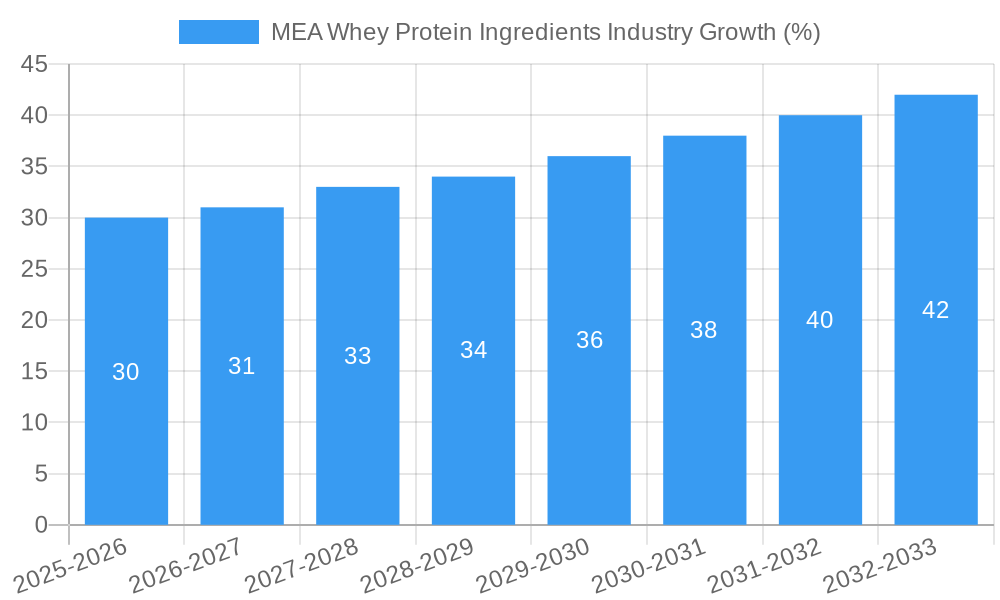
MEA Whey Protein Ingredients Industry Growth Trends & Insights
This section presents a comprehensive overview of the MEA whey protein ingredients market's growth trajectory from 2019 to 2033. Leveraging robust data and analytical methodologies, the report details the evolution of market size, adoption rates across different segments, and the impact of technological disruptions on market dynamics. The analysis also captures shifts in consumer behavior, preferences, and purchasing patterns, illuminating the key factors shaping market growth. Specific metrics, including the Compound Annual Growth Rate (CAGR) and market penetration rates, provide in-depth insights into market performance and future potential. The analysis considers macro-economic trends, including GDP growth and disposable income levels, to forecast future market size and growth rates.
- Market Size (Million USD): 2019: xx, 2024: xx, 2025: xx (Estimated), 2033: xx (Forecast).
- CAGR (2025-2033): xx%
- Market Penetration: xx% in key segments (2024)
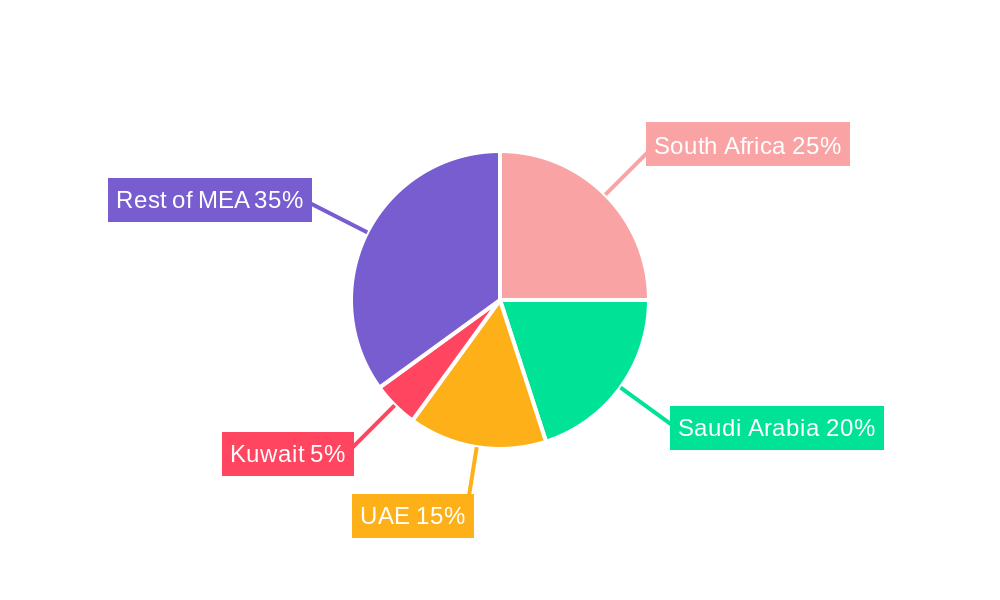
Dominant Regions, Countries, or Segments in MEA Whey Protein Ingredients Industry
This section identifies the leading regions, countries, and segments within the MEA whey protein ingredients market. It analyzes the factors driving market dominance, including economic policies, infrastructure development, and consumer preferences. The analysis explores the market share and growth potential of each segment – By Product Type (Whey Protein Concentrate, Whey Protein Isolate, Hydrolyzed Whey Protein), By Application (Sports and Performance Nutrition, Infant Formula, Functional/Fortified Food, Other Applications), and By Country (South Africa, Saudi Arabia, United Arab Emirates, Kuwait, Rest of Middle East and Africa). Key drivers for each dominant segment are highlighted, providing a clear understanding of their growth trajectory.
- Leading Region: Saudi Arabia, followed by UAE.
- Leading Country: South Africa (due to established dairy industry and infrastructure).
- Leading Product Type: Whey Protein Concentrate (due to cost-effectiveness).
- Leading Application: Sports and Performance Nutrition (due to rising health consciousness).
- Key Drivers: Rising disposable incomes, increasing health awareness, government support for food processing industries.
MEA Whey Protein Ingredients Industry Product Landscape
The MEA whey protein ingredients market offers a diverse range of products, each with unique characteristics and applications. This section details these products, highlighting their innovations, applications, and performance metrics. We examine the unique selling propositions (USPs) of various products and analyze the technological advancements shaping the product landscape. The impact of these advancements on product quality, functionality, and cost-effectiveness are assessed.
- Product Innovations: Focus on enhanced solubility, improved taste and texture, and specialized functional properties.
- Key Applications: Sports nutrition, infant formula, dietary supplements.
Key Drivers, Barriers & Challenges in MEA Whey Protein Ingredients Industry
This section outlines the key factors driving the growth of the MEA whey protein ingredients market and the challenges hindering its expansion. We identify technological advancements, economic factors, and supportive government policies fueling market growth. Conversely, we analyze supply chain disruptions, regulatory hurdles, and competitive pressures that pose challenges to market expansion. We quantify the impact of these challenges whenever possible.
Key Drivers:
- Growing health consciousness and demand for protein-rich foods.
- Rising disposable incomes in several MEA countries.
- Government initiatives promoting the food processing industry.
Key Challenges:
- Fluctuations in raw material prices (milk).
- Stringent regulatory requirements for food safety and labeling.
- Competition from plant-based protein alternatives.
Emerging Opportunities in MEA Whey Protein Ingredients Industry
This section highlights the emerging opportunities in the MEA whey protein ingredients market. We identify untapped markets, innovative applications, and evolving consumer preferences that present growth potential. This includes exploring new product applications in functional foods and beverages, catering to specific dietary needs, and leveraging technological advancements to enhance product quality and functionality.
- Untapped Markets: Expanding into less developed regions within MEA.
- Innovative Applications: Development of whey-protein-based functional foods and beverages targeting specific health concerns.
Growth Accelerators in the MEA Whey Protein Ingredients Industry
This section identifies the key catalysts driving long-term growth in the MEA whey protein ingredients market. We highlight technological breakthroughs, strategic partnerships, and market expansion strategies that contribute to sustained market expansion. The analysis emphasizes the role of innovation in enhancing product quality, reducing production costs, and expanding market reach.
- Technological Breakthroughs: Advancements in whey protein processing and purification techniques.
- Strategic Partnerships: Collaboration between dairy producers and food manufacturers.
Key Players Shaping the MEA Whey Protein Ingredients Market
- Arla Foods Ingredients
- FrieslandCampina
- Abbott Laboratories
- Lactalis Ingredients
- The Agropur Dairy Cooperative
- Erie Foods International Inc
- Fonterra Co-operative Group Limited
- Carbery Group
- Glanbia Nutritionals
- Ingredients Solutions Inc.
Notable Milestones in MEA Whey Protein Ingredients Industry Sector
- 2021 (Q3): Arla Foods Ingredients expands its whey protein production capacity in Saudi Arabia.
- 2022 (Q1): FrieslandCampina acquires a minority stake in a whey protein concentrate and isolate manufacturing plant in Egypt.
- 2023 (Q2): Lactalis Ingredients invests in a new whey protein production line in South Africa.
In-Depth MEA Whey Protein Ingredients Industry Market Outlook
The MEA whey protein ingredients market is poised for sustained growth, driven by several factors. The rising health consciousness among consumers and the growing demand for protein-rich foods and dietary supplements create a strong foundation for market expansion. The continued development of innovative products tailored to specific health needs and preferences will further fuel market growth. Strategic partnerships and investments in production capacity will further enhance market potential. Opportunities exist for companies to expand into untapped markets within the MEA region and leverage technological advancements to improve efficiency and product quality. The overall outlook remains positive, indicating substantial growth prospects for players operating in this dynamic market.
MEA Whey Protein Ingredients Industry Segmentation
-
1. Product Type
- 1.1. Whey Protein Concentrate
- 1.2. Whey Protein Isolate
- 1.3. Hydrolyzed Whey Protein
-
2. Application
- 2.1. Sports and Performance Nutrition
- 2.2. Infant Formula
- 2.3. Functional/Fortified Food
- 2.4. Other Applications
MEA Whey Protein Ingredients Industry Segmentation By Geography
-
1. North America
- 1.1. United States
- 1.2. Canada
- 1.3. Mexico
-
2. South America
- 2.1. Brazil
- 2.2. Argentina
- 2.3. Rest of South America
-
3. Europe
- 3.1. United Kingdom
- 3.2. Germany
- 3.3. France
- 3.4. Italy
- 3.5. Spain
- 3.6. Russia
- 3.7. Benelux
- 3.8. Nordics
- 3.9. Rest of Europe
-
4. Middle East & Africa
- 4.1. Turkey
- 4.2. Israel
- 4.3. GCC
- 4.4. North Africa
- 4.5. South Africa
- 4.6. Rest of Middle East & Africa
-
5. Asia Pacific
- 5.1. China
- 5.2. India
- 5.3. Japan
- 5.4. South Korea
- 5.5. ASEAN
- 5.6. Oceania
- 5.7. Rest of Asia Pacific
MEA Whey Protein Ingredients Industry REPORT HIGHLIGHTS
| Aspects | Details |
|---|---|
| Study Period | 2019-2033 |
| Base Year | 2024 |
| Estimated Year | 2025 |
| Forecast Period | 2025-2033 |
| Historical Period | 2019-2024 |
| Growth Rate | CAGR of 5.75% from 2019-2033 |
| Segmentation |
|
Table of Contents
- 1. Introduction
- 1.1. Research Scope
- 1.2. Market Segmentation
- 1.3. Research Methodology
- 1.4. Definitions and Assumptions
- 2. Executive Summary
- 2.1. Introduction
- 3. Market Dynamics
- 3.1. Introduction
- 3.2. Market Drivers
- 3.2.1. Increasing demand for sports nutritional supplements
- 3.3. Market Restrains
- 3.3.1. Rising demand for plant-based protein
- 3.4. Market Trends
- 3.4.1. Increasing Health and Fitness Club Memberships In The Region
- 4. Market Factor Analysis
- 4.1. Porters Five Forces
- 4.2. Supply/Value Chain
- 4.3. PESTEL analysis
- 4.4. Market Entropy
- 4.5. Patent/Trademark Analysis
- 5. Global MEA Whey Protein Ingredients Industry Analysis, Insights and Forecast, 2019-2031
- 5.1. Market Analysis, Insights and Forecast - by Product Type
- 5.1.1. Whey Protein Concentrate
- 5.1.2. Whey Protein Isolate
- 5.1.3. Hydrolyzed Whey Protein
- 5.2. Market Analysis, Insights and Forecast - by Application
- 5.2.1. Sports and Performance Nutrition
- 5.2.2. Infant Formula
- 5.2.3. Functional/Fortified Food
- 5.2.4. Other Applications
- 5.3. Market Analysis, Insights and Forecast - by Region
- 5.3.1. North America
- 5.3.2. South America
- 5.3.3. Europe
- 5.3.4. Middle East & Africa
- 5.3.5. Asia Pacific
- 5.1. Market Analysis, Insights and Forecast - by Product Type
- 6. North America MEA Whey Protein Ingredients Industry Analysis, Insights and Forecast, 2019-2031
- 6.1. Market Analysis, Insights and Forecast - by Product Type
- 6.1.1. Whey Protein Concentrate
- 6.1.2. Whey Protein Isolate
- 6.1.3. Hydrolyzed Whey Protein
- 6.2. Market Analysis, Insights and Forecast - by Application
- 6.2.1. Sports and Performance Nutrition
- 6.2.2. Infant Formula
- 6.2.3. Functional/Fortified Food
- 6.2.4. Other Applications
- 6.1. Market Analysis, Insights and Forecast - by Product Type
- 7. South America MEA Whey Protein Ingredients Industry Analysis, Insights and Forecast, 2019-2031
- 7.1. Market Analysis, Insights and Forecast - by Product Type
- 7.1.1. Whey Protein Concentrate
- 7.1.2. Whey Protein Isolate
- 7.1.3. Hydrolyzed Whey Protein
- 7.2. Market Analysis, Insights and Forecast - by Application
- 7.2.1. Sports and Performance Nutrition
- 7.2.2. Infant Formula
- 7.2.3. Functional/Fortified Food
- 7.2.4. Other Applications
- 7.1. Market Analysis, Insights and Forecast - by Product Type
- 8. Europe MEA Whey Protein Ingredients Industry Analysis, Insights and Forecast, 2019-2031
- 8.1. Market Analysis, Insights and Forecast - by Product Type
- 8.1.1. Whey Protein Concentrate
- 8.1.2. Whey Protein Isolate
- 8.1.3. Hydrolyzed Whey Protein
- 8.2. Market Analysis, Insights and Forecast - by Application
- 8.2.1. Sports and Performance Nutrition
- 8.2.2. Infant Formula
- 8.2.3. Functional/Fortified Food
- 8.2.4. Other Applications
- 8.1. Market Analysis, Insights and Forecast - by Product Type
- 9. Middle East & Africa MEA Whey Protein Ingredients Industry Analysis, Insights and Forecast, 2019-2031
- 9.1. Market Analysis, Insights and Forecast - by Product Type
- 9.1.1. Whey Protein Concentrate
- 9.1.2. Whey Protein Isolate
- 9.1.3. Hydrolyzed Whey Protein
- 9.2. Market Analysis, Insights and Forecast - by Application
- 9.2.1. Sports and Performance Nutrition
- 9.2.2. Infant Formula
- 9.2.3. Functional/Fortified Food
- 9.2.4. Other Applications
- 9.1. Market Analysis, Insights and Forecast - by Product Type
- 10. Asia Pacific MEA Whey Protein Ingredients Industry Analysis, Insights and Forecast, 2019-2031
- 10.1. Market Analysis, Insights and Forecast - by Product Type
- 10.1.1. Whey Protein Concentrate
- 10.1.2. Whey Protein Isolate
- 10.1.3. Hydrolyzed Whey Protein
- 10.2. Market Analysis, Insights and Forecast - by Application
- 10.2.1. Sports and Performance Nutrition
- 10.2.2. Infant Formula
- 10.2.3. Functional/Fortified Food
- 10.2.4. Other Applications
- 10.1. Market Analysis, Insights and Forecast - by Product Type
- 11. Brazil MEA Whey Protein Ingredients Industry Analysis, Insights and Forecast, 2019-2031
- 11.1. Market Analysis, Insights and Forecast - By Country/Sub-region
- 11.1.1.
- 12. Argentina MEA Whey Protein Ingredients Industry Analysis, Insights and Forecast, 2019-2031
- 12.1. Market Analysis, Insights and Forecast - By Country/Sub-region
- 12.1.1.
- 13. Rest of South America MEA Whey Protein Ingredients Industry Analysis, Insights and Forecast, 2019-2031
- 13.1. Market Analysis, Insights and Forecast - By Country/Sub-region
- 13.1.1.
- 14. Competitive Analysis
- 14.1. Global Market Share Analysis 2024
- 14.2. Company Profiles
- 14.2.1 Arla Foods Ingredients
- 14.2.1.1. Overview
- 14.2.1.2. Products
- 14.2.1.3. SWOT Analysis
- 14.2.1.4. Recent Developments
- 14.2.1.5. Financials (Based on Availability)
- 14.2.2 Frieslandcampina
- 14.2.2.1. Overview
- 14.2.2.2. Products
- 14.2.2.3. SWOT Analysis
- 14.2.2.4. Recent Developments
- 14.2.2.5. Financials (Based on Availability)
- 14.2.3 Abbott Laboratories*List Not Exhaustive
- 14.2.3.1. Overview
- 14.2.3.2. Products
- 14.2.3.3. SWOT Analysis
- 14.2.3.4. Recent Developments
- 14.2.3.5. Financials (Based on Availability)
- 14.2.4 Lactalis Ingredients
- 14.2.4.1. Overview
- 14.2.4.2. Products
- 14.2.4.3. SWOT Analysis
- 14.2.4.4. Recent Developments
- 14.2.4.5. Financials (Based on Availability)
- 14.2.5 The Agropur Dairy Cooperative
- 14.2.5.1. Overview
- 14.2.5.2. Products
- 14.2.5.3. SWOT Analysis
- 14.2.5.4. Recent Developments
- 14.2.5.5. Financials (Based on Availability)
- 14.2.6 Erie Foods International Inc
- 14.2.6.1. Overview
- 14.2.6.2. Products
- 14.2.6.3. SWOT Analysis
- 14.2.6.4. Recent Developments
- 14.2.6.5. Financials (Based on Availability)
- 14.2.7 Fonterra Co-operative Group Limited
- 14.2.7.1. Overview
- 14.2.7.2. Products
- 14.2.7.3. SWOT Analysis
- 14.2.7.4. Recent Developments
- 14.2.7.5. Financials (Based on Availability)
- 14.2.8 Carbery Group
- 14.2.8.1. Overview
- 14.2.8.2. Products
- 14.2.8.3. SWOT Analysis
- 14.2.8.4. Recent Developments
- 14.2.8.5. Financials (Based on Availability)
- 14.2.9 Glanbia Nutritionals
- 14.2.9.1. Overview
- 14.2.9.2. Products
- 14.2.9.3. SWOT Analysis
- 14.2.9.4. Recent Developments
- 14.2.9.5. Financials (Based on Availability)
- 14.2.10 Ingredients Solutions Inc.
- 14.2.10.1. Overview
- 14.2.10.2. Products
- 14.2.10.3. SWOT Analysis
- 14.2.10.4. Recent Developments
- 14.2.10.5. Financials (Based on Availability)
- 14.2.1 Arla Foods Ingredients
List of Figures
- Figure 1: Global MEA Whey Protein Ingredients Industry Revenue Breakdown (Million, %) by Region 2024 & 2032
- Figure 2: Global MEA Whey Protein Ingredients Industry Volume Breakdown (K Tons, %) by Region 2024 & 2032
- Figure 3: Brazil MEA Whey Protein Ingredients Industry Revenue (Million), by Country 2024 & 2032
- Figure 4: Brazil MEA Whey Protein Ingredients Industry Volume (K Tons), by Country 2024 & 2032
- Figure 5: Brazil MEA Whey Protein Ingredients Industry Revenue Share (%), by Country 2024 & 2032
- Figure 6: Brazil MEA Whey Protein Ingredients Industry Volume Share (%), by Country 2024 & 2032
- Figure 7: Argentina MEA Whey Protein Ingredients Industry Revenue (Million), by Country 2024 & 2032
- Figure 8: Argentina MEA Whey Protein Ingredients Industry Volume (K Tons), by Country 2024 & 2032
- Figure 9: Argentina MEA Whey Protein Ingredients Industry Revenue Share (%), by Country 2024 & 2032
- Figure 10: Argentina MEA Whey Protein Ingredients Industry Volume Share (%), by Country 2024 & 2032
- Figure 11: Rest of South America MEA Whey Protein Ingredients Industry Revenue (Million), by Country 2024 & 2032
- Figure 12: Rest of South America MEA Whey Protein Ingredients Industry Volume (K Tons), by Country 2024 & 2032
- Figure 13: Rest of South America MEA Whey Protein Ingredients Industry Revenue Share (%), by Country 2024 & 2032
- Figure 14: Rest of South America MEA Whey Protein Ingredients Industry Volume Share (%), by Country 2024 & 2032
- Figure 15: North America MEA Whey Protein Ingredients Industry Revenue (Million), by Product Type 2024 & 2032
- Figure 16: North America MEA Whey Protein Ingredients Industry Volume (K Tons), by Product Type 2024 & 2032
- Figure 17: North America MEA Whey Protein Ingredients Industry Revenue Share (%), by Product Type 2024 & 2032
- Figure 18: North America MEA Whey Protein Ingredients Industry Volume Share (%), by Product Type 2024 & 2032
- Figure 19: North America MEA Whey Protein Ingredients Industry Revenue (Million), by Application 2024 & 2032
- Figure 20: North America MEA Whey Protein Ingredients Industry Volume (K Tons), by Application 2024 & 2032
- Figure 21: North America MEA Whey Protein Ingredients Industry Revenue Share (%), by Application 2024 & 2032
- Figure 22: North America MEA Whey Protein Ingredients Industry Volume Share (%), by Application 2024 & 2032
- Figure 23: North America MEA Whey Protein Ingredients Industry Revenue (Million), by Country 2024 & 2032
- Figure 24: North America MEA Whey Protein Ingredients Industry Volume (K Tons), by Country 2024 & 2032
- Figure 25: North America MEA Whey Protein Ingredients Industry Revenue Share (%), by Country 2024 & 2032
- Figure 26: North America MEA Whey Protein Ingredients Industry Volume Share (%), by Country 2024 & 2032
- Figure 27: South America MEA Whey Protein Ingredients Industry Revenue (Million), by Product Type 2024 & 2032
- Figure 28: South America MEA Whey Protein Ingredients Industry Volume (K Tons), by Product Type 2024 & 2032
- Figure 29: South America MEA Whey Protein Ingredients Industry Revenue Share (%), by Product Type 2024 & 2032
- Figure 30: South America MEA Whey Protein Ingredients Industry Volume Share (%), by Product Type 2024 & 2032
- Figure 31: South America MEA Whey Protein Ingredients Industry Revenue (Million), by Application 2024 & 2032
- Figure 32: South America MEA Whey Protein Ingredients Industry Volume (K Tons), by Application 2024 & 2032
- Figure 33: South America MEA Whey Protein Ingredients Industry Revenue Share (%), by Application 2024 & 2032
- Figure 34: South America MEA Whey Protein Ingredients Industry Volume Share (%), by Application 2024 & 2032
- Figure 35: South America MEA Whey Protein Ingredients Industry Revenue (Million), by Country 2024 & 2032
- Figure 36: South America MEA Whey Protein Ingredients Industry Volume (K Tons), by Country 2024 & 2032
- Figure 37: South America MEA Whey Protein Ingredients Industry Revenue Share (%), by Country 2024 & 2032
- Figure 38: South America MEA Whey Protein Ingredients Industry Volume Share (%), by Country 2024 & 2032
- Figure 39: Europe MEA Whey Protein Ingredients Industry Revenue (Million), by Product Type 2024 & 2032
- Figure 40: Europe MEA Whey Protein Ingredients Industry Volume (K Tons), by Product Type 2024 & 2032
- Figure 41: Europe MEA Whey Protein Ingredients Industry Revenue Share (%), by Product Type 2024 & 2032
- Figure 42: Europe MEA Whey Protein Ingredients Industry Volume Share (%), by Product Type 2024 & 2032
- Figure 43: Europe MEA Whey Protein Ingredients Industry Revenue (Million), by Application 2024 & 2032
- Figure 44: Europe MEA Whey Protein Ingredients Industry Volume (K Tons), by Application 2024 & 2032
- Figure 45: Europe MEA Whey Protein Ingredients Industry Revenue Share (%), by Application 2024 & 2032
- Figure 46: Europe MEA Whey Protein Ingredients Industry Volume Share (%), by Application 2024 & 2032
- Figure 47: Europe MEA Whey Protein Ingredients Industry Revenue (Million), by Country 2024 & 2032
- Figure 48: Europe MEA Whey Protein Ingredients Industry Volume (K Tons), by Country 2024 & 2032
- Figure 49: Europe MEA Whey Protein Ingredients Industry Revenue Share (%), by Country 2024 & 2032
- Figure 50: Europe MEA Whey Protein Ingredients Industry Volume Share (%), by Country 2024 & 2032
- Figure 51: Middle East & Africa MEA Whey Protein Ingredients Industry Revenue (Million), by Product Type 2024 & 2032
- Figure 52: Middle East & Africa MEA Whey Protein Ingredients Industry Volume (K Tons), by Product Type 2024 & 2032
- Figure 53: Middle East & Africa MEA Whey Protein Ingredients Industry Revenue Share (%), by Product Type 2024 & 2032
- Figure 54: Middle East & Africa MEA Whey Protein Ingredients Industry Volume Share (%), by Product Type 2024 & 2032
- Figure 55: Middle East & Africa MEA Whey Protein Ingredients Industry Revenue (Million), by Application 2024 & 2032
- Figure 56: Middle East & Africa MEA Whey Protein Ingredients Industry Volume (K Tons), by Application 2024 & 2032
- Figure 57: Middle East & Africa MEA Whey Protein Ingredients Industry Revenue Share (%), by Application 2024 & 2032
- Figure 58: Middle East & Africa MEA Whey Protein Ingredients Industry Volume Share (%), by Application 2024 & 2032
- Figure 59: Middle East & Africa MEA Whey Protein Ingredients Industry Revenue (Million), by Country 2024 & 2032
- Figure 60: Middle East & Africa MEA Whey Protein Ingredients Industry Volume (K Tons), by Country 2024 & 2032
- Figure 61: Middle East & Africa MEA Whey Protein Ingredients Industry Revenue Share (%), by Country 2024 & 2032
- Figure 62: Middle East & Africa MEA Whey Protein Ingredients Industry Volume Share (%), by Country 2024 & 2032
- Figure 63: Asia Pacific MEA Whey Protein Ingredients Industry Revenue (Million), by Product Type 2024 & 2032
- Figure 64: Asia Pacific MEA Whey Protein Ingredients Industry Volume (K Tons), by Product Type 2024 & 2032
- Figure 65: Asia Pacific MEA Whey Protein Ingredients Industry Revenue Share (%), by Product Type 2024 & 2032
- Figure 66: Asia Pacific MEA Whey Protein Ingredients Industry Volume Share (%), by Product Type 2024 & 2032
- Figure 67: Asia Pacific MEA Whey Protein Ingredients Industry Revenue (Million), by Application 2024 & 2032
- Figure 68: Asia Pacific MEA Whey Protein Ingredients Industry Volume (K Tons), by Application 2024 & 2032
- Figure 69: Asia Pacific MEA Whey Protein Ingredients Industry Revenue Share (%), by Application 2024 & 2032
- Figure 70: Asia Pacific MEA Whey Protein Ingredients Industry Volume Share (%), by Application 2024 & 2032
- Figure 71: Asia Pacific MEA Whey Protein Ingredients Industry Revenue (Million), by Country 2024 & 2032
- Figure 72: Asia Pacific MEA Whey Protein Ingredients Industry Volume (K Tons), by Country 2024 & 2032
- Figure 73: Asia Pacific MEA Whey Protein Ingredients Industry Revenue Share (%), by Country 2024 & 2032
- Figure 74: Asia Pacific MEA Whey Protein Ingredients Industry Volume Share (%), by Country 2024 & 2032
List of Tables
- Table 1: Global MEA Whey Protein Ingredients Industry Revenue Million Forecast, by Region 2019 & 2032
- Table 2: Global MEA Whey Protein Ingredients Industry Volume K Tons Forecast, by Region 2019 & 2032
- Table 3: Global MEA Whey Protein Ingredients Industry Revenue Million Forecast, by Product Type 2019 & 2032
- Table 4: Global MEA Whey Protein Ingredients Industry Volume K Tons Forecast, by Product Type 2019 & 2032
- Table 5: Global MEA Whey Protein Ingredients Industry Revenue Million Forecast, by Application 2019 & 2032
- Table 6: Global MEA Whey Protein Ingredients Industry Volume K Tons Forecast, by Application 2019 & 2032
- Table 7: Global MEA Whey Protein Ingredients Industry Revenue Million Forecast, by Region 2019 & 2032
- Table 8: Global MEA Whey Protein Ingredients Industry Volume K Tons Forecast, by Region 2019 & 2032
- Table 9: Global MEA Whey Protein Ingredients Industry Revenue Million Forecast, by Country 2019 & 2032
- Table 10: Global MEA Whey Protein Ingredients Industry Volume K Tons Forecast, by Country 2019 & 2032
- Table 11: MEA Whey Protein Ingredients Industry Revenue (Million) Forecast, by Application 2019 & 2032
- Table 12: MEA Whey Protein Ingredients Industry Volume (K Tons) Forecast, by Application 2019 & 2032
- Table 13: Global MEA Whey Protein Ingredients Industry Revenue Million Forecast, by Country 2019 & 2032
- Table 14: Global MEA Whey Protein Ingredients Industry Volume K Tons Forecast, by Country 2019 & 2032
- Table 15: MEA Whey Protein Ingredients Industry Revenue (Million) Forecast, by Application 2019 & 2032
- Table 16: MEA Whey Protein Ingredients Industry Volume (K Tons) Forecast, by Application 2019 & 2032
- Table 17: Global MEA Whey Protein Ingredients Industry Revenue Million Forecast, by Country 2019 & 2032
- Table 18: Global MEA Whey Protein Ingredients Industry Volume K Tons Forecast, by Country 2019 & 2032
- Table 19: MEA Whey Protein Ingredients Industry Revenue (Million) Forecast, by Application 2019 & 2032
- Table 20: MEA Whey Protein Ingredients Industry Volume (K Tons) Forecast, by Application 2019 & 2032
- Table 21: Global MEA Whey Protein Ingredients Industry Revenue Million Forecast, by Product Type 2019 & 2032
- Table 22: Global MEA Whey Protein Ingredients Industry Volume K Tons Forecast, by Product Type 2019 & 2032
- Table 23: Global MEA Whey Protein Ingredients Industry Revenue Million Forecast, by Application 2019 & 2032
- Table 24: Global MEA Whey Protein Ingredients Industry Volume K Tons Forecast, by Application 2019 & 2032
- Table 25: Global MEA Whey Protein Ingredients Industry Revenue Million Forecast, by Country 2019 & 2032
- Table 26: Global MEA Whey Protein Ingredients Industry Volume K Tons Forecast, by Country 2019 & 2032
- Table 27: United States MEA Whey Protein Ingredients Industry Revenue (Million) Forecast, by Application 2019 & 2032
- Table 28: United States MEA Whey Protein Ingredients Industry Volume (K Tons) Forecast, by Application 2019 & 2032
- Table 29: Canada MEA Whey Protein Ingredients Industry Revenue (Million) Forecast, by Application 2019 & 2032
- Table 30: Canada MEA Whey Protein Ingredients Industry Volume (K Tons) Forecast, by Application 2019 & 2032
- Table 31: Mexico MEA Whey Protein Ingredients Industry Revenue (Million) Forecast, by Application 2019 & 2032
- Table 32: Mexico MEA Whey Protein Ingredients Industry Volume (K Tons) Forecast, by Application 2019 & 2032
- Table 33: Global MEA Whey Protein Ingredients Industry Revenue Million Forecast, by Product Type 2019 & 2032
- Table 34: Global MEA Whey Protein Ingredients Industry Volume K Tons Forecast, by Product Type 2019 & 2032
- Table 35: Global MEA Whey Protein Ingredients Industry Revenue Million Forecast, by Application 2019 & 2032
- Table 36: Global MEA Whey Protein Ingredients Industry Volume K Tons Forecast, by Application 2019 & 2032
- Table 37: Global MEA Whey Protein Ingredients Industry Revenue Million Forecast, by Country 2019 & 2032
- Table 38: Global MEA Whey Protein Ingredients Industry Volume K Tons Forecast, by Country 2019 & 2032
- Table 39: Brazil MEA Whey Protein Ingredients Industry Revenue (Million) Forecast, by Application 2019 & 2032
- Table 40: Brazil MEA Whey Protein Ingredients Industry Volume (K Tons) Forecast, by Application 2019 & 2032
- Table 41: Argentina MEA Whey Protein Ingredients Industry Revenue (Million) Forecast, by Application 2019 & 2032
- Table 42: Argentina MEA Whey Protein Ingredients Industry Volume (K Tons) Forecast, by Application 2019 & 2032
- Table 43: Rest of South America MEA Whey Protein Ingredients Industry Revenue (Million) Forecast, by Application 2019 & 2032
- Table 44: Rest of South America MEA Whey Protein Ingredients Industry Volume (K Tons) Forecast, by Application 2019 & 2032
- Table 45: Global MEA Whey Protein Ingredients Industry Revenue Million Forecast, by Product Type 2019 & 2032
- Table 46: Global MEA Whey Protein Ingredients Industry Volume K Tons Forecast, by Product Type 2019 & 2032
- Table 47: Global MEA Whey Protein Ingredients Industry Revenue Million Forecast, by Application 2019 & 2032
- Table 48: Global MEA Whey Protein Ingredients Industry Volume K Tons Forecast, by Application 2019 & 2032
- Table 49: Global MEA Whey Protein Ingredients Industry Revenue Million Forecast, by Country 2019 & 2032
- Table 50: Global MEA Whey Protein Ingredients Industry Volume K Tons Forecast, by Country 2019 & 2032
- Table 51: United Kingdom MEA Whey Protein Ingredients Industry Revenue (Million) Forecast, by Application 2019 & 2032
- Table 52: United Kingdom MEA Whey Protein Ingredients Industry Volume (K Tons) Forecast, by Application 2019 & 2032
- Table 53: Germany MEA Whey Protein Ingredients Industry Revenue (Million) Forecast, by Application 2019 & 2032
- Table 54: Germany MEA Whey Protein Ingredients Industry Volume (K Tons) Forecast, by Application 2019 & 2032
- Table 55: France MEA Whey Protein Ingredients Industry Revenue (Million) Forecast, by Application 2019 & 2032
- Table 56: France MEA Whey Protein Ingredients Industry Volume (K Tons) Forecast, by Application 2019 & 2032
- Table 57: Italy MEA Whey Protein Ingredients Industry Revenue (Million) Forecast, by Application 2019 & 2032
- Table 58: Italy MEA Whey Protein Ingredients Industry Volume (K Tons) Forecast, by Application 2019 & 2032
- Table 59: Spain MEA Whey Protein Ingredients Industry Revenue (Million) Forecast, by Application 2019 & 2032
- Table 60: Spain MEA Whey Protein Ingredients Industry Volume (K Tons) Forecast, by Application 2019 & 2032
- Table 61: Russia MEA Whey Protein Ingredients Industry Revenue (Million) Forecast, by Application 2019 & 2032
- Table 62: Russia MEA Whey Protein Ingredients Industry Volume (K Tons) Forecast, by Application 2019 & 2032
- Table 63: Benelux MEA Whey Protein Ingredients Industry Revenue (Million) Forecast, by Application 2019 & 2032
- Table 64: Benelux MEA Whey Protein Ingredients Industry Volume (K Tons) Forecast, by Application 2019 & 2032
- Table 65: Nordics MEA Whey Protein Ingredients Industry Revenue (Million) Forecast, by Application 2019 & 2032
- Table 66: Nordics MEA Whey Protein Ingredients Industry Volume (K Tons) Forecast, by Application 2019 & 2032
- Table 67: Rest of Europe MEA Whey Protein Ingredients Industry Revenue (Million) Forecast, by Application 2019 & 2032
- Table 68: Rest of Europe MEA Whey Protein Ingredients Industry Volume (K Tons) Forecast, by Application 2019 & 2032
- Table 69: Global MEA Whey Protein Ingredients Industry Revenue Million Forecast, by Product Type 2019 & 2032
- Table 70: Global MEA Whey Protein Ingredients Industry Volume K Tons Forecast, by Product Type 2019 & 2032
- Table 71: Global MEA Whey Protein Ingredients Industry Revenue Million Forecast, by Application 2019 & 2032
- Table 72: Global MEA Whey Protein Ingredients Industry Volume K Tons Forecast, by Application 2019 & 2032
- Table 73: Global MEA Whey Protein Ingredients Industry Revenue Million Forecast, by Country 2019 & 2032
- Table 74: Global MEA Whey Protein Ingredients Industry Volume K Tons Forecast, by Country 2019 & 2032
- Table 75: Turkey MEA Whey Protein Ingredients Industry Revenue (Million) Forecast, by Application 2019 & 2032
- Table 76: Turkey MEA Whey Protein Ingredients Industry Volume (K Tons) Forecast, by Application 2019 & 2032
- Table 77: Israel MEA Whey Protein Ingredients Industry Revenue (Million) Forecast, by Application 2019 & 2032
- Table 78: Israel MEA Whey Protein Ingredients Industry Volume (K Tons) Forecast, by Application 2019 & 2032
- Table 79: GCC MEA Whey Protein Ingredients Industry Revenue (Million) Forecast, by Application 2019 & 2032
- Table 80: GCC MEA Whey Protein Ingredients Industry Volume (K Tons) Forecast, by Application 2019 & 2032
- Table 81: North Africa MEA Whey Protein Ingredients Industry Revenue (Million) Forecast, by Application 2019 & 2032
- Table 82: North Africa MEA Whey Protein Ingredients Industry Volume (K Tons) Forecast, by Application 2019 & 2032
- Table 83: South Africa MEA Whey Protein Ingredients Industry Revenue (Million) Forecast, by Application 2019 & 2032
- Table 84: South Africa MEA Whey Protein Ingredients Industry Volume (K Tons) Forecast, by Application 2019 & 2032
- Table 85: Rest of Middle East & Africa MEA Whey Protein Ingredients Industry Revenue (Million) Forecast, by Application 2019 & 2032
- Table 86: Rest of Middle East & Africa MEA Whey Protein Ingredients Industry Volume (K Tons) Forecast, by Application 2019 & 2032
- Table 87: Global MEA Whey Protein Ingredients Industry Revenue Million Forecast, by Product Type 2019 & 2032
- Table 88: Global MEA Whey Protein Ingredients Industry Volume K Tons Forecast, by Product Type 2019 & 2032
- Table 89: Global MEA Whey Protein Ingredients Industry Revenue Million Forecast, by Application 2019 & 2032
- Table 90: Global MEA Whey Protein Ingredients Industry Volume K Tons Forecast, by Application 2019 & 2032
- Table 91: Global MEA Whey Protein Ingredients Industry Revenue Million Forecast, by Country 2019 & 2032
- Table 92: Global MEA Whey Protein Ingredients Industry Volume K Tons Forecast, by Country 2019 & 2032
- Table 93: China MEA Whey Protein Ingredients Industry Revenue (Million) Forecast, by Application 2019 & 2032
- Table 94: China MEA Whey Protein Ingredients Industry Volume (K Tons) Forecast, by Application 2019 & 2032
- Table 95: India MEA Whey Protein Ingredients Industry Revenue (Million) Forecast, by Application 2019 & 2032
- Table 96: India MEA Whey Protein Ingredients Industry Volume (K Tons) Forecast, by Application 2019 & 2032
- Table 97: Japan MEA Whey Protein Ingredients Industry Revenue (Million) Forecast, by Application 2019 & 2032
- Table 98: Japan MEA Whey Protein Ingredients Industry Volume (K Tons) Forecast, by Application 2019 & 2032
- Table 99: South Korea MEA Whey Protein Ingredients Industry Revenue (Million) Forecast, by Application 2019 & 2032
- Table 100: South Korea MEA Whey Protein Ingredients Industry Volume (K Tons) Forecast, by Application 2019 & 2032
- Table 101: ASEAN MEA Whey Protein Ingredients Industry Revenue (Million) Forecast, by Application 2019 & 2032
- Table 102: ASEAN MEA Whey Protein Ingredients Industry Volume (K Tons) Forecast, by Application 2019 & 2032
- Table 103: Oceania MEA Whey Protein Ingredients Industry Revenue (Million) Forecast, by Application 2019 & 2032
- Table 104: Oceania MEA Whey Protein Ingredients Industry Volume (K Tons) Forecast, by Application 2019 & 2032
- Table 105: Rest of Asia Pacific MEA Whey Protein Ingredients Industry Revenue (Million) Forecast, by Application 2019 & 2032
- Table 106: Rest of Asia Pacific MEA Whey Protein Ingredients Industry Volume (K Tons) Forecast, by Application 2019 & 2032
Frequently Asked Questions
1. What is the projected Compound Annual Growth Rate (CAGR) of the MEA Whey Protein Ingredients Industry?
The projected CAGR is approximately 5.75%.
2. Which companies are prominent players in the MEA Whey Protein Ingredients Industry?
Key companies in the market include Arla Foods Ingredients, Frieslandcampina, Abbott Laboratories*List Not Exhaustive, Lactalis Ingredients, The Agropur Dairy Cooperative, Erie Foods International Inc, Fonterra Co-operative Group Limited, Carbery Group, Glanbia Nutritionals, Ingredients Solutions Inc..
3. What are the main segments of the MEA Whey Protein Ingredients Industry?
The market segments include Product Type, Application.
4. Can you provide details about the market size?
The market size is estimated to be USD 500 Million as of 2022.
5. What are some drivers contributing to market growth?
Increasing demand for sports nutritional supplements.
6. What are the notable trends driving market growth?
Increasing Health and Fitness Club Memberships In The Region.
7. Are there any restraints impacting market growth?
Rising demand for plant-based protein.
8. Can you provide examples of recent developments in the market?
2021: Arla Foods Ingredients expands its whey protein production capacity in Saudi Arabia.
9. What pricing options are available for accessing the report?
Pricing options include single-user, multi-user, and enterprise licenses priced at USD 3800, USD 4500, and USD 5800 respectively.
10. Is the market size provided in terms of value or volume?
The market size is provided in terms of value, measured in Million and volume, measured in K Tons.
11. Are there any specific market keywords associated with the report?
Yes, the market keyword associated with the report is "MEA Whey Protein Ingredients Industry," which aids in identifying and referencing the specific market segment covered.
12. How do I determine which pricing option suits my needs best?
The pricing options vary based on user requirements and access needs. Individual users may opt for single-user licenses, while businesses requiring broader access may choose multi-user or enterprise licenses for cost-effective access to the report.
13. Are there any additional resources or data provided in the MEA Whey Protein Ingredients Industry report?
While the report offers comprehensive insights, it's advisable to review the specific contents or supplementary materials provided to ascertain if additional resources or data are available.
14. How can I stay updated on further developments or reports in the MEA Whey Protein Ingredients Industry?
To stay informed about further developments, trends, and reports in the MEA Whey Protein Ingredients Industry, consider subscribing to industry newsletters, following relevant companies and organizations, or regularly checking reputable industry news sources and publications.
Methodology
Step 1 - Identification of Relevant Samples Size from Population Database


Step 2 - Approaches for Defining Global Market Size (Value, Volume* & Price*)

Note*: In applicable scenarios
Step 3 - Data Sources
Primary Research
- Web Analytics
- Survey Reports
- Research Institute
- Latest Research Reports
- Opinion Leaders
Secondary Research
- Annual Reports
- White Paper
- Latest Press Release
- Industry Association
- Paid Database
- Investor Presentations

Step 4 - Data Triangulation
Involves using different sources of information in order to increase the validity of a study
These sources are likely to be stakeholders in a program - participants, other researchers, program staff, other community members, and so on.
Then we put all data in single framework & apply various statistical tools to find out the dynamic on the market.
During the analysis stage, feedback from the stakeholder groups would be compared to determine areas of agreement as well as areas of divergence


