
Key Insights
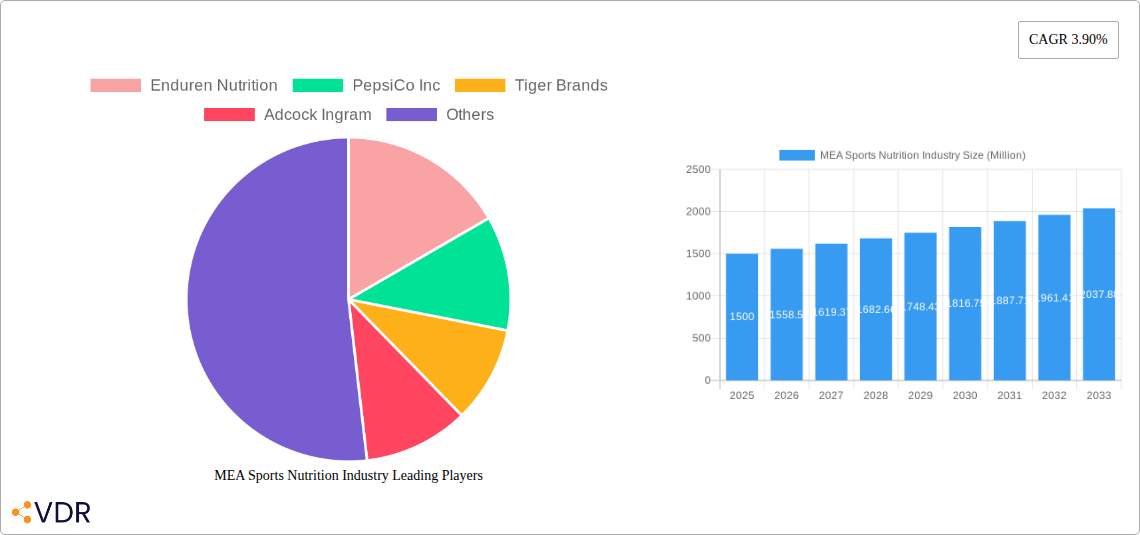
The Middle East and Africa (MEA) sports nutrition market, encompassing sports foods, drinks, and supplements, is experiencing steady growth, projected to maintain a Compound Annual Growth Rate (CAGR) of 3.90% from 2025 to 2033. This expansion is fueled by several key factors. Rising health consciousness among consumers, particularly in urban areas of South Africa and Saudi Arabia, is driving demand for functional foods and beverages that support athletic performance and overall well-being. The increasing popularity of fitness activities, including gym memberships and participation in various sports, further contributes to market growth. Moreover, the growing penetration of e-commerce platforms provides convenient access to a wider range of sports nutrition products, expanding market reach beyond traditional retail channels like supermarkets and specialty stores. While challenges such as fluctuating economic conditions and price sensitivity among consumers exist, the overall market outlook remains positive due to sustained growth in disposable incomes and a rising trend towards preventative healthcare.
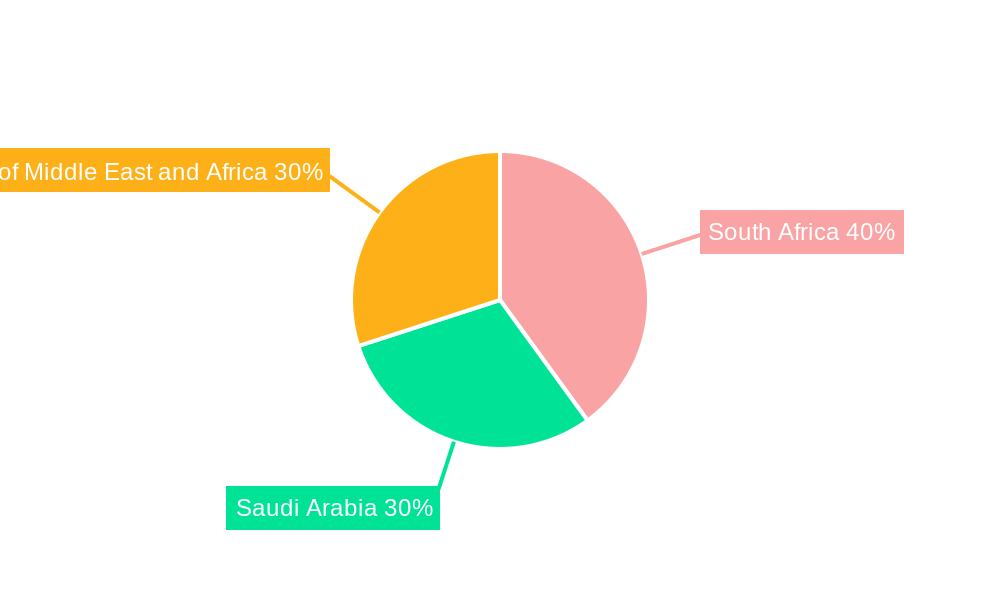
The market segmentation reveals a diverse landscape. Sports supplements are likely the fastest-growing segment, driven by the rising awareness of the benefits of targeted nutritional support for specific fitness goals. Online channels are gaining traction, reflecting broader e-commerce growth across the MEA region. While South Africa and Saudi Arabia are key markets, the "Rest of Middle East and Africa" segment presents significant untapped potential as consumer awareness and disposable incomes increase. Major players like PepsiCo, Coca-Cola, and smaller specialized brands like Enduren Nutrition are vying for market share, indicating a competitive yet dynamic industry. Future growth hinges on effective marketing strategies targeting health-conscious consumers, strategic partnerships to expand distribution networks, and the development of innovative products tailored to the specific needs and preferences of the MEA region.
MEA Sports Nutrition Industry Market Report: 2019-2033
This comprehensive report provides a detailed analysis of the Middle East and Africa (MEA) sports nutrition industry, covering the period from 2019 to 2033. It offers invaluable insights into market dynamics, growth trends, competitive landscapes, and future opportunities for industry professionals, investors, and strategic planners. The report leverages rigorous research methodologies and incorporates data from the base year 2025, with estimates for 2025 and forecasts spanning 2025-2033. This report focuses on key segments such as Sports Food, Sports Drinks, and Sports Supplements across various distribution channels including Supermarkets/Hypermarkets, Convenience Stores, Specialty Stores, Online Stores, and Others. Market values are presented in million units.
MEA Sports Nutrition Industry Market Dynamics & Structure
The MEA sports nutrition market exhibits a moderately concentrated structure, with key players like PepsiCo Inc, Tiger Brands, and Abbott holding significant market share. However, smaller, specialized brands like Enduren Nutrition and MuscleSport are also making inroads, particularly in niche segments. Technological innovation, primarily in formulation and delivery systems, is a key driver, though regulatory hurdles and varying consumer preferences across the diverse MEA region present challenges. M&A activity has been moderate, with a projected xx number of deals in the historical period (2019-2024) and an anticipated xx increase in the forecast period (2025-2033), driven by market consolidation and expansion strategies. Competitive product substitutes, such as traditional energy sources and homemade nutritional blends, also pose a challenge.
- Market Concentration: Moderately concentrated, with top 5 players holding xx% market share in 2025.
- Technological Innovation: Focus on personalized nutrition, functional ingredients, and sustainable packaging.
- Regulatory Framework: Varies significantly across countries, creating compliance complexities.
- Competitive Substitutes: Traditional energy sources and homemade alternatives pose a threat.
- End-User Demographics: Growing young population and increasing health awareness are positive drivers.
- M&A Trends: xx M&A deals in 2019-2024, with a projected xx increase in 2025-2033.
MEA Sports Nutrition Industry Growth Trends & Insights
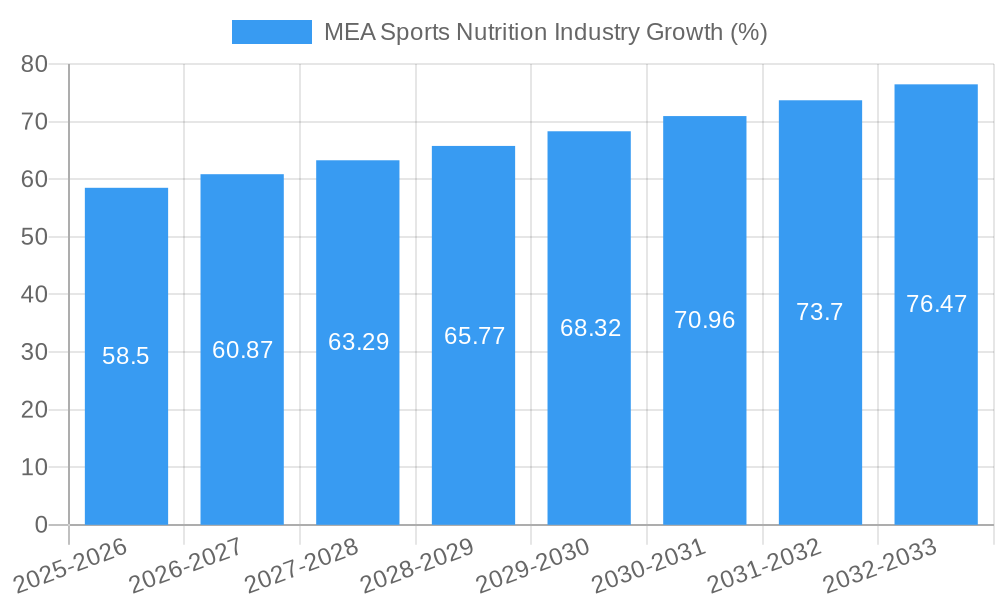
The MEA sports nutrition market is experiencing robust growth, fueled by rising health consciousness, increasing disposable incomes, and a burgeoning fitness culture, particularly amongst young adults. The historical period (2019-2024) witnessed a CAGR of xx%, with the market size reaching xx million units in 2024. This positive trend is projected to continue in the forecast period (2025-2033), with a projected CAGR of xx% and a market size of xx million units by 2033. Technological advancements, such as personalized nutrition plans based on genetic data, and the increasing availability of convenient online retail channels are further accelerating growth. Changing consumer preferences, shifting towards natural and organic products, also significantly impacts the market landscape.
Dominant Regions, Countries, or Segments in MEA Sports Nutrition Industry
The UAE and Saudi Arabia lead the MEA sports nutrition market, driven by high per capita income, substantial investment in sports infrastructure, and a strong focus on wellness. Within product segments, Sports Supplements represent the largest portion of the market in 2025, reaching xx million units, followed by Sports Drinks at xx million units and Sports Food at xx million units. Online stores are exhibiting the fastest growth amongst distribution channels, driven by increasing internet penetration and convenience.
- Leading Regions: UAE and Saudi Arabia account for over xx% of the total market.
- Dominant Segments: Sports Supplements command the largest market share (xx% in 2025).
- Fastest Growing Channel: Online stores show significant growth potential (xx% CAGR).
- Key Drivers: High disposable incomes, increasing health awareness, and improved retail infrastructure.
MEA Sports Nutrition Industry Product Landscape
The MEA sports nutrition market showcases diverse product offerings, encompassing protein powders, energy bars, sports drinks, and specialized supplements tailored to specific athletic needs. Innovations include advanced formulations with enhanced bioavailability, functional ingredients such as adaptogens and probiotics, and eco-friendly packaging. Companies are increasingly emphasizing natural, organic, and plant-based options to cater to evolving consumer preferences. Product differentiation focuses on unique selling propositions like enhanced flavor profiles, improved digestibility, and customized nutritional blends.
Key Drivers, Barriers & Challenges in MEA Sports Nutrition Industry
Key Drivers:
- Rising health awareness and fitness culture.
- Growing disposable incomes and urbanization.
- Increasing popularity of various sports and fitness activities.
- Government initiatives promoting health and wellness.
Challenges & Restraints:
- Stringent regulatory requirements impacting product approvals.
- Counterfeit products impacting consumer confidence.
- Fluctuations in raw material prices.
- Supply chain disruptions and logistical challenges.
Emerging Opportunities in MEA Sports Nutrition Industry
The MEA sports nutrition market presents significant untapped potential in smaller markets within the region. There are opportunities to introduce specialized products catering to niche fitness segments (e.g., endurance sports, yoga) and expanding into rural areas with rising access to online retail. Furthermore, increasing demand for plant-based and organic options presents an opportunity for innovation.
Growth Accelerators in the MEA Sports Nutrition Industry
Strategic partnerships with fitness centers and influencers, combined with targeted digital marketing campaigns, are key growth catalysts. Moreover, technological advancements like personalized nutrition plans and smart wearables that integrate with nutritional data, promise to further accelerate market expansion. Expansion into untapped markets and the strategic development of customized product lines for specific demographic segments are further key growth accelerators.
Key Players Shaping the MEA Sports Nutrition Industry Market
- PepsiCo Inc
- Tiger Brands
- Adcock Ingram
- Abbott
- Ascendis Health
- The Coca-Cola Company
- MuscleSport
- Enduren Nutrition
Notable Milestones in MEA Sports Nutrition Industry Sector
- 2021: PepsiCo launches a new line of sports drinks in the UAE.
- 2022: Tiger Brands acquires a local sports nutrition company in South Africa.
- 2023: Abbott introduces personalized nutrition plans using genetic testing.
- 2024: Several new online-only sports nutrition brands enter the market.
In-Depth MEA Sports Nutrition Industry Market Outlook
The MEA sports nutrition market is poised for sustained growth in the coming years, driven by the convergence of increased health consciousness, technological innovation, and expanding distribution channels. Strategic investments in product development, targeted marketing, and the cultivation of strong brand equity will be crucial for companies to capitalize on the abundant market opportunities. The market’s long-term potential is significant, particularly as health and wellness become increasingly prioritized across the MEA region.
MEA Sports Nutrition Industry Segmentation
-
1. Type
- 1.1. Sports Food
- 1.2. Sports Drink
- 1.3. Sports Supplements
-
2. Distribution Channel
- 2.1. Supermarkets/Hypermarkets
- 2.2. Convenience Stores
- 2.3. Specialty Stores
- 2.4. Online Stores
- 2.5. Others
MEA Sports Nutrition Industry Segmentation By Geography
-
1. North America
- 1.1. United States
- 1.2. Canada
- 1.3. Mexico
-
2. South America
- 2.1. Brazil
- 2.2. Argentina
- 2.3. Rest of South America
-
3. Europe
- 3.1. United Kingdom
- 3.2. Germany
- 3.3. France
- 3.4. Italy
- 3.5. Spain
- 3.6. Russia
- 3.7. Benelux
- 3.8. Nordics
- 3.9. Rest of Europe
-
4. Middle East & Africa
- 4.1. Turkey
- 4.2. Israel
- 4.3. GCC
- 4.4. North Africa
- 4.5. South Africa
- 4.6. Rest of Middle East & Africa
-
5. Asia Pacific
- 5.1. China
- 5.2. India
- 5.3. Japan
- 5.4. South Korea
- 5.5. ASEAN
- 5.6. Oceania
- 5.7. Rest of Asia Pacific
MEA Sports Nutrition Industry REPORT HIGHLIGHTS
| Aspects | Details |
|---|---|
| Study Period | 2019-2033 |
| Base Year | 2024 |
| Estimated Year | 2025 |
| Forecast Period | 2025-2033 |
| Historical Period | 2019-2024 |
| Growth Rate | CAGR of 3.90% from 2019-2033 |
| Segmentation |
|
Table of Contents
- 1. Introduction
- 1.1. Research Scope
- 1.2. Market Segmentation
- 1.3. Research Methodology
- 1.4. Definitions and Assumptions
- 2. Executive Summary
- 2.1. Introduction
- 3. Market Dynamics
- 3.1. Introduction
- 3.2. Market Drivers
- 3.2.1. Rising health consciousness and a focus on fitness and well-being drive demand for sports nutrition products
- 3.3. Market Restrains
- 3.3.1. Availability of alternative dietary supplements and functional foods may divert consumer interest
- 3.4. Market Trends
- 3.4.1. Increasing Number of Health and Fitness Centers
- 4. Market Factor Analysis
- 4.1. Porters Five Forces
- 4.2. Supply/Value Chain
- 4.3. PESTEL analysis
- 4.4. Market Entropy
- 4.5. Patent/Trademark Analysis
- 5. Global MEA Sports Nutrition Industry Analysis, Insights and Forecast, 2019-2031
- 5.1. Market Analysis, Insights and Forecast - by Type
- 5.1.1. Sports Food
- 5.1.2. Sports Drink
- 5.1.3. Sports Supplements
- 5.2. Market Analysis, Insights and Forecast - by Distribution Channel
- 5.2.1. Supermarkets/Hypermarkets
- 5.2.2. Convenience Stores
- 5.2.3. Specialty Stores
- 5.2.4. Online Stores
- 5.2.5. Others
- 5.3. Market Analysis, Insights and Forecast - by Region
- 5.3.1. North America
- 5.3.2. South America
- 5.3.3. Europe
- 5.3.4. Middle East & Africa
- 5.3.5. Asia Pacific
- 5.1. Market Analysis, Insights and Forecast - by Type
- 6. North America MEA Sports Nutrition Industry Analysis, Insights and Forecast, 2019-2031
- 6.1. Market Analysis, Insights and Forecast - by Type
- 6.1.1. Sports Food
- 6.1.2. Sports Drink
- 6.1.3. Sports Supplements
- 6.2. Market Analysis, Insights and Forecast - by Distribution Channel
- 6.2.1. Supermarkets/Hypermarkets
- 6.2.2. Convenience Stores
- 6.2.3. Specialty Stores
- 6.2.4. Online Stores
- 6.2.5. Others
- 6.1. Market Analysis, Insights and Forecast - by Type
- 7. South America MEA Sports Nutrition Industry Analysis, Insights and Forecast, 2019-2031
- 7.1. Market Analysis, Insights and Forecast - by Type
- 7.1.1. Sports Food
- 7.1.2. Sports Drink
- 7.1.3. Sports Supplements
- 7.2. Market Analysis, Insights and Forecast - by Distribution Channel
- 7.2.1. Supermarkets/Hypermarkets
- 7.2.2. Convenience Stores
- 7.2.3. Specialty Stores
- 7.2.4. Online Stores
- 7.2.5. Others
- 7.1. Market Analysis, Insights and Forecast - by Type
- 8. Europe MEA Sports Nutrition Industry Analysis, Insights and Forecast, 2019-2031
- 8.1. Market Analysis, Insights and Forecast - by Type
- 8.1.1. Sports Food
- 8.1.2. Sports Drink
- 8.1.3. Sports Supplements
- 8.2. Market Analysis, Insights and Forecast - by Distribution Channel
- 8.2.1. Supermarkets/Hypermarkets
- 8.2.2. Convenience Stores
- 8.2.3. Specialty Stores
- 8.2.4. Online Stores
- 8.2.5. Others
- 8.1. Market Analysis, Insights and Forecast - by Type
- 9. Middle East & Africa MEA Sports Nutrition Industry Analysis, Insights and Forecast, 2019-2031
- 9.1. Market Analysis, Insights and Forecast - by Type
- 9.1.1. Sports Food
- 9.1.2. Sports Drink
- 9.1.3. Sports Supplements
- 9.2. Market Analysis, Insights and Forecast - by Distribution Channel
- 9.2.1. Supermarkets/Hypermarkets
- 9.2.2. Convenience Stores
- 9.2.3. Specialty Stores
- 9.2.4. Online Stores
- 9.2.5. Others
- 9.1. Market Analysis, Insights and Forecast - by Type
- 10. Asia Pacific MEA Sports Nutrition Industry Analysis, Insights and Forecast, 2019-2031
- 10.1. Market Analysis, Insights and Forecast - by Type
- 10.1.1. Sports Food
- 10.1.2. Sports Drink
- 10.1.3. Sports Supplements
- 10.2. Market Analysis, Insights and Forecast - by Distribution Channel
- 10.2.1. Supermarkets/Hypermarkets
- 10.2.2. Convenience Stores
- 10.2.3. Specialty Stores
- 10.2.4. Online Stores
- 10.2.5. Others
- 10.1. Market Analysis, Insights and Forecast - by Type
- 11. South Africa MEA Sports Nutrition Industry Analysis, Insights and Forecast, 2019-2031
- 12. Saudi Arabia MEA Sports Nutrition Industry Analysis, Insights and Forecast, 2019-2031
- 13. Rest of Middle East and Africa MEA Sports Nutrition Industry Analysis, Insights and Forecast, 2019-2031
- 14. Competitive Analysis
- 14.1. Global Market Share Analysis 2024
- 14.2. Company Profiles
- 14.2.1 Enduren Nutrition
- 14.2.1.1. Overview
- 14.2.1.2. Products
- 14.2.1.3. SWOT Analysis
- 14.2.1.4. Recent Developments
- 14.2.1.5. Financials (Based on Availability)
- 14.2.2 PepsiCo Inc
- 14.2.2.1. Overview
- 14.2.2.2. Products
- 14.2.2.3. SWOT Analysis
- 14.2.2.4. Recent Developments
- 14.2.2.5. Financials (Based on Availability)
- 14.2.3 Tiger Brands
- 14.2.3.1. Overview
- 14.2.3.2. Products
- 14.2.3.3. SWOT Analysis
- 14.2.3.4. Recent Developments
- 14.2.3.5. Financials (Based on Availability)
- 14.2.4 Adcock Ingram
- 14.2.4.1. Overview
- 14.2.4.2. Products
- 14.2.4.3. SWOT Analysis
- 14.2.4.4. Recent Developments
- 14.2.4.5. Financials (Based on Availability)
- 14.2.5 Enduren Nutrition
- 14.2.5.1. Overview
- 14.2.5.2. Products
- 14.2.5.3. SWOT Analysis
- 14.2.5.4. Recent Developments
- 14.2.5.5. Financials (Based on Availability)
- 14.2.6 Abbott
- 14.2.6.1. Overview
- 14.2.6.2. Products
- 14.2.6.3. SWOT Analysis
- 14.2.6.4. Recent Developments
- 14.2.6.5. Financials (Based on Availability)
- 14.2.7 Ascendis Health
- 14.2.7.1. Overview
- 14.2.7.2. Products
- 14.2.7.3. SWOT Analysis
- 14.2.7.4. Recent Developments
- 14.2.7.5. Financials (Based on Availability)
- 14.2.8 The Coca-Cola Company
- 14.2.8.1. Overview
- 14.2.8.2. Products
- 14.2.8.3. SWOT Analysis
- 14.2.8.4. Recent Developments
- 14.2.8.5. Financials (Based on Availability)
- 14.2.9 MuscleSport
- 14.2.9.1. Overview
- 14.2.9.2. Products
- 14.2.9.3. SWOT Analysis
- 14.2.9.4. Recent Developments
- 14.2.9.5. Financials (Based on Availability)
- 14.2.1 Enduren Nutrition
List of Figures
- Figure 1: Global MEA Sports Nutrition Industry Revenue Breakdown (Million, %) by Region 2024 & 2032
- Figure 2: Middle East and Africa MEA Sports Nutrition Industry Revenue (Million), by Country 2024 & 2032
- Figure 3: Middle East and Africa MEA Sports Nutrition Industry Revenue Share (%), by Country 2024 & 2032
- Figure 4: North America MEA Sports Nutrition Industry Revenue (Million), by Type 2024 & 2032
- Figure 5: North America MEA Sports Nutrition Industry Revenue Share (%), by Type 2024 & 2032
- Figure 6: North America MEA Sports Nutrition Industry Revenue (Million), by Distribution Channel 2024 & 2032
- Figure 7: North America MEA Sports Nutrition Industry Revenue Share (%), by Distribution Channel 2024 & 2032
- Figure 8: North America MEA Sports Nutrition Industry Revenue (Million), by Country 2024 & 2032
- Figure 9: North America MEA Sports Nutrition Industry Revenue Share (%), by Country 2024 & 2032
- Figure 10: South America MEA Sports Nutrition Industry Revenue (Million), by Type 2024 & 2032
- Figure 11: South America MEA Sports Nutrition Industry Revenue Share (%), by Type 2024 & 2032
- Figure 12: South America MEA Sports Nutrition Industry Revenue (Million), by Distribution Channel 2024 & 2032
- Figure 13: South America MEA Sports Nutrition Industry Revenue Share (%), by Distribution Channel 2024 & 2032
- Figure 14: South America MEA Sports Nutrition Industry Revenue (Million), by Country 2024 & 2032
- Figure 15: South America MEA Sports Nutrition Industry Revenue Share (%), by Country 2024 & 2032
- Figure 16: Europe MEA Sports Nutrition Industry Revenue (Million), by Type 2024 & 2032
- Figure 17: Europe MEA Sports Nutrition Industry Revenue Share (%), by Type 2024 & 2032
- Figure 18: Europe MEA Sports Nutrition Industry Revenue (Million), by Distribution Channel 2024 & 2032
- Figure 19: Europe MEA Sports Nutrition Industry Revenue Share (%), by Distribution Channel 2024 & 2032
- Figure 20: Europe MEA Sports Nutrition Industry Revenue (Million), by Country 2024 & 2032
- Figure 21: Europe MEA Sports Nutrition Industry Revenue Share (%), by Country 2024 & 2032
- Figure 22: Middle East & Africa MEA Sports Nutrition Industry Revenue (Million), by Type 2024 & 2032
- Figure 23: Middle East & Africa MEA Sports Nutrition Industry Revenue Share (%), by Type 2024 & 2032
- Figure 24: Middle East & Africa MEA Sports Nutrition Industry Revenue (Million), by Distribution Channel 2024 & 2032
- Figure 25: Middle East & Africa MEA Sports Nutrition Industry Revenue Share (%), by Distribution Channel 2024 & 2032
- Figure 26: Middle East & Africa MEA Sports Nutrition Industry Revenue (Million), by Country 2024 & 2032
- Figure 27: Middle East & Africa MEA Sports Nutrition Industry Revenue Share (%), by Country 2024 & 2032
- Figure 28: Asia Pacific MEA Sports Nutrition Industry Revenue (Million), by Type 2024 & 2032
- Figure 29: Asia Pacific MEA Sports Nutrition Industry Revenue Share (%), by Type 2024 & 2032
- Figure 30: Asia Pacific MEA Sports Nutrition Industry Revenue (Million), by Distribution Channel 2024 & 2032
- Figure 31: Asia Pacific MEA Sports Nutrition Industry Revenue Share (%), by Distribution Channel 2024 & 2032
- Figure 32: Asia Pacific MEA Sports Nutrition Industry Revenue (Million), by Country 2024 & 2032
- Figure 33: Asia Pacific MEA Sports Nutrition Industry Revenue Share (%), by Country 2024 & 2032
List of Tables
- Table 1: Global MEA Sports Nutrition Industry Revenue Million Forecast, by Region 2019 & 2032
- Table 2: Global MEA Sports Nutrition Industry Revenue Million Forecast, by Type 2019 & 2032
- Table 3: Global MEA Sports Nutrition Industry Revenue Million Forecast, by Distribution Channel 2019 & 2032
- Table 4: Global MEA Sports Nutrition Industry Revenue Million Forecast, by Region 2019 & 2032
- Table 5: Global MEA Sports Nutrition Industry Revenue Million Forecast, by Country 2019 & 2032
- Table 6: South Africa MEA Sports Nutrition Industry Revenue (Million) Forecast, by Application 2019 & 2032
- Table 7: Saudi Arabia MEA Sports Nutrition Industry Revenue (Million) Forecast, by Application 2019 & 2032
- Table 8: Rest of Middle East and Africa MEA Sports Nutrition Industry Revenue (Million) Forecast, by Application 2019 & 2032
- Table 9: Global MEA Sports Nutrition Industry Revenue Million Forecast, by Type 2019 & 2032
- Table 10: Global MEA Sports Nutrition Industry Revenue Million Forecast, by Distribution Channel 2019 & 2032
- Table 11: Global MEA Sports Nutrition Industry Revenue Million Forecast, by Country 2019 & 2032
- Table 12: United States MEA Sports Nutrition Industry Revenue (Million) Forecast, by Application 2019 & 2032
- Table 13: Canada MEA Sports Nutrition Industry Revenue (Million) Forecast, by Application 2019 & 2032
- Table 14: Mexico MEA Sports Nutrition Industry Revenue (Million) Forecast, by Application 2019 & 2032
- Table 15: Global MEA Sports Nutrition Industry Revenue Million Forecast, by Type 2019 & 2032
- Table 16: Global MEA Sports Nutrition Industry Revenue Million Forecast, by Distribution Channel 2019 & 2032
- Table 17: Global MEA Sports Nutrition Industry Revenue Million Forecast, by Country 2019 & 2032
- Table 18: Brazil MEA Sports Nutrition Industry Revenue (Million) Forecast, by Application 2019 & 2032
- Table 19: Argentina MEA Sports Nutrition Industry Revenue (Million) Forecast, by Application 2019 & 2032
- Table 20: Rest of South America MEA Sports Nutrition Industry Revenue (Million) Forecast, by Application 2019 & 2032
- Table 21: Global MEA Sports Nutrition Industry Revenue Million Forecast, by Type 2019 & 2032
- Table 22: Global MEA Sports Nutrition Industry Revenue Million Forecast, by Distribution Channel 2019 & 2032
- Table 23: Global MEA Sports Nutrition Industry Revenue Million Forecast, by Country 2019 & 2032
- Table 24: United Kingdom MEA Sports Nutrition Industry Revenue (Million) Forecast, by Application 2019 & 2032
- Table 25: Germany MEA Sports Nutrition Industry Revenue (Million) Forecast, by Application 2019 & 2032
- Table 26: France MEA Sports Nutrition Industry Revenue (Million) Forecast, by Application 2019 & 2032
- Table 27: Italy MEA Sports Nutrition Industry Revenue (Million) Forecast, by Application 2019 & 2032
- Table 28: Spain MEA Sports Nutrition Industry Revenue (Million) Forecast, by Application 2019 & 2032
- Table 29: Russia MEA Sports Nutrition Industry Revenue (Million) Forecast, by Application 2019 & 2032
- Table 30: Benelux MEA Sports Nutrition Industry Revenue (Million) Forecast, by Application 2019 & 2032
- Table 31: Nordics MEA Sports Nutrition Industry Revenue (Million) Forecast, by Application 2019 & 2032
- Table 32: Rest of Europe MEA Sports Nutrition Industry Revenue (Million) Forecast, by Application 2019 & 2032
- Table 33: Global MEA Sports Nutrition Industry Revenue Million Forecast, by Type 2019 & 2032
- Table 34: Global MEA Sports Nutrition Industry Revenue Million Forecast, by Distribution Channel 2019 & 2032
- Table 35: Global MEA Sports Nutrition Industry Revenue Million Forecast, by Country 2019 & 2032
- Table 36: Turkey MEA Sports Nutrition Industry Revenue (Million) Forecast, by Application 2019 & 2032
- Table 37: Israel MEA Sports Nutrition Industry Revenue (Million) Forecast, by Application 2019 & 2032
- Table 38: GCC MEA Sports Nutrition Industry Revenue (Million) Forecast, by Application 2019 & 2032
- Table 39: North Africa MEA Sports Nutrition Industry Revenue (Million) Forecast, by Application 2019 & 2032
- Table 40: South Africa MEA Sports Nutrition Industry Revenue (Million) Forecast, by Application 2019 & 2032
- Table 41: Rest of Middle East & Africa MEA Sports Nutrition Industry Revenue (Million) Forecast, by Application 2019 & 2032
- Table 42: Global MEA Sports Nutrition Industry Revenue Million Forecast, by Type 2019 & 2032
- Table 43: Global MEA Sports Nutrition Industry Revenue Million Forecast, by Distribution Channel 2019 & 2032
- Table 44: Global MEA Sports Nutrition Industry Revenue Million Forecast, by Country 2019 & 2032
- Table 45: China MEA Sports Nutrition Industry Revenue (Million) Forecast, by Application 2019 & 2032
- Table 46: India MEA Sports Nutrition Industry Revenue (Million) Forecast, by Application 2019 & 2032
- Table 47: Japan MEA Sports Nutrition Industry Revenue (Million) Forecast, by Application 2019 & 2032
- Table 48: South Korea MEA Sports Nutrition Industry Revenue (Million) Forecast, by Application 2019 & 2032
- Table 49: ASEAN MEA Sports Nutrition Industry Revenue (Million) Forecast, by Application 2019 & 2032
- Table 50: Oceania MEA Sports Nutrition Industry Revenue (Million) Forecast, by Application 2019 & 2032
- Table 51: Rest of Asia Pacific MEA Sports Nutrition Industry Revenue (Million) Forecast, by Application 2019 & 2032
Frequently Asked Questions
1. What is the projected Compound Annual Growth Rate (CAGR) of the MEA Sports Nutrition Industry?
The projected CAGR is approximately 3.90%.
2. Which companies are prominent players in the MEA Sports Nutrition Industry?
Key companies in the market include Enduren Nutrition, PepsiCo Inc, Tiger Brands, Adcock Ingram, Enduren Nutrition, Abbott, Ascendis Health, The Coca-Cola Company, MuscleSport.
3. What are the main segments of the MEA Sports Nutrition Industry?
The market segments include Type, Distribution Channel.
4. Can you provide details about the market size?
The market size is estimated to be USD XX Million as of 2022.
5. What are some drivers contributing to market growth?
Rising health consciousness and a focus on fitness and well-being drive demand for sports nutrition products.
6. What are the notable trends driving market growth?
Increasing Number of Health and Fitness Centers.
7. Are there any restraints impacting market growth?
Availability of alternative dietary supplements and functional foods may divert consumer interest.
8. Can you provide examples of recent developments in the market?
N/A
9. What pricing options are available for accessing the report?
Pricing options include single-user, multi-user, and enterprise licenses priced at USD 3800, USD 4500, and USD 5800 respectively.
10. Is the market size provided in terms of value or volume?
The market size is provided in terms of value, measured in Million.
11. Are there any specific market keywords associated with the report?
Yes, the market keyword associated with the report is "MEA Sports Nutrition Industry," which aids in identifying and referencing the specific market segment covered.
12. How do I determine which pricing option suits my needs best?
The pricing options vary based on user requirements and access needs. Individual users may opt for single-user licenses, while businesses requiring broader access may choose multi-user or enterprise licenses for cost-effective access to the report.
13. Are there any additional resources or data provided in the MEA Sports Nutrition Industry report?
While the report offers comprehensive insights, it's advisable to review the specific contents or supplementary materials provided to ascertain if additional resources or data are available.
14. How can I stay updated on further developments or reports in the MEA Sports Nutrition Industry?
To stay informed about further developments, trends, and reports in the MEA Sports Nutrition Industry, consider subscribing to industry newsletters, following relevant companies and organizations, or regularly checking reputable industry news sources and publications.
Methodology
Step 1 - Identification of Relevant Samples Size from Population Database


Step 2 - Approaches for Defining Global Market Size (Value, Volume* & Price*)

Note*: In applicable scenarios
Step 3 - Data Sources
Primary Research
- Web Analytics
- Survey Reports
- Research Institute
- Latest Research Reports
- Opinion Leaders
Secondary Research
- Annual Reports
- White Paper
- Latest Press Release
- Industry Association
- Paid Database
- Investor Presentations

Step 4 - Data Triangulation
Involves using different sources of information in order to increase the validity of a study
These sources are likely to be stakeholders in a program - participants, other researchers, program staff, other community members, and so on.
Then we put all data in single framework & apply various statistical tools to find out the dynamic on the market.
During the analysis stage, feedback from the stakeholder groups would be compared to determine areas of agreement as well as areas of divergence


