
Key Insights
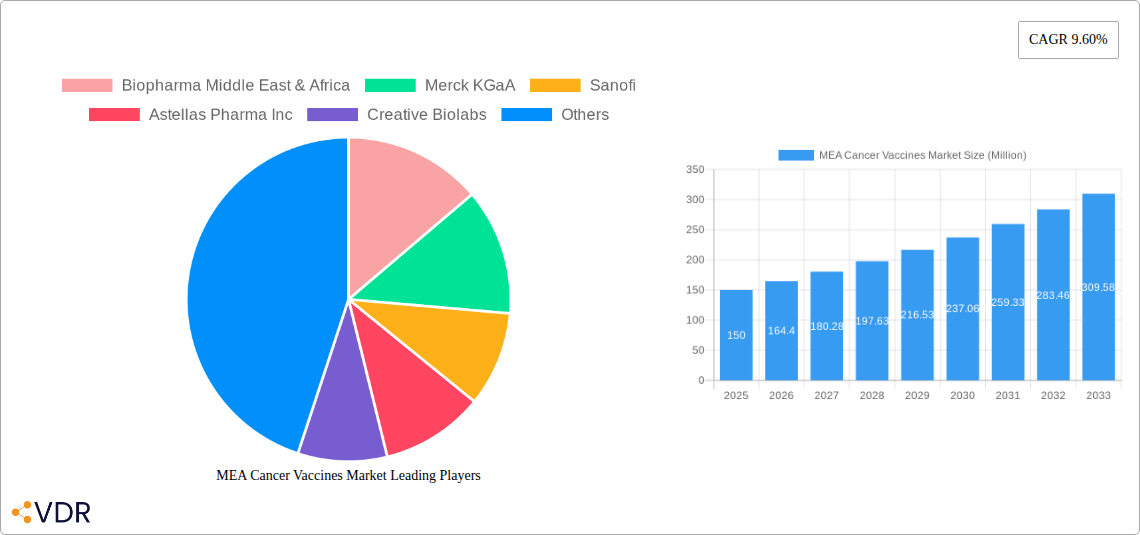
The Middle East and Africa (MEA) cancer vaccines market is poised for significant growth, driven by rising cancer incidence rates, increasing awareness of preventive healthcare, and growing investments in healthcare infrastructure across the region. The market's Compound Annual Growth Rate (CAGR) of 9.60% from 2019 to 2024 suggests a robust trajectory, projected to continue through 2033. Key drivers include a burgeoning pharmaceutical industry, government initiatives to improve cancer treatment access, and a growing adoption of advanced vaccination technologies. The segment breakdown reveals a strong focus on therapeutic vaccines, reflecting a growing demand for treatments beyond prevention. Prostate and cervical cancers represent substantial application segments, aligning with the region's prevalent cancer types. Leading players like Biopharma Middle East & Africa, Merck KGaA, and Sanofi are actively contributing to market expansion through research, development, and commercialization efforts. However, challenges remain, including limited healthcare access in certain regions, high treatment costs, and a need for increased public awareness campaigns to promote vaccine uptake.
The forecast period (2025-2033) will likely witness continued expansion fueled by several factors. Technological advancements in recombinant, whole-cell, and viral vector vaccines are expected to lead to more effective and targeted therapies. Furthermore, increased collaborations between pharmaceutical companies and research institutions will accelerate the development and approval of new cancer vaccines specifically tailored to the prevalent cancer types within the MEA region. Expansion into underserved areas and targeted public health initiatives will further contribute to market growth. While challenges related to affordability and accessibility need to be addressed, the long-term outlook for the MEA cancer vaccines market remains positive, presenting significant opportunities for both established and emerging players.
MEA Cancer Vaccines Market: A Comprehensive Market Report (2019-2033)
This comprehensive report provides a detailed analysis of the Middle East and Africa (MEA) cancer vaccines market, offering invaluable insights for industry professionals, investors, and researchers. The report covers the period 2019-2033, with a focus on the forecast period 2025-2033, and uses 2025 as the base year. The market is segmented by technology (Recombinant Cancer Vaccines, Whole-cell Cancer Vaccines, Viral Vector and DNA Cancer Vaccines, Other Technologies), treatment method (Preventive Vaccine, Therapeutic Vaccine), and application (Prostate Cancer, Cervical Cancer, Other Applications). The total market value is projected to reach xx Million units by 2033.
MEA Cancer Vaccines Market Dynamics & Structure
The MEA cancer vaccines market is characterized by a relatively fragmented landscape, with several multinational pharmaceutical companies and regional players competing for market share. Market concentration is moderate, with the top 5 players holding an estimated xx% market share in 2025. Technological innovation is a key driver, with significant investments in developing novel vaccine technologies such as mRNA and viral vector-based vaccines. However, regulatory frameworks vary across the MEA region, creating challenges for market entry and product approval. Competitive product substitutes, such as conventional cancer therapies, pose a significant challenge. The end-user demographics are largely influenced by the prevalence of specific cancers and access to healthcare. M&A activity in the sector remains moderate, with an estimated xx deals recorded in the historical period (2019-2024).
- Market Concentration: Moderate, top 5 players holding approximately xx% market share in 2025.
- Technological Innovation: Driven by mRNA and viral vector-based vaccines; barriers include high R&D costs and regulatory hurdles.
- Regulatory Frameworks: Vary across MEA, impacting market entry and product approval.
- Competitive Substitutes: Conventional cancer therapies pose significant competition.
- End-User Demographics: Influenced by cancer prevalence and access to healthcare.
- M&A Activity: Moderate, with xx deals recorded between 2019-2024.
MEA Cancer Vaccines Market Growth Trends & Insights
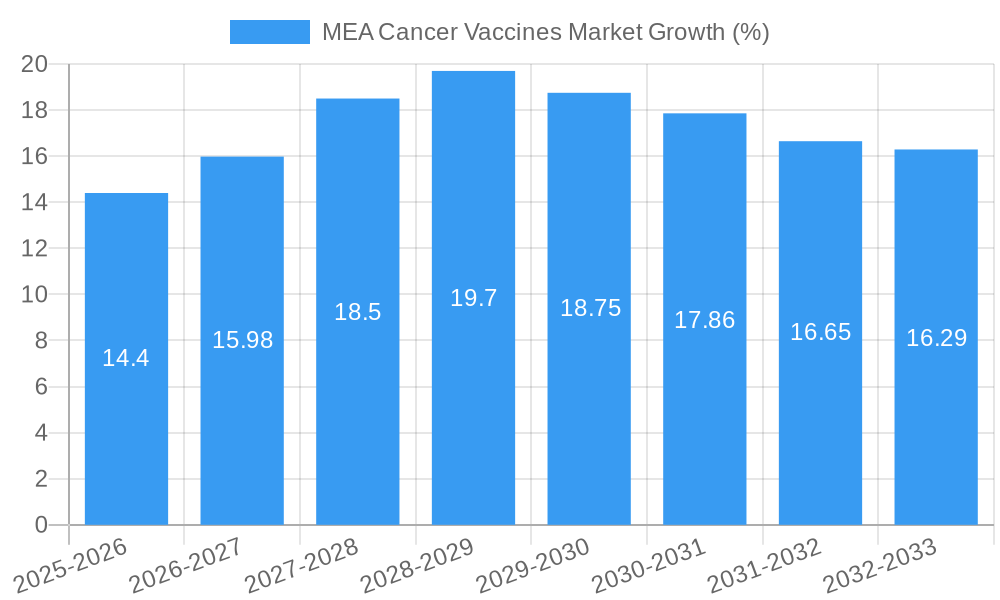
The MEA cancer vaccines market is experiencing significant growth, driven by rising cancer incidence rates, increasing awareness of cancer prevention and treatment, and growing investments in healthcare infrastructure. The market size is projected to witness a Compound Annual Growth Rate (CAGR) of xx% during the forecast period (2025-2033), expanding from xx Million units in 2025 to xx Million units by 2033. This growth is fueled by technological advancements leading to more effective and targeted vaccines, along with increased government initiatives and public-private partnerships to improve cancer care across the region. Consumer behavior is shifting towards a greater preference for preventive healthcare measures, boosting demand for cancer vaccines. Market penetration of cancer vaccines remains relatively low, indicating significant untapped potential for future growth. Technological disruptions, such as personalized medicine approaches and the development of multivalent vaccines, are poised to further accelerate market expansion.
Dominant Regions, Countries, or Segments in MEA Cancer Vaccines Market
While data specifics for precise regional dominance are unavailable (xx), South Africa and the Gulf Cooperation Council (GCC) countries are anticipated to be leading regions, driven by higher healthcare spending, advanced healthcare infrastructure, and a growing prevalence of specific cancers such as cervical and prostate cancer. Within the segment breakdown:
- Technology: Recombinant cancer vaccines are expected to dominate due to their higher efficacy and safety profiles.
- Treatment Method: Therapeutic vaccines are projected to hold a larger market share compared to preventive vaccines due to the high prevalence of existing cancer cases.
- Application: Prostate and cervical cancers represent significant application segments, given their high incidence rates in the region.
Key drivers include supportive government policies promoting healthcare infrastructure development and increased investments in cancer research and development. Market share and growth potential will vary based on several factors, including healthcare infrastructure, regulatory environment, and public awareness.
MEA Cancer Vaccines Market Product Landscape
The MEA cancer vaccines market showcases a diverse product landscape, featuring various technologies, such as recombinant, whole-cell, viral vector, and DNA vaccines. These vaccines target a range of cancers, with notable advancements in personalized cancer vaccines and combination therapies. Unique selling propositions focus on enhanced efficacy, improved safety profiles, and targeted delivery mechanisms. Technological advancements include improved antigen design, advanced adjuvants, and novel delivery systems.
Key Drivers, Barriers & Challenges in MEA Cancer Vaccines Market
Key Drivers:
- Rising cancer incidence rates.
- Increasing healthcare expenditure and investments in oncology.
- Growing awareness of cancer prevention and early detection.
- Technological advancements in vaccine development.
Challenges & Restraints:
- High cost of cancer vaccines limiting accessibility.
- Limited healthcare infrastructure in certain regions.
- Stringent regulatory approvals and processes.
- Lack of awareness about cancer vaccines in some populations.
- Competition from other cancer treatment modalities.
Emerging Opportunities in MEA Cancer Vaccines Market
Emerging opportunities include the development and commercialization of personalized cancer vaccines, expansion into underserved markets, and focus on innovative vaccine delivery systems. Untapped markets exist in rural and less-developed areas of the MEA region. Evolving consumer preferences toward preventive healthcare measures create opportunities for proactive cancer prevention strategies.
Growth Accelerators in the MEA Cancer Vaccines Market Industry
Long-term growth will be accelerated by technological breakthroughs in vaccine design and delivery, strategic partnerships between pharmaceutical companies and research institutions, and expansion into new markets through collaborations with local healthcare providers and government agencies. Investments in research and development to overcome challenges associated with efficacy and cost-effectiveness will be crucial for sustained growth.
Key Players Shaping the MEA Cancer Vaccines Market Market
- Biopharma Middle East & Africa
- Merck KGaA
- Sanofi
- Astellas Pharma Inc
- Creative Biolabs
- AstraZeneca PLC
- Pfizer
- GSK
- Bristol-Myers Squibb
- Dendreon
Notable Milestones in MEA Cancer Vaccines Market Sector
- December 2022: The Cancer Moonshot initiative announced over USD 300 million in funding to improve cancer outcomes in Africa, significantly boosting the development and access to cancer vaccines.
- April 2022: Dante Labs partnered with the Abu Dhabi Stem Cells Center to develop mRNA cancer vaccines, showcasing the growing interest in personalized cancer vaccines within the MEA region.
In-Depth MEA Cancer Vaccines Market Market Outlook
The MEA cancer vaccines market holds substantial future potential, driven by increasing cancer prevalence, growing investments in healthcare infrastructure, and technological advancements. Strategic partnerships, focused R&D, and expansion into underserved markets will be key to capitalizing on this potential. The market's long-term success hinges on addressing challenges related to cost, accessibility, and regulatory hurdles.
MEA Cancer Vaccines Market Segmentation
-
1. Technology
- 1.1. Recombinant Cancer Vaccines
- 1.2. Whole-cell Cancer Vaccines
- 1.3. Viral Vector and DNA Cancer Vaccines
- 1.4. Other Technologies
-
2. Treatment Method
- 2.1. Preventive Vaccine
- 2.2. Therapeutic Vaccine
-
3. Application
- 3.1. Prostate Cancer
- 3.2. Cervical Cancer
- 3.3. Other Applications
-
4. Geography
- 4.1. GCC
- 4.2. South Africa
- 4.3. Rest of Middle East and Africa
MEA Cancer Vaccines Market Segmentation By Geography
- 1. GCC
- 2. South Africa
- 3. Rest of Middle East and Africa
MEA Cancer Vaccines Market REPORT HIGHLIGHTS
| Aspects | Details |
|---|---|
| Study Period | 2019-2033 |
| Base Year | 2024 |
| Estimated Year | 2025 |
| Forecast Period | 2025-2033 |
| Historical Period | 2019-2024 |
| Growth Rate | CAGR of 9.60% from 2019-2033 |
| Segmentation |
|
Table of Contents
- 1. Introduction
- 1.1. Research Scope
- 1.2. Market Segmentation
- 1.3. Research Methodology
- 1.4. Definitions and Assumptions
- 2. Executive Summary
- 2.1. Introduction
- 3. Market Dynamics
- 3.1. Introduction
- 3.2. Market Drivers
- 3.2.1. Increasing Number of Cancer Cases; Rise in Research and Developments in Cancer Vaccines
- 3.3. Market Restrains
- 3.3.1. Presence of Alternative Therapies
- 3.4. Market Trends
- 3.4.1. Cervical Cancer Segment is Expected to Witness a Significant Growth in the Market Over the Forecast Period
- 4. Market Factor Analysis
- 4.1. Porters Five Forces
- 4.2. Supply/Value Chain
- 4.3. PESTEL analysis
- 4.4. Market Entropy
- 4.5. Patent/Trademark Analysis
- 5. Global MEA Cancer Vaccines Market Analysis, Insights and Forecast, 2019-2031
- 5.1. Market Analysis, Insights and Forecast - by Technology
- 5.1.1. Recombinant Cancer Vaccines
- 5.1.2. Whole-cell Cancer Vaccines
- 5.1.3. Viral Vector and DNA Cancer Vaccines
- 5.1.4. Other Technologies
- 5.2. Market Analysis, Insights and Forecast - by Treatment Method
- 5.2.1. Preventive Vaccine
- 5.2.2. Therapeutic Vaccine
- 5.3. Market Analysis, Insights and Forecast - by Application
- 5.3.1. Prostate Cancer
- 5.3.2. Cervical Cancer
- 5.3.3. Other Applications
- 5.4. Market Analysis, Insights and Forecast - by Geography
- 5.4.1. GCC
- 5.4.2. South Africa
- 5.4.3. Rest of Middle East and Africa
- 5.5. Market Analysis, Insights and Forecast - by Region
- 5.5.1. GCC
- 5.5.2. South Africa
- 5.5.3. Rest of Middle East and Africa
- 5.1. Market Analysis, Insights and Forecast - by Technology
- 6. GCC MEA Cancer Vaccines Market Analysis, Insights and Forecast, 2019-2031
- 6.1. Market Analysis, Insights and Forecast - by Technology
- 6.1.1. Recombinant Cancer Vaccines
- 6.1.2. Whole-cell Cancer Vaccines
- 6.1.3. Viral Vector and DNA Cancer Vaccines
- 6.1.4. Other Technologies
- 6.2. Market Analysis, Insights and Forecast - by Treatment Method
- 6.2.1. Preventive Vaccine
- 6.2.2. Therapeutic Vaccine
- 6.3. Market Analysis, Insights and Forecast - by Application
- 6.3.1. Prostate Cancer
- 6.3.2. Cervical Cancer
- 6.3.3. Other Applications
- 6.4. Market Analysis, Insights and Forecast - by Geography
- 6.4.1. GCC
- 6.4.2. South Africa
- 6.4.3. Rest of Middle East and Africa
- 6.1. Market Analysis, Insights and Forecast - by Technology
- 7. South Africa MEA Cancer Vaccines Market Analysis, Insights and Forecast, 2019-2031
- 7.1. Market Analysis, Insights and Forecast - by Technology
- 7.1.1. Recombinant Cancer Vaccines
- 7.1.2. Whole-cell Cancer Vaccines
- 7.1.3. Viral Vector and DNA Cancer Vaccines
- 7.1.4. Other Technologies
- 7.2. Market Analysis, Insights and Forecast - by Treatment Method
- 7.2.1. Preventive Vaccine
- 7.2.2. Therapeutic Vaccine
- 7.3. Market Analysis, Insights and Forecast - by Application
- 7.3.1. Prostate Cancer
- 7.3.2. Cervical Cancer
- 7.3.3. Other Applications
- 7.4. Market Analysis, Insights and Forecast - by Geography
- 7.4.1. GCC
- 7.4.2. South Africa
- 7.4.3. Rest of Middle East and Africa
- 7.1. Market Analysis, Insights and Forecast - by Technology
- 8. Rest of Middle East and Africa MEA Cancer Vaccines Market Analysis, Insights and Forecast, 2019-2031
- 8.1. Market Analysis, Insights and Forecast - by Technology
- 8.1.1. Recombinant Cancer Vaccines
- 8.1.2. Whole-cell Cancer Vaccines
- 8.1.3. Viral Vector and DNA Cancer Vaccines
- 8.1.4. Other Technologies
- 8.2. Market Analysis, Insights and Forecast - by Treatment Method
- 8.2.1. Preventive Vaccine
- 8.2.2. Therapeutic Vaccine
- 8.3. Market Analysis, Insights and Forecast - by Application
- 8.3.1. Prostate Cancer
- 8.3.2. Cervical Cancer
- 8.3.3. Other Applications
- 8.4. Market Analysis, Insights and Forecast - by Geography
- 8.4.1. GCC
- 8.4.2. South Africa
- 8.4.3. Rest of Middle East and Africa
- 8.1. Market Analysis, Insights and Forecast - by Technology
- 9. North America MEA Cancer Vaccines Market Analysis, Insights and Forecast, 2019-2031
- 9.1. Market Analysis, Insights and Forecast - By Country/Sub-region
- 9.1.1. undefined
- 10. Europe MEA Cancer Vaccines Market Analysis, Insights and Forecast, 2019-2031
- 10.1. Market Analysis, Insights and Forecast - By Country/Sub-region
- 10.1.1. undefined
- 11. Asia Pacific MEA Cancer Vaccines Market Analysis, Insights and Forecast, 2019-2031
- 11.1. Market Analysis, Insights and Forecast - By Country/Sub-region
- 11.1.1. undefined
- 12. South America MEA Cancer Vaccines Market Analysis, Insights and Forecast, 2019-2031
- 12.1. Market Analysis, Insights and Forecast - By Country/Sub-region
- 12.1.1. undefined
- 13. North America MEA Cancer Vaccines Market Analysis, Insights and Forecast, 2019-2031
- 13.1. Market Analysis, Insights and Forecast - By Country/Sub-region
- 13.1.1. undefined
- 14. MEA MEA Cancer Vaccines Market Analysis, Insights and Forecast, 2019-2031
- 14.1. Market Analysis, Insights and Forecast - By Country/Sub-region
- 14.1.1. undefined
- 15. Competitive Analysis
- 15.1. Global Market Share Analysis 2024
- 15.2. Company Profiles
- 15.2.1 Biopharma Middle East & Africa
- 15.2.1.1. Overview
- 15.2.1.2. Products
- 15.2.1.3. SWOT Analysis
- 15.2.1.4. Recent Developments
- 15.2.1.5. Financials (Based on Availability)
- 15.2.2 Merck KGaA
- 15.2.2.1. Overview
- 15.2.2.2. Products
- 15.2.2.3. SWOT Analysis
- 15.2.2.4. Recent Developments
- 15.2.2.5. Financials (Based on Availability)
- 15.2.3 Sanofi
- 15.2.3.1. Overview
- 15.2.3.2. Products
- 15.2.3.3. SWOT Analysis
- 15.2.3.4. Recent Developments
- 15.2.3.5. Financials (Based on Availability)
- 15.2.4 Astellas Pharma Inc
- 15.2.4.1. Overview
- 15.2.4.2. Products
- 15.2.4.3. SWOT Analysis
- 15.2.4.4. Recent Developments
- 15.2.4.5. Financials (Based on Availability)
- 15.2.5 Creative Biolabs
- 15.2.5.1. Overview
- 15.2.5.2. Products
- 15.2.5.3. SWOT Analysis
- 15.2.5.4. Recent Developments
- 15.2.5.5. Financials (Based on Availability)
- 15.2.6 AstraZeneca PLC
- 15.2.6.1. Overview
- 15.2.6.2. Products
- 15.2.6.3. SWOT Analysis
- 15.2.6.4. Recent Developments
- 15.2.6.5. Financials (Based on Availability)
- 15.2.7 Pfizer
- 15.2.7.1. Overview
- 15.2.7.2. Products
- 15.2.7.3. SWOT Analysis
- 15.2.7.4. Recent Developments
- 15.2.7.5. Financials (Based on Availability)
- 15.2.8 GSK
- 15.2.8.1. Overview
- 15.2.8.2. Products
- 15.2.8.3. SWOT Analysis
- 15.2.8.4. Recent Developments
- 15.2.8.5. Financials (Based on Availability)
- 15.2.9 Bristol-Myers Squibb
- 15.2.9.1. Overview
- 15.2.9.2. Products
- 15.2.9.3. SWOT Analysis
- 15.2.9.4. Recent Developments
- 15.2.9.5. Financials (Based on Availability)
- 15.2.10 Dendreon
- 15.2.10.1. Overview
- 15.2.10.2. Products
- 15.2.10.3. SWOT Analysis
- 15.2.10.4. Recent Developments
- 15.2.10.5. Financials (Based on Availability)
- 15.2.1 Biopharma Middle East & Africa
List of Figures
- Figure 1: Global MEA Cancer Vaccines Market Revenue Breakdown (Million, %) by Region 2024 & 2032
- Figure 2: Global MEA Cancer Vaccines Market Volume Breakdown (K Unit, %) by Region 2024 & 2032
- Figure 3: North America MEA Cancer Vaccines Market Revenue (Million), by Country 2024 & 2032
- Figure 4: North America MEA Cancer Vaccines Market Volume (K Unit), by Country 2024 & 2032
- Figure 5: North America MEA Cancer Vaccines Market Revenue Share (%), by Country 2024 & 2032
- Figure 6: North America MEA Cancer Vaccines Market Volume Share (%), by Country 2024 & 2032
- Figure 7: Europe MEA Cancer Vaccines Market Revenue (Million), by Country 2024 & 2032
- Figure 8: Europe MEA Cancer Vaccines Market Volume (K Unit), by Country 2024 & 2032
- Figure 9: Europe MEA Cancer Vaccines Market Revenue Share (%), by Country 2024 & 2032
- Figure 10: Europe MEA Cancer Vaccines Market Volume Share (%), by Country 2024 & 2032
- Figure 11: Asia Pacific MEA Cancer Vaccines Market Revenue (Million), by Country 2024 & 2032
- Figure 12: Asia Pacific MEA Cancer Vaccines Market Volume (K Unit), by Country 2024 & 2032
- Figure 13: Asia Pacific MEA Cancer Vaccines Market Revenue Share (%), by Country 2024 & 2032
- Figure 14: Asia Pacific MEA Cancer Vaccines Market Volume Share (%), by Country 2024 & 2032
- Figure 15: South America MEA Cancer Vaccines Market Revenue (Million), by Country 2024 & 2032
- Figure 16: South America MEA Cancer Vaccines Market Volume (K Unit), by Country 2024 & 2032
- Figure 17: South America MEA Cancer Vaccines Market Revenue Share (%), by Country 2024 & 2032
- Figure 18: South America MEA Cancer Vaccines Market Volume Share (%), by Country 2024 & 2032
- Figure 19: North America MEA Cancer Vaccines Market Revenue (Million), by Country 2024 & 2032
- Figure 20: North America MEA Cancer Vaccines Market Volume (K Unit), by Country 2024 & 2032
- Figure 21: North America MEA Cancer Vaccines Market Revenue Share (%), by Country 2024 & 2032
- Figure 22: North America MEA Cancer Vaccines Market Volume Share (%), by Country 2024 & 2032
- Figure 23: MEA MEA Cancer Vaccines Market Revenue (Million), by Country 2024 & 2032
- Figure 24: MEA MEA Cancer Vaccines Market Volume (K Unit), by Country 2024 & 2032
- Figure 25: MEA MEA Cancer Vaccines Market Revenue Share (%), by Country 2024 & 2032
- Figure 26: MEA MEA Cancer Vaccines Market Volume Share (%), by Country 2024 & 2032
- Figure 27: GCC MEA Cancer Vaccines Market Revenue (Million), by Technology 2024 & 2032
- Figure 28: GCC MEA Cancer Vaccines Market Volume (K Unit), by Technology 2024 & 2032
- Figure 29: GCC MEA Cancer Vaccines Market Revenue Share (%), by Technology 2024 & 2032
- Figure 30: GCC MEA Cancer Vaccines Market Volume Share (%), by Technology 2024 & 2032
- Figure 31: GCC MEA Cancer Vaccines Market Revenue (Million), by Treatment Method 2024 & 2032
- Figure 32: GCC MEA Cancer Vaccines Market Volume (K Unit), by Treatment Method 2024 & 2032
- Figure 33: GCC MEA Cancer Vaccines Market Revenue Share (%), by Treatment Method 2024 & 2032
- Figure 34: GCC MEA Cancer Vaccines Market Volume Share (%), by Treatment Method 2024 & 2032
- Figure 35: GCC MEA Cancer Vaccines Market Revenue (Million), by Application 2024 & 2032
- Figure 36: GCC MEA Cancer Vaccines Market Volume (K Unit), by Application 2024 & 2032
- Figure 37: GCC MEA Cancer Vaccines Market Revenue Share (%), by Application 2024 & 2032
- Figure 38: GCC MEA Cancer Vaccines Market Volume Share (%), by Application 2024 & 2032
- Figure 39: GCC MEA Cancer Vaccines Market Revenue (Million), by Geography 2024 & 2032
- Figure 40: GCC MEA Cancer Vaccines Market Volume (K Unit), by Geography 2024 & 2032
- Figure 41: GCC MEA Cancer Vaccines Market Revenue Share (%), by Geography 2024 & 2032
- Figure 42: GCC MEA Cancer Vaccines Market Volume Share (%), by Geography 2024 & 2032
- Figure 43: GCC MEA Cancer Vaccines Market Revenue (Million), by Country 2024 & 2032
- Figure 44: GCC MEA Cancer Vaccines Market Volume (K Unit), by Country 2024 & 2032
- Figure 45: GCC MEA Cancer Vaccines Market Revenue Share (%), by Country 2024 & 2032
- Figure 46: GCC MEA Cancer Vaccines Market Volume Share (%), by Country 2024 & 2032
- Figure 47: South Africa MEA Cancer Vaccines Market Revenue (Million), by Technology 2024 & 2032
- Figure 48: South Africa MEA Cancer Vaccines Market Volume (K Unit), by Technology 2024 & 2032
- Figure 49: South Africa MEA Cancer Vaccines Market Revenue Share (%), by Technology 2024 & 2032
- Figure 50: South Africa MEA Cancer Vaccines Market Volume Share (%), by Technology 2024 & 2032
- Figure 51: South Africa MEA Cancer Vaccines Market Revenue (Million), by Treatment Method 2024 & 2032
- Figure 52: South Africa MEA Cancer Vaccines Market Volume (K Unit), by Treatment Method 2024 & 2032
- Figure 53: South Africa MEA Cancer Vaccines Market Revenue Share (%), by Treatment Method 2024 & 2032
- Figure 54: South Africa MEA Cancer Vaccines Market Volume Share (%), by Treatment Method 2024 & 2032
- Figure 55: South Africa MEA Cancer Vaccines Market Revenue (Million), by Application 2024 & 2032
- Figure 56: South Africa MEA Cancer Vaccines Market Volume (K Unit), by Application 2024 & 2032
- Figure 57: South Africa MEA Cancer Vaccines Market Revenue Share (%), by Application 2024 & 2032
- Figure 58: South Africa MEA Cancer Vaccines Market Volume Share (%), by Application 2024 & 2032
- Figure 59: South Africa MEA Cancer Vaccines Market Revenue (Million), by Geography 2024 & 2032
- Figure 60: South Africa MEA Cancer Vaccines Market Volume (K Unit), by Geography 2024 & 2032
- Figure 61: South Africa MEA Cancer Vaccines Market Revenue Share (%), by Geography 2024 & 2032
- Figure 62: South Africa MEA Cancer Vaccines Market Volume Share (%), by Geography 2024 & 2032
- Figure 63: South Africa MEA Cancer Vaccines Market Revenue (Million), by Country 2024 & 2032
- Figure 64: South Africa MEA Cancer Vaccines Market Volume (K Unit), by Country 2024 & 2032
- Figure 65: South Africa MEA Cancer Vaccines Market Revenue Share (%), by Country 2024 & 2032
- Figure 66: South Africa MEA Cancer Vaccines Market Volume Share (%), by Country 2024 & 2032
- Figure 67: Rest of Middle East and Africa MEA Cancer Vaccines Market Revenue (Million), by Technology 2024 & 2032
- Figure 68: Rest of Middle East and Africa MEA Cancer Vaccines Market Volume (K Unit), by Technology 2024 & 2032
- Figure 69: Rest of Middle East and Africa MEA Cancer Vaccines Market Revenue Share (%), by Technology 2024 & 2032
- Figure 70: Rest of Middle East and Africa MEA Cancer Vaccines Market Volume Share (%), by Technology 2024 & 2032
- Figure 71: Rest of Middle East and Africa MEA Cancer Vaccines Market Revenue (Million), by Treatment Method 2024 & 2032
- Figure 72: Rest of Middle East and Africa MEA Cancer Vaccines Market Volume (K Unit), by Treatment Method 2024 & 2032
- Figure 73: Rest of Middle East and Africa MEA Cancer Vaccines Market Revenue Share (%), by Treatment Method 2024 & 2032
- Figure 74: Rest of Middle East and Africa MEA Cancer Vaccines Market Volume Share (%), by Treatment Method 2024 & 2032
- Figure 75: Rest of Middle East and Africa MEA Cancer Vaccines Market Revenue (Million), by Application 2024 & 2032
- Figure 76: Rest of Middle East and Africa MEA Cancer Vaccines Market Volume (K Unit), by Application 2024 & 2032
- Figure 77: Rest of Middle East and Africa MEA Cancer Vaccines Market Revenue Share (%), by Application 2024 & 2032
- Figure 78: Rest of Middle East and Africa MEA Cancer Vaccines Market Volume Share (%), by Application 2024 & 2032
- Figure 79: Rest of Middle East and Africa MEA Cancer Vaccines Market Revenue (Million), by Geography 2024 & 2032
- Figure 80: Rest of Middle East and Africa MEA Cancer Vaccines Market Volume (K Unit), by Geography 2024 & 2032
- Figure 81: Rest of Middle East and Africa MEA Cancer Vaccines Market Revenue Share (%), by Geography 2024 & 2032
- Figure 82: Rest of Middle East and Africa MEA Cancer Vaccines Market Volume Share (%), by Geography 2024 & 2032
- Figure 83: Rest of Middle East and Africa MEA Cancer Vaccines Market Revenue (Million), by Country 2024 & 2032
- Figure 84: Rest of Middle East and Africa MEA Cancer Vaccines Market Volume (K Unit), by Country 2024 & 2032
- Figure 85: Rest of Middle East and Africa MEA Cancer Vaccines Market Revenue Share (%), by Country 2024 & 2032
- Figure 86: Rest of Middle East and Africa MEA Cancer Vaccines Market Volume Share (%), by Country 2024 & 2032
List of Tables
- Table 1: Global MEA Cancer Vaccines Market Revenue Million Forecast, by Region 2019 & 2032
- Table 2: Global MEA Cancer Vaccines Market Volume K Unit Forecast, by Region 2019 & 2032
- Table 3: Global MEA Cancer Vaccines Market Revenue Million Forecast, by Technology 2019 & 2032
- Table 4: Global MEA Cancer Vaccines Market Volume K Unit Forecast, by Technology 2019 & 2032
- Table 5: Global MEA Cancer Vaccines Market Revenue Million Forecast, by Treatment Method 2019 & 2032
- Table 6: Global MEA Cancer Vaccines Market Volume K Unit Forecast, by Treatment Method 2019 & 2032
- Table 7: Global MEA Cancer Vaccines Market Revenue Million Forecast, by Application 2019 & 2032
- Table 8: Global MEA Cancer Vaccines Market Volume K Unit Forecast, by Application 2019 & 2032
- Table 9: Global MEA Cancer Vaccines Market Revenue Million Forecast, by Geography 2019 & 2032
- Table 10: Global MEA Cancer Vaccines Market Volume K Unit Forecast, by Geography 2019 & 2032
- Table 11: Global MEA Cancer Vaccines Market Revenue Million Forecast, by Region 2019 & 2032
- Table 12: Global MEA Cancer Vaccines Market Volume K Unit Forecast, by Region 2019 & 2032
- Table 13: Global MEA Cancer Vaccines Market Revenue Million Forecast, by Country 2019 & 2032
- Table 14: Global MEA Cancer Vaccines Market Volume K Unit Forecast, by Country 2019 & 2032
- Table 15: Global MEA Cancer Vaccines Market Revenue Million Forecast, by Country 2019 & 2032
- Table 16: Global MEA Cancer Vaccines Market Volume K Unit Forecast, by Country 2019 & 2032
- Table 17: Global MEA Cancer Vaccines Market Revenue Million Forecast, by Country 2019 & 2032
- Table 18: Global MEA Cancer Vaccines Market Volume K Unit Forecast, by Country 2019 & 2032
- Table 19: Global MEA Cancer Vaccines Market Revenue Million Forecast, by Country 2019 & 2032
- Table 20: Global MEA Cancer Vaccines Market Volume K Unit Forecast, by Country 2019 & 2032
- Table 21: Global MEA Cancer Vaccines Market Revenue Million Forecast, by Country 2019 & 2032
- Table 22: Global MEA Cancer Vaccines Market Volume K Unit Forecast, by Country 2019 & 2032
- Table 23: Global MEA Cancer Vaccines Market Revenue Million Forecast, by Country 2019 & 2032
- Table 24: Global MEA Cancer Vaccines Market Volume K Unit Forecast, by Country 2019 & 2032
- Table 25: Global MEA Cancer Vaccines Market Revenue Million Forecast, by Technology 2019 & 2032
- Table 26: Global MEA Cancer Vaccines Market Volume K Unit Forecast, by Technology 2019 & 2032
- Table 27: Global MEA Cancer Vaccines Market Revenue Million Forecast, by Treatment Method 2019 & 2032
- Table 28: Global MEA Cancer Vaccines Market Volume K Unit Forecast, by Treatment Method 2019 & 2032
- Table 29: Global MEA Cancer Vaccines Market Revenue Million Forecast, by Application 2019 & 2032
- Table 30: Global MEA Cancer Vaccines Market Volume K Unit Forecast, by Application 2019 & 2032
- Table 31: Global MEA Cancer Vaccines Market Revenue Million Forecast, by Geography 2019 & 2032
- Table 32: Global MEA Cancer Vaccines Market Volume K Unit Forecast, by Geography 2019 & 2032
- Table 33: Global MEA Cancer Vaccines Market Revenue Million Forecast, by Country 2019 & 2032
- Table 34: Global MEA Cancer Vaccines Market Volume K Unit Forecast, by Country 2019 & 2032
- Table 35: Global MEA Cancer Vaccines Market Revenue Million Forecast, by Technology 2019 & 2032
- Table 36: Global MEA Cancer Vaccines Market Volume K Unit Forecast, by Technology 2019 & 2032
- Table 37: Global MEA Cancer Vaccines Market Revenue Million Forecast, by Treatment Method 2019 & 2032
- Table 38: Global MEA Cancer Vaccines Market Volume K Unit Forecast, by Treatment Method 2019 & 2032
- Table 39: Global MEA Cancer Vaccines Market Revenue Million Forecast, by Application 2019 & 2032
- Table 40: Global MEA Cancer Vaccines Market Volume K Unit Forecast, by Application 2019 & 2032
- Table 41: Global MEA Cancer Vaccines Market Revenue Million Forecast, by Geography 2019 & 2032
- Table 42: Global MEA Cancer Vaccines Market Volume K Unit Forecast, by Geography 2019 & 2032
- Table 43: Global MEA Cancer Vaccines Market Revenue Million Forecast, by Country 2019 & 2032
- Table 44: Global MEA Cancer Vaccines Market Volume K Unit Forecast, by Country 2019 & 2032
- Table 45: Global MEA Cancer Vaccines Market Revenue Million Forecast, by Technology 2019 & 2032
- Table 46: Global MEA Cancer Vaccines Market Volume K Unit Forecast, by Technology 2019 & 2032
- Table 47: Global MEA Cancer Vaccines Market Revenue Million Forecast, by Treatment Method 2019 & 2032
- Table 48: Global MEA Cancer Vaccines Market Volume K Unit Forecast, by Treatment Method 2019 & 2032
- Table 49: Global MEA Cancer Vaccines Market Revenue Million Forecast, by Application 2019 & 2032
- Table 50: Global MEA Cancer Vaccines Market Volume K Unit Forecast, by Application 2019 & 2032
- Table 51: Global MEA Cancer Vaccines Market Revenue Million Forecast, by Geography 2019 & 2032
- Table 52: Global MEA Cancer Vaccines Market Volume K Unit Forecast, by Geography 2019 & 2032
- Table 53: Global MEA Cancer Vaccines Market Revenue Million Forecast, by Country 2019 & 2032
- Table 54: Global MEA Cancer Vaccines Market Volume K Unit Forecast, by Country 2019 & 2032
Frequently Asked Questions
1. What is the projected Compound Annual Growth Rate (CAGR) of the MEA Cancer Vaccines Market?
The projected CAGR is approximately 9.60%.
2. Which companies are prominent players in the MEA Cancer Vaccines Market?
Key companies in the market include Biopharma Middle East & Africa, Merck KGaA, Sanofi, Astellas Pharma Inc, Creative Biolabs, AstraZeneca PLC, Pfizer, GSK, Bristol-Myers Squibb, Dendreon.
3. What are the main segments of the MEA Cancer Vaccines Market?
The market segments include Technology, Treatment Method, Application, Geography.
4. Can you provide details about the market size?
The market size is estimated to be USD XX Million as of 2022.
5. What are some drivers contributing to market growth?
Increasing Number of Cancer Cases; Rise in Research and Developments in Cancer Vaccines.
6. What are the notable trends driving market growth?
Cervical Cancer Segment is Expected to Witness a Significant Growth in the Market Over the Forecast Period.
7. Are there any restraints impacting market growth?
Presence of Alternative Therapies.
8. Can you provide examples of recent developments in the market?
December 2022: Cancer Moonshot publicized new actions aimed at reducing the cancer burden in Africa as part of the United States-Africa Leaders Summit. The Cancer Moonshot highlights bold deliverables and new announcements from U.S. departments and agencies and the private sector of over USD 300 million to drastically improve cancer outcomes in Africa.
9. What pricing options are available for accessing the report?
Pricing options include single-user, multi-user, and enterprise licenses priced at USD 4750, USD 5250, and USD 8750 respectively.
10. Is the market size provided in terms of value or volume?
The market size is provided in terms of value, measured in Million and volume, measured in K Unit.
11. Are there any specific market keywords associated with the report?
Yes, the market keyword associated with the report is "MEA Cancer Vaccines Market," which aids in identifying and referencing the specific market segment covered.
12. How do I determine which pricing option suits my needs best?
The pricing options vary based on user requirements and access needs. Individual users may opt for single-user licenses, while businesses requiring broader access may choose multi-user or enterprise licenses for cost-effective access to the report.
13. Are there any additional resources or data provided in the MEA Cancer Vaccines Market report?
While the report offers comprehensive insights, it's advisable to review the specific contents or supplementary materials provided to ascertain if additional resources or data are available.
14. How can I stay updated on further developments or reports in the MEA Cancer Vaccines Market?
To stay informed about further developments, trends, and reports in the MEA Cancer Vaccines Market, consider subscribing to industry newsletters, following relevant companies and organizations, or regularly checking reputable industry news sources and publications.
Methodology
Step 1 - Identification of Relevant Samples Size from Population Database


Step 2 - Approaches for Defining Global Market Size (Value, Volume* & Price*)

Note*: In applicable scenarios
Step 3 - Data Sources
Primary Research
- Web Analytics
- Survey Reports
- Research Institute
- Latest Research Reports
- Opinion Leaders
Secondary Research
- Annual Reports
- White Paper
- Latest Press Release
- Industry Association
- Paid Database
- Investor Presentations

Step 4 - Data Triangulation
Involves using different sources of information in order to increase the validity of a study
These sources are likely to be stakeholders in a program - participants, other researchers, program staff, other community members, and so on.
Then we put all data in single framework & apply various statistical tools to find out the dynamic on the market.
During the analysis stage, feedback from the stakeholder groups would be compared to determine areas of agreement as well as areas of divergence


