
Key Insights
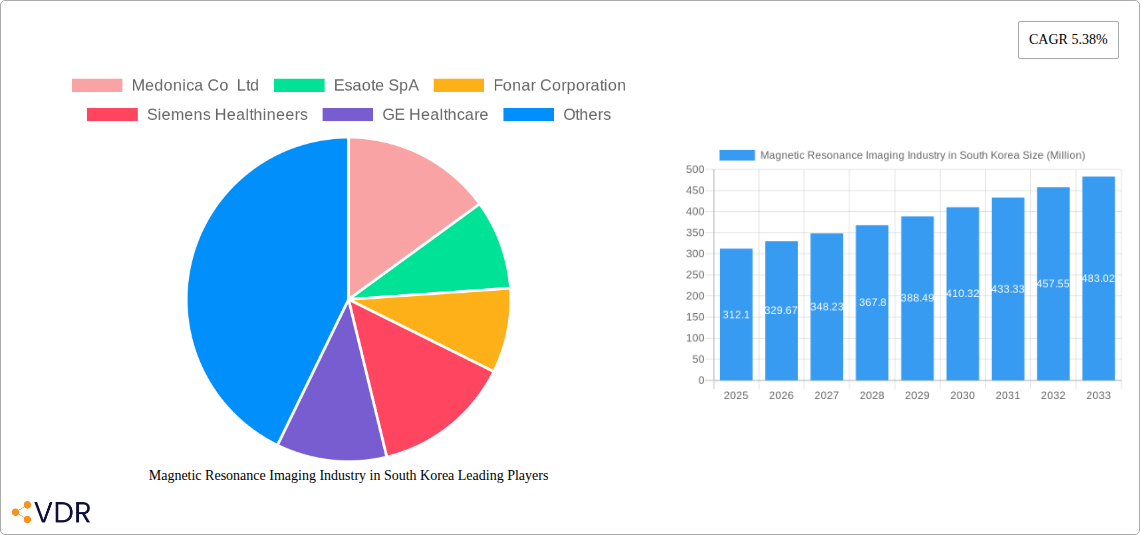
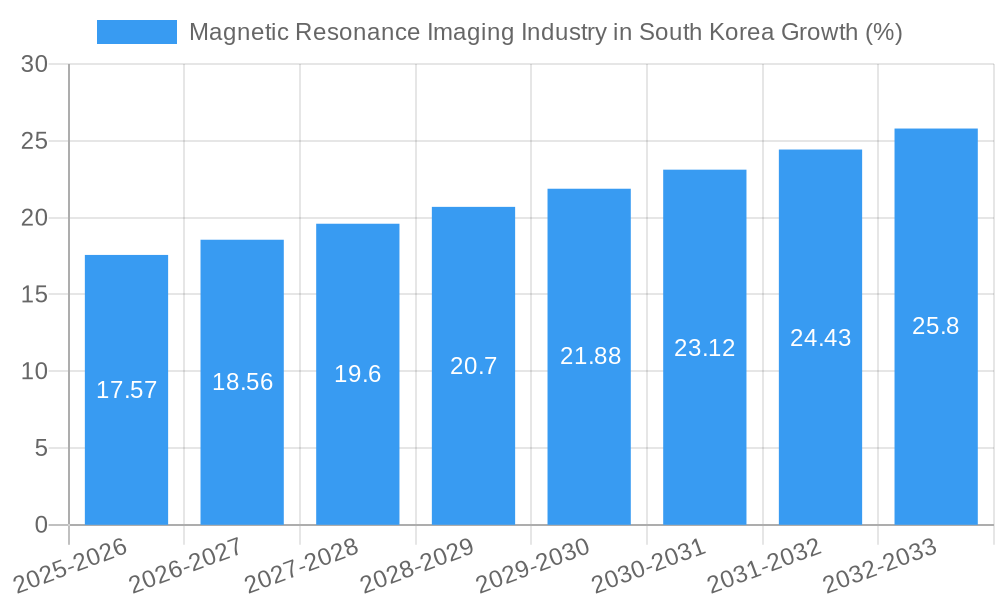
The South Korean Magnetic Resonance Imaging (MRI) market, valued at $312.10 million in 2025, is projected to experience robust growth, driven by factors such as increasing prevalence of chronic diseases necessitating advanced diagnostic tools, rising healthcare expenditure, and technological advancements in MRI systems. The market's Compound Annual Growth Rate (CAGR) of 5.38% from 2025 to 2033 indicates a substantial expansion. Key segments within the market include closed and open MRI systems, categorized further by field strength (low, high, very high, and ultra-high). Applications span various medical specializations, with oncology, neurology, cardiology, and musculoskeletal imaging leading the demand. The presence of established players like Siemens Healthineers, GE Healthcare, and Philips, alongside other significant domestic and international companies, contributes to market competitiveness and innovation. This competitive landscape fosters continuous improvement in image quality, speed of scans, and patient comfort, driving market expansion. Government initiatives promoting healthcare infrastructure development and advancements in medical technology also significantly impact market growth.
The continued expansion of the South Korean MRI market is anticipated to be fueled by several factors. The aging population, increasing prevalence of cancer and neurological disorders, and rising disposable incomes are key contributors to the escalating demand for advanced diagnostic imaging. Furthermore, the government's focus on strengthening healthcare infrastructure and promoting preventive healthcare measures will likely stimulate investments in MRI technology. The market segmentation, with high-field and ultra-high-field MRI systems capturing a significant share, points to a preference for high-resolution imaging capabilities. Ongoing research and development in areas such as artificial intelligence (AI)-powered image analysis and improved patient experience are further expected to shape the future trajectory of the market. Competition among established manufacturers is likely to persist, resulting in technological advancements and price competitiveness, further benefiting consumers and healthcare providers alike.
Magnetic Resonance Imaging (MRI) Industry in South Korea: 2019-2033 Market Report
This comprehensive report provides a detailed analysis of the Magnetic Resonance Imaging (MRI) industry in South Korea, covering the period 2019-2033. It offers invaluable insights for industry professionals, investors, and strategic decision-makers seeking to understand market dynamics, growth trends, and future opportunities within this rapidly evolving sector. The report leverages extensive primary and secondary research to deliver accurate market sizing and forecasts, incorporating granular segment analysis across architecture, field strength, and applications.
Magnetic Resonance Imaging Industry in South Korea Market Dynamics & Structure
The South Korean MRI market exhibits a moderately concentrated structure, with both international giants and domestic players vying for market share. Technological innovation, primarily driven by advancements in high-field strength systems and AI-powered image analysis, is a key driver. The regulatory landscape, while supportive of medical technology advancements, involves stringent approval processes. Competitive substitutes, such as CT scans and ultrasound, exert pressure on market growth. The end-user demographics are shifting towards an aging population, increasing demand for diagnostic imaging services. Recent M&A activity has been relatively modest, with a focus on strategic partnerships rather than large-scale acquisitions.
- Market Concentration: Moderately concentrated, with top 5 players holding approximately xx% of market share in 2024.
- Technological Innovation: Strong focus on high-field MRI systems and AI integration for improved image quality and diagnostic accuracy.
- Regulatory Framework: Stringent approval processes, but generally supportive of technological advancements.
- Competitive Substitutes: CT scans and ultrasound pose competitive pressure.
- End-User Demographics: Aging population fuels demand for diagnostic imaging services.
- M&A Trends: Relatively low M&A activity; strategic partnerships are more prevalent. Total M&A deal volume in 2019-2024: xx Million USD.
Magnetic Resonance Imaging Industry in South Korea Growth Trends & Insights
The South Korean MRI market witnessed robust growth between 2019 and 2024, driven by factors such as increasing healthcare expenditure, rising prevalence of chronic diseases, and government initiatives promoting healthcare infrastructure development. The market size expanded from xx Million USD in 2019 to xx Million USD in 2024, exhibiting a Compound Annual Growth Rate (CAGR) of xx%. Adoption rates have been particularly strong in urban areas, reflecting higher healthcare spending and greater accessibility to advanced medical technologies. Technological disruptions, such as the introduction of AI-powered image analysis tools and improvements in MRI system design, further enhanced market growth. Consumer behavior trends reveal a growing preference for faster, higher-resolution imaging, and minimally invasive procedures. Market penetration of MRI systems in South Korea is projected to reach xx% by 2033.
Dominant Regions, Countries, or Segments in Magnetic Resonance Imaging Industry in South Korea
Seoul and other major metropolitan areas dominate the South Korean MRI market, driven by higher concentrations of hospitals and specialized medical centers, advanced infrastructure and high healthcare spending. Among MRI system architectures, closed MRI systems hold the largest market share due to their superior image quality and versatility. High-field MRI systems (1.5T and 3T) are experiencing significant growth, driven by demand for enhanced image resolution and diagnostic capabilities. In terms of applications, oncology, neurology, and musculoskeletal imaging are major segments contributing to overall market growth.
- Key Regional Drivers: High concentration of hospitals and medical centers in Seoul and other major cities.
- Architectural Segment Dominance: Closed MRI systems hold the largest market share (xx%).
- Field Strength Trends: High-field MRI systems (1.5T and 3T) are experiencing the fastest growth.
- Application Segment Leaders: Oncology, neurology, and musculoskeletal imaging account for the largest market share (xx%).
Magnetic Resonance Imaging Industry in South Korea Product Landscape
The South Korean MRI market showcases a diverse range of products, encompassing advanced high-field systems with superior image quality and enhanced capabilities. Recent innovations include AI-powered image analysis software which automates image interpretation and facilitates faster diagnoses. Manufacturers are focusing on improving patient comfort through advanced coil designs and noise reduction technologies. Unique selling propositions emphasize speed, image resolution, and ease of use. Technological advancements in MRI continue to improve image clarity, reduce scan times, and expand the range of clinical applications.
Key Drivers, Barriers & Challenges in Magnetic Resonance Imaging Industry in South Korea
Key Drivers:
- Growing prevalence of chronic diseases requiring advanced diagnostic imaging.
- Increasing healthcare expenditure and government investments in healthcare infrastructure.
- Technological advancements resulting in improved image quality, speed, and patient comfort.
Key Challenges and Restraints:
- High cost of MRI systems and maintenance, limiting accessibility in some regions.
- Stringent regulatory requirements for equipment approval and clinical use.
- Competition from other medical imaging modalities (CT, ultrasound).
- xx% reduction in MRI system sales in 2023 due to supply chain disruptions.
Emerging Opportunities in Magnetic Resonance Imaging Industry in South Korea
Untapped markets exist in rural areas and smaller hospitals with limited access to advanced imaging technologies. Opportunities also exist in specialized applications, such as functional MRI (fMRI) for neurological research and advanced cardiac MRI for improved diagnosis. Growing demand for remote diagnostics and telemedicine will create new opportunities for cloud-based MRI image analysis and interpretation platforms.
Growth Accelerators in the Magnetic Resonance Imaging Industry in South Korea Industry
Technological breakthroughs in high-field MRI systems, AI-powered image analysis, and improved patient comfort features will be key growth drivers. Strategic partnerships between manufacturers and healthcare providers will play a vital role in expanding market access and fostering innovation. Government initiatives to promote healthcare infrastructure development will further stimulate market growth.
Key Players Shaping the Magnetic Resonance Imaging Industry in South Korea Market
- Medonica Co Ltd
- Esaote SpA
- Fonar Corporation
- Siemens Healthineers
- GE Healthcare
- Neusoft Medical Systems Co Ltd
- Koninklijke Philips NV
- Canon Medical Systems Corporation
- Fujifilm Holdings Corporation
Notable Milestones in Magnetic Resonance Imaging Industry in South Korea Sector
- August 2022: AIRS Medical secures USD 20 million in Series B funding.
- February 2021: Elektra launches its next-generation 1.5T MRI device, Unity, in South Korea.
In-Depth Magnetic Resonance Imaging Industry in South Korea Market Outlook
The South Korean MRI market is poised for continued growth throughout the forecast period (2025-2033), driven by technological advancements, increasing healthcare spending, and an aging population. Strategic partnerships and investments in healthcare infrastructure will further accelerate market expansion. The focus on high-field systems, AI integration, and improved patient experience will shape future market dynamics. Opportunities lie in expanding access to MRI technology in underserved areas and developing innovative applications tailored to specific clinical needs. The market is expected to reach xx Million USD by 2033.
Magnetic Resonance Imaging Industry in South Korea Segmentation
-
1. Architecture
- 1.1. Closed MRI Systems
- 1.2. Open MRI Systems
-
2. Field Strength
- 2.1. Low Field MRI Systems
- 2.2. High Field MRI Systems
- 2.3. Very Hig
-
3. Application
- 3.1. Oncology
- 3.2. Neurology
- 3.3. Cardiology
- 3.4. Gastroenterology
- 3.5. Musculoskeletal
- 3.6. Other Applications
Magnetic Resonance Imaging Industry in South Korea Segmentation By Geography
-
1. North America
- 1.1. United States
- 1.2. Canada
- 1.3. Mexico
-
2. South America
- 2.1. Brazil
- 2.2. Argentina
- 2.3. Rest of South America
-
3. Europe
- 3.1. United Kingdom
- 3.2. Germany
- 3.3. France
- 3.4. Italy
- 3.5. Spain
- 3.6. Russia
- 3.7. Benelux
- 3.8. Nordics
- 3.9. Rest of Europe
-
4. Middle East & Africa
- 4.1. Turkey
- 4.2. Israel
- 4.3. GCC
- 4.4. North Africa
- 4.5. South Africa
- 4.6. Rest of Middle East & Africa
-
5. Asia Pacific
- 5.1. China
- 5.2. India
- 5.3. Japan
- 5.4. South Korea
- 5.5. ASEAN
- 5.6. Oceania
- 5.7. Rest of Asia Pacific
Magnetic Resonance Imaging Industry in South Korea REPORT HIGHLIGHTS
| Aspects | Details |
|---|---|
| Study Period | 2019-2033 |
| Base Year | 2024 |
| Estimated Year | 2025 |
| Forecast Period | 2025-2033 |
| Historical Period | 2019-2024 |
| Growth Rate | CAGR of 5.38% from 2019-2033 |
| Segmentation |
|
Table of Contents
- 1. Introduction
- 1.1. Research Scope
- 1.2. Market Segmentation
- 1.3. Research Methodology
- 1.4. Definitions and Assumptions
- 2. Executive Summary
- 2.1. Introduction
- 3. Market Dynamics
- 3.1. Introduction
- 3.2. Market Drivers
- 3.2.1. Introduction of Hybrid MRI Systems; Increasing Prevalence of Chronic Diseases and Rising Geriatric Population
- 3.3. Market Restrains
- 3.3.1. High Cost of MRI Systems
- 3.4. Market Trends
- 3.4.1. High-Field MRI Systems are Expected to Witness Healthy Growth Over the Forecast Period
- 4. Market Factor Analysis
- 4.1. Porters Five Forces
- 4.2. Supply/Value Chain
- 4.3. PESTEL analysis
- 4.4. Market Entropy
- 4.5. Patent/Trademark Analysis
- 5. Global Magnetic Resonance Imaging Industry in South Korea Analysis, Insights and Forecast, 2019-2031
- 5.1. Market Analysis, Insights and Forecast - by Architecture
- 5.1.1. Closed MRI Systems
- 5.1.2. Open MRI Systems
- 5.2. Market Analysis, Insights and Forecast - by Field Strength
- 5.2.1. Low Field MRI Systems
- 5.2.2. High Field MRI Systems
- 5.2.3. Very Hig
- 5.3. Market Analysis, Insights and Forecast - by Application
- 5.3.1. Oncology
- 5.3.2. Neurology
- 5.3.3. Cardiology
- 5.3.4. Gastroenterology
- 5.3.5. Musculoskeletal
- 5.3.6. Other Applications
- 5.4. Market Analysis, Insights and Forecast - by Region
- 5.4.1. North America
- 5.4.2. South America
- 5.4.3. Europe
- 5.4.4. Middle East & Africa
- 5.4.5. Asia Pacific
- 5.1. Market Analysis, Insights and Forecast - by Architecture
- 6. North America Magnetic Resonance Imaging Industry in South Korea Analysis, Insights and Forecast, 2019-2031
- 6.1. Market Analysis, Insights and Forecast - by Architecture
- 6.1.1. Closed MRI Systems
- 6.1.2. Open MRI Systems
- 6.2. Market Analysis, Insights and Forecast - by Field Strength
- 6.2.1. Low Field MRI Systems
- 6.2.2. High Field MRI Systems
- 6.2.3. Very Hig
- 6.3. Market Analysis, Insights and Forecast - by Application
- 6.3.1. Oncology
- 6.3.2. Neurology
- 6.3.3. Cardiology
- 6.3.4. Gastroenterology
- 6.3.5. Musculoskeletal
- 6.3.6. Other Applications
- 6.1. Market Analysis, Insights and Forecast - by Architecture
- 7. South America Magnetic Resonance Imaging Industry in South Korea Analysis, Insights and Forecast, 2019-2031
- 7.1. Market Analysis, Insights and Forecast - by Architecture
- 7.1.1. Closed MRI Systems
- 7.1.2. Open MRI Systems
- 7.2. Market Analysis, Insights and Forecast - by Field Strength
- 7.2.1. Low Field MRI Systems
- 7.2.2. High Field MRI Systems
- 7.2.3. Very Hig
- 7.3. Market Analysis, Insights and Forecast - by Application
- 7.3.1. Oncology
- 7.3.2. Neurology
- 7.3.3. Cardiology
- 7.3.4. Gastroenterology
- 7.3.5. Musculoskeletal
- 7.3.6. Other Applications
- 7.1. Market Analysis, Insights and Forecast - by Architecture
- 8. Europe Magnetic Resonance Imaging Industry in South Korea Analysis, Insights and Forecast, 2019-2031
- 8.1. Market Analysis, Insights and Forecast - by Architecture
- 8.1.1. Closed MRI Systems
- 8.1.2. Open MRI Systems
- 8.2. Market Analysis, Insights and Forecast - by Field Strength
- 8.2.1. Low Field MRI Systems
- 8.2.2. High Field MRI Systems
- 8.2.3. Very Hig
- 8.3. Market Analysis, Insights and Forecast - by Application
- 8.3.1. Oncology
- 8.3.2. Neurology
- 8.3.3. Cardiology
- 8.3.4. Gastroenterology
- 8.3.5. Musculoskeletal
- 8.3.6. Other Applications
- 8.1. Market Analysis, Insights and Forecast - by Architecture
- 9. Middle East & Africa Magnetic Resonance Imaging Industry in South Korea Analysis, Insights and Forecast, 2019-2031
- 9.1. Market Analysis, Insights and Forecast - by Architecture
- 9.1.1. Closed MRI Systems
- 9.1.2. Open MRI Systems
- 9.2. Market Analysis, Insights and Forecast - by Field Strength
- 9.2.1. Low Field MRI Systems
- 9.2.2. High Field MRI Systems
- 9.2.3. Very Hig
- 9.3. Market Analysis, Insights and Forecast - by Application
- 9.3.1. Oncology
- 9.3.2. Neurology
- 9.3.3. Cardiology
- 9.3.4. Gastroenterology
- 9.3.5. Musculoskeletal
- 9.3.6. Other Applications
- 9.1. Market Analysis, Insights and Forecast - by Architecture
- 10. Asia Pacific Magnetic Resonance Imaging Industry in South Korea Analysis, Insights and Forecast, 2019-2031
- 10.1. Market Analysis, Insights and Forecast - by Architecture
- 10.1.1. Closed MRI Systems
- 10.1.2. Open MRI Systems
- 10.2. Market Analysis, Insights and Forecast - by Field Strength
- 10.2.1. Low Field MRI Systems
- 10.2.2. High Field MRI Systems
- 10.2.3. Very Hig
- 10.3. Market Analysis, Insights and Forecast - by Application
- 10.3.1. Oncology
- 10.3.2. Neurology
- 10.3.3. Cardiology
- 10.3.4. Gastroenterology
- 10.3.5. Musculoskeletal
- 10.3.6. Other Applications
- 10.1. Market Analysis, Insights and Forecast - by Architecture
- 11. Competitive Analysis
- 11.1. Global Market Share Analysis 2024
- 11.2. Company Profiles
- 11.2.1 Medonica Co Ltd
- 11.2.1.1. Overview
- 11.2.1.2. Products
- 11.2.1.3. SWOT Analysis
- 11.2.1.4. Recent Developments
- 11.2.1.5. Financials (Based on Availability)
- 11.2.2 Esaote SpA
- 11.2.2.1. Overview
- 11.2.2.2. Products
- 11.2.2.3. SWOT Analysis
- 11.2.2.4. Recent Developments
- 11.2.2.5. Financials (Based on Availability)
- 11.2.3 Fonar Corporation
- 11.2.3.1. Overview
- 11.2.3.2. Products
- 11.2.3.3. SWOT Analysis
- 11.2.3.4. Recent Developments
- 11.2.3.5. Financials (Based on Availability)
- 11.2.4 Siemens Healthineers
- 11.2.4.1. Overview
- 11.2.4.2. Products
- 11.2.4.3. SWOT Analysis
- 11.2.4.4. Recent Developments
- 11.2.4.5. Financials (Based on Availability)
- 11.2.5 GE Healthcare
- 11.2.5.1. Overview
- 11.2.5.2. Products
- 11.2.5.3. SWOT Analysis
- 11.2.5.4. Recent Developments
- 11.2.5.5. Financials (Based on Availability)
- 11.2.6 Neusoft Medical Systems Co Ltd
- 11.2.6.1. Overview
- 11.2.6.2. Products
- 11.2.6.3. SWOT Analysis
- 11.2.6.4. Recent Developments
- 11.2.6.5. Financials (Based on Availability)
- 11.2.7 Koninklijke Philips NV
- 11.2.7.1. Overview
- 11.2.7.2. Products
- 11.2.7.3. SWOT Analysis
- 11.2.7.4. Recent Developments
- 11.2.7.5. Financials (Based on Availability)
- 11.2.8 Canon Medical Systems Corporation
- 11.2.8.1. Overview
- 11.2.8.2. Products
- 11.2.8.3. SWOT Analysis
- 11.2.8.4. Recent Developments
- 11.2.8.5. Financials (Based on Availability)
- 11.2.9 Fujifilm Holdings Corporation
- 11.2.9.1. Overview
- 11.2.9.2. Products
- 11.2.9.3. SWOT Analysis
- 11.2.9.4. Recent Developments
- 11.2.9.5. Financials (Based on Availability)
- 11.2.1 Medonica Co Ltd
List of Figures
- Figure 1: Global Magnetic Resonance Imaging Industry in South Korea Revenue Breakdown (Million, %) by Region 2024 & 2032
- Figure 2: South Korea Magnetic Resonance Imaging Industry in South Korea Revenue (Million), by Country 2024 & 2032
- Figure 3: South Korea Magnetic Resonance Imaging Industry in South Korea Revenue Share (%), by Country 2024 & 2032
- Figure 4: North America Magnetic Resonance Imaging Industry in South Korea Revenue (Million), by Architecture 2024 & 2032
- Figure 5: North America Magnetic Resonance Imaging Industry in South Korea Revenue Share (%), by Architecture 2024 & 2032
- Figure 6: North America Magnetic Resonance Imaging Industry in South Korea Revenue (Million), by Field Strength 2024 & 2032
- Figure 7: North America Magnetic Resonance Imaging Industry in South Korea Revenue Share (%), by Field Strength 2024 & 2032
- Figure 8: North America Magnetic Resonance Imaging Industry in South Korea Revenue (Million), by Application 2024 & 2032
- Figure 9: North America Magnetic Resonance Imaging Industry in South Korea Revenue Share (%), by Application 2024 & 2032
- Figure 10: North America Magnetic Resonance Imaging Industry in South Korea Revenue (Million), by Country 2024 & 2032
- Figure 11: North America Magnetic Resonance Imaging Industry in South Korea Revenue Share (%), by Country 2024 & 2032
- Figure 12: South America Magnetic Resonance Imaging Industry in South Korea Revenue (Million), by Architecture 2024 & 2032
- Figure 13: South America Magnetic Resonance Imaging Industry in South Korea Revenue Share (%), by Architecture 2024 & 2032
- Figure 14: South America Magnetic Resonance Imaging Industry in South Korea Revenue (Million), by Field Strength 2024 & 2032
- Figure 15: South America Magnetic Resonance Imaging Industry in South Korea Revenue Share (%), by Field Strength 2024 & 2032
- Figure 16: South America Magnetic Resonance Imaging Industry in South Korea Revenue (Million), by Application 2024 & 2032
- Figure 17: South America Magnetic Resonance Imaging Industry in South Korea Revenue Share (%), by Application 2024 & 2032
- Figure 18: South America Magnetic Resonance Imaging Industry in South Korea Revenue (Million), by Country 2024 & 2032
- Figure 19: South America Magnetic Resonance Imaging Industry in South Korea Revenue Share (%), by Country 2024 & 2032
- Figure 20: Europe Magnetic Resonance Imaging Industry in South Korea Revenue (Million), by Architecture 2024 & 2032
- Figure 21: Europe Magnetic Resonance Imaging Industry in South Korea Revenue Share (%), by Architecture 2024 & 2032
- Figure 22: Europe Magnetic Resonance Imaging Industry in South Korea Revenue (Million), by Field Strength 2024 & 2032
- Figure 23: Europe Magnetic Resonance Imaging Industry in South Korea Revenue Share (%), by Field Strength 2024 & 2032
- Figure 24: Europe Magnetic Resonance Imaging Industry in South Korea Revenue (Million), by Application 2024 & 2032
- Figure 25: Europe Magnetic Resonance Imaging Industry in South Korea Revenue Share (%), by Application 2024 & 2032
- Figure 26: Europe Magnetic Resonance Imaging Industry in South Korea Revenue (Million), by Country 2024 & 2032
- Figure 27: Europe Magnetic Resonance Imaging Industry in South Korea Revenue Share (%), by Country 2024 & 2032
- Figure 28: Middle East & Africa Magnetic Resonance Imaging Industry in South Korea Revenue (Million), by Architecture 2024 & 2032
- Figure 29: Middle East & Africa Magnetic Resonance Imaging Industry in South Korea Revenue Share (%), by Architecture 2024 & 2032
- Figure 30: Middle East & Africa Magnetic Resonance Imaging Industry in South Korea Revenue (Million), by Field Strength 2024 & 2032
- Figure 31: Middle East & Africa Magnetic Resonance Imaging Industry in South Korea Revenue Share (%), by Field Strength 2024 & 2032
- Figure 32: Middle East & Africa Magnetic Resonance Imaging Industry in South Korea Revenue (Million), by Application 2024 & 2032
- Figure 33: Middle East & Africa Magnetic Resonance Imaging Industry in South Korea Revenue Share (%), by Application 2024 & 2032
- Figure 34: Middle East & Africa Magnetic Resonance Imaging Industry in South Korea Revenue (Million), by Country 2024 & 2032
- Figure 35: Middle East & Africa Magnetic Resonance Imaging Industry in South Korea Revenue Share (%), by Country 2024 & 2032
- Figure 36: Asia Pacific Magnetic Resonance Imaging Industry in South Korea Revenue (Million), by Architecture 2024 & 2032
- Figure 37: Asia Pacific Magnetic Resonance Imaging Industry in South Korea Revenue Share (%), by Architecture 2024 & 2032
- Figure 38: Asia Pacific Magnetic Resonance Imaging Industry in South Korea Revenue (Million), by Field Strength 2024 & 2032
- Figure 39: Asia Pacific Magnetic Resonance Imaging Industry in South Korea Revenue Share (%), by Field Strength 2024 & 2032
- Figure 40: Asia Pacific Magnetic Resonance Imaging Industry in South Korea Revenue (Million), by Application 2024 & 2032
- Figure 41: Asia Pacific Magnetic Resonance Imaging Industry in South Korea Revenue Share (%), by Application 2024 & 2032
- Figure 42: Asia Pacific Magnetic Resonance Imaging Industry in South Korea Revenue (Million), by Country 2024 & 2032
- Figure 43: Asia Pacific Magnetic Resonance Imaging Industry in South Korea Revenue Share (%), by Country 2024 & 2032
List of Tables
- Table 1: Global Magnetic Resonance Imaging Industry in South Korea Revenue Million Forecast, by Region 2019 & 2032
- Table 2: Global Magnetic Resonance Imaging Industry in South Korea Revenue Million Forecast, by Architecture 2019 & 2032
- Table 3: Global Magnetic Resonance Imaging Industry in South Korea Revenue Million Forecast, by Field Strength 2019 & 2032
- Table 4: Global Magnetic Resonance Imaging Industry in South Korea Revenue Million Forecast, by Application 2019 & 2032
- Table 5: Global Magnetic Resonance Imaging Industry in South Korea Revenue Million Forecast, by Region 2019 & 2032
- Table 6: Global Magnetic Resonance Imaging Industry in South Korea Revenue Million Forecast, by Country 2019 & 2032
- Table 7: Global Magnetic Resonance Imaging Industry in South Korea Revenue Million Forecast, by Architecture 2019 & 2032
- Table 8: Global Magnetic Resonance Imaging Industry in South Korea Revenue Million Forecast, by Field Strength 2019 & 2032
- Table 9: Global Magnetic Resonance Imaging Industry in South Korea Revenue Million Forecast, by Application 2019 & 2032
- Table 10: Global Magnetic Resonance Imaging Industry in South Korea Revenue Million Forecast, by Country 2019 & 2032
- Table 11: United States Magnetic Resonance Imaging Industry in South Korea Revenue (Million) Forecast, by Application 2019 & 2032
- Table 12: Canada Magnetic Resonance Imaging Industry in South Korea Revenue (Million) Forecast, by Application 2019 & 2032
- Table 13: Mexico Magnetic Resonance Imaging Industry in South Korea Revenue (Million) Forecast, by Application 2019 & 2032
- Table 14: Global Magnetic Resonance Imaging Industry in South Korea Revenue Million Forecast, by Architecture 2019 & 2032
- Table 15: Global Magnetic Resonance Imaging Industry in South Korea Revenue Million Forecast, by Field Strength 2019 & 2032
- Table 16: Global Magnetic Resonance Imaging Industry in South Korea Revenue Million Forecast, by Application 2019 & 2032
- Table 17: Global Magnetic Resonance Imaging Industry in South Korea Revenue Million Forecast, by Country 2019 & 2032
- Table 18: Brazil Magnetic Resonance Imaging Industry in South Korea Revenue (Million) Forecast, by Application 2019 & 2032
- Table 19: Argentina Magnetic Resonance Imaging Industry in South Korea Revenue (Million) Forecast, by Application 2019 & 2032
- Table 20: Rest of South America Magnetic Resonance Imaging Industry in South Korea Revenue (Million) Forecast, by Application 2019 & 2032
- Table 21: Global Magnetic Resonance Imaging Industry in South Korea Revenue Million Forecast, by Architecture 2019 & 2032
- Table 22: Global Magnetic Resonance Imaging Industry in South Korea Revenue Million Forecast, by Field Strength 2019 & 2032
- Table 23: Global Magnetic Resonance Imaging Industry in South Korea Revenue Million Forecast, by Application 2019 & 2032
- Table 24: Global Magnetic Resonance Imaging Industry in South Korea Revenue Million Forecast, by Country 2019 & 2032
- Table 25: United Kingdom Magnetic Resonance Imaging Industry in South Korea Revenue (Million) Forecast, by Application 2019 & 2032
- Table 26: Germany Magnetic Resonance Imaging Industry in South Korea Revenue (Million) Forecast, by Application 2019 & 2032
- Table 27: France Magnetic Resonance Imaging Industry in South Korea Revenue (Million) Forecast, by Application 2019 & 2032
- Table 28: Italy Magnetic Resonance Imaging Industry in South Korea Revenue (Million) Forecast, by Application 2019 & 2032
- Table 29: Spain Magnetic Resonance Imaging Industry in South Korea Revenue (Million) Forecast, by Application 2019 & 2032
- Table 30: Russia Magnetic Resonance Imaging Industry in South Korea Revenue (Million) Forecast, by Application 2019 & 2032
- Table 31: Benelux Magnetic Resonance Imaging Industry in South Korea Revenue (Million) Forecast, by Application 2019 & 2032
- Table 32: Nordics Magnetic Resonance Imaging Industry in South Korea Revenue (Million) Forecast, by Application 2019 & 2032
- Table 33: Rest of Europe Magnetic Resonance Imaging Industry in South Korea Revenue (Million) Forecast, by Application 2019 & 2032
- Table 34: Global Magnetic Resonance Imaging Industry in South Korea Revenue Million Forecast, by Architecture 2019 & 2032
- Table 35: Global Magnetic Resonance Imaging Industry in South Korea Revenue Million Forecast, by Field Strength 2019 & 2032
- Table 36: Global Magnetic Resonance Imaging Industry in South Korea Revenue Million Forecast, by Application 2019 & 2032
- Table 37: Global Magnetic Resonance Imaging Industry in South Korea Revenue Million Forecast, by Country 2019 & 2032
- Table 38: Turkey Magnetic Resonance Imaging Industry in South Korea Revenue (Million) Forecast, by Application 2019 & 2032
- Table 39: Israel Magnetic Resonance Imaging Industry in South Korea Revenue (Million) Forecast, by Application 2019 & 2032
- Table 40: GCC Magnetic Resonance Imaging Industry in South Korea Revenue (Million) Forecast, by Application 2019 & 2032
- Table 41: North Africa Magnetic Resonance Imaging Industry in South Korea Revenue (Million) Forecast, by Application 2019 & 2032
- Table 42: South Africa Magnetic Resonance Imaging Industry in South Korea Revenue (Million) Forecast, by Application 2019 & 2032
- Table 43: Rest of Middle East & Africa Magnetic Resonance Imaging Industry in South Korea Revenue (Million) Forecast, by Application 2019 & 2032
- Table 44: Global Magnetic Resonance Imaging Industry in South Korea Revenue Million Forecast, by Architecture 2019 & 2032
- Table 45: Global Magnetic Resonance Imaging Industry in South Korea Revenue Million Forecast, by Field Strength 2019 & 2032
- Table 46: Global Magnetic Resonance Imaging Industry in South Korea Revenue Million Forecast, by Application 2019 & 2032
- Table 47: Global Magnetic Resonance Imaging Industry in South Korea Revenue Million Forecast, by Country 2019 & 2032
- Table 48: China Magnetic Resonance Imaging Industry in South Korea Revenue (Million) Forecast, by Application 2019 & 2032
- Table 49: India Magnetic Resonance Imaging Industry in South Korea Revenue (Million) Forecast, by Application 2019 & 2032
- Table 50: Japan Magnetic Resonance Imaging Industry in South Korea Revenue (Million) Forecast, by Application 2019 & 2032
- Table 51: South Korea Magnetic Resonance Imaging Industry in South Korea Revenue (Million) Forecast, by Application 2019 & 2032
- Table 52: ASEAN Magnetic Resonance Imaging Industry in South Korea Revenue (Million) Forecast, by Application 2019 & 2032
- Table 53: Oceania Magnetic Resonance Imaging Industry in South Korea Revenue (Million) Forecast, by Application 2019 & 2032
- Table 54: Rest of Asia Pacific Magnetic Resonance Imaging Industry in South Korea Revenue (Million) Forecast, by Application 2019 & 2032
Frequently Asked Questions
1. What is the projected Compound Annual Growth Rate (CAGR) of the Magnetic Resonance Imaging Industry in South Korea?
The projected CAGR is approximately 5.38%.
2. Which companies are prominent players in the Magnetic Resonance Imaging Industry in South Korea?
Key companies in the market include Medonica Co Ltd, Esaote SpA, Fonar Corporation, Siemens Healthineers, GE Healthcare, Neusoft Medical Systems Co Ltd, Koninklijke Philips NV, Canon Medical Systems Corporation, Fujifilm Holdings Corporation.
3. What are the main segments of the Magnetic Resonance Imaging Industry in South Korea?
The market segments include Architecture, Field Strength, Application.
4. Can you provide details about the market size?
The market size is estimated to be USD 312.10 Million as of 2022.
5. What are some drivers contributing to market growth?
Introduction of Hybrid MRI Systems; Increasing Prevalence of Chronic Diseases and Rising Geriatric Population.
6. What are the notable trends driving market growth?
High-Field MRI Systems are Expected to Witness Healthy Growth Over the Forecast Period.
7. Are there any restraints impacting market growth?
High Cost of MRI Systems.
8. Can you provide examples of recent developments in the market?
In August 2022, South Korea-based healthcare start-up AIRS Medical has secured around USD 20 million in a Series B funding round that included existing investor Klim Ventures.
9. What pricing options are available for accessing the report?
Pricing options include single-user, multi-user, and enterprise licenses priced at USD 3800, USD 4500, and USD 5800 respectively.
10. Is the market size provided in terms of value or volume?
The market size is provided in terms of value, measured in Million.
11. Are there any specific market keywords associated with the report?
Yes, the market keyword associated with the report is "Magnetic Resonance Imaging Industry in South Korea," which aids in identifying and referencing the specific market segment covered.
12. How do I determine which pricing option suits my needs best?
The pricing options vary based on user requirements and access needs. Individual users may opt for single-user licenses, while businesses requiring broader access may choose multi-user or enterprise licenses for cost-effective access to the report.
13. Are there any additional resources or data provided in the Magnetic Resonance Imaging Industry in South Korea report?
While the report offers comprehensive insights, it's advisable to review the specific contents or supplementary materials provided to ascertain if additional resources or data are available.
14. How can I stay updated on further developments or reports in the Magnetic Resonance Imaging Industry in South Korea?
To stay informed about further developments, trends, and reports in the Magnetic Resonance Imaging Industry in South Korea, consider subscribing to industry newsletters, following relevant companies and organizations, or regularly checking reputable industry news sources and publications.
Methodology
Step 1 - Identification of Relevant Samples Size from Population Database


Step 2 - Approaches for Defining Global Market Size (Value, Volume* & Price*)

Note*: In applicable scenarios
Step 3 - Data Sources
Primary Research
- Web Analytics
- Survey Reports
- Research Institute
- Latest Research Reports
- Opinion Leaders
Secondary Research
- Annual Reports
- White Paper
- Latest Press Release
- Industry Association
- Paid Database
- Investor Presentations

Step 4 - Data Triangulation
Involves using different sources of information in order to increase the validity of a study
These sources are likely to be stakeholders in a program - participants, other researchers, program staff, other community members, and so on.
Then we put all data in single framework & apply various statistical tools to find out the dynamic on the market.
During the analysis stage, feedback from the stakeholder groups would be compared to determine areas of agreement as well as areas of divergence


