
Key Insights
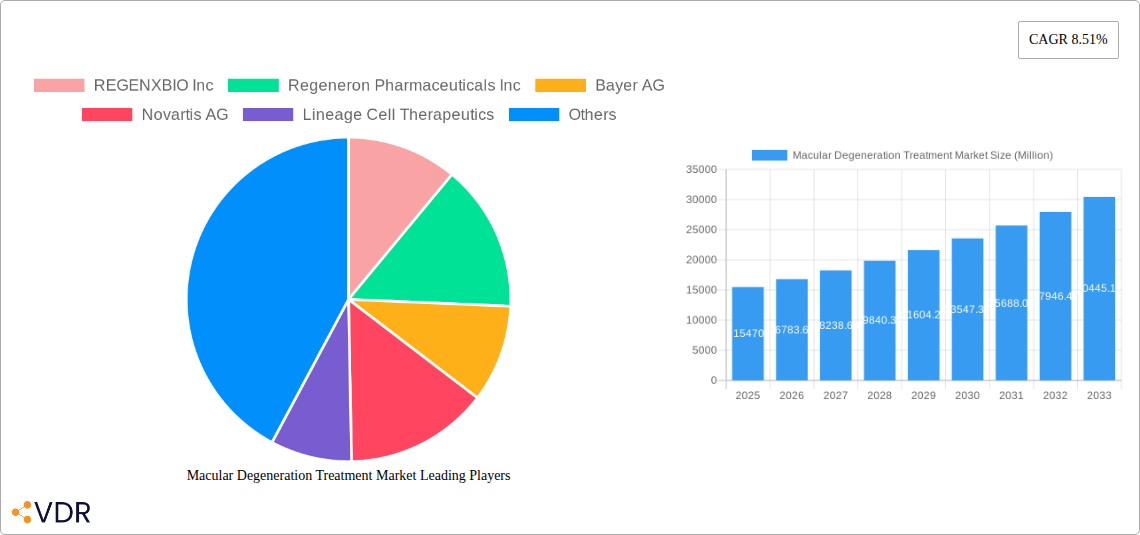
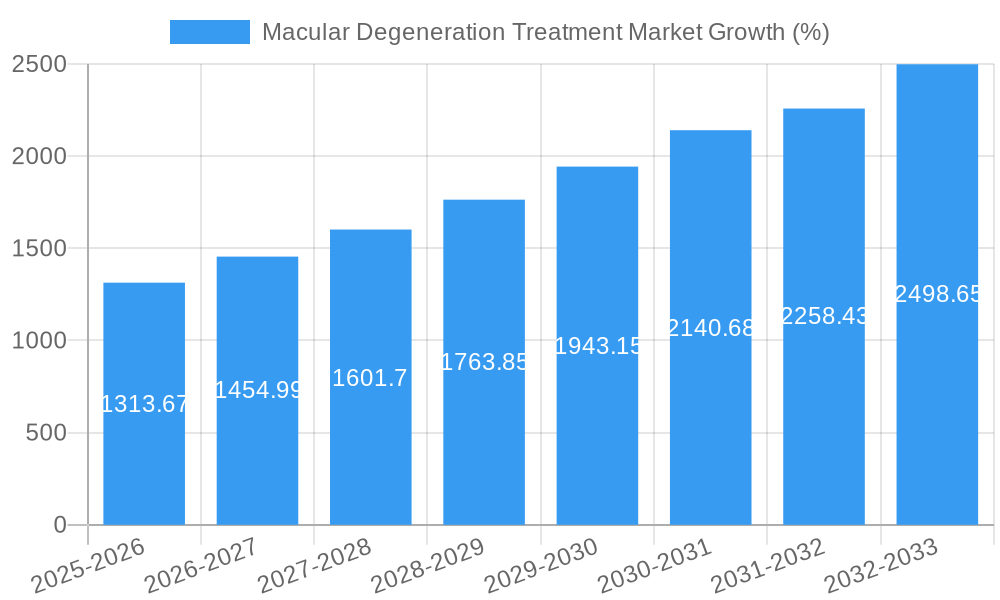
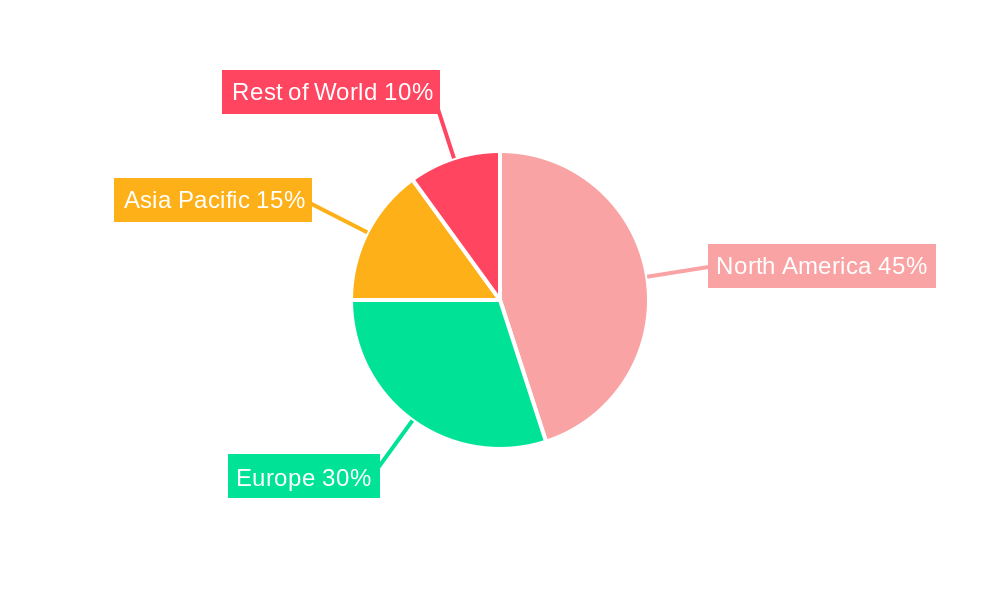
The global macular degeneration (AMD) treatment market, valued at $15.47 billion in 2025, is projected to experience robust growth, driven by a rising geriatric population, increasing prevalence of AMD, and advancements in treatment modalities. The market's compound annual growth rate (CAGR) of 8.51% from 2025 to 2033 indicates significant expansion opportunities. Key drivers include the development and adoption of innovative therapies like anti-VEGF injections for wet AMD and emerging gene therapies offering potential cures. Market trends point toward a shift towards earlier diagnosis and intervention, personalized medicine approaches, and a growing preference for minimally invasive procedures. While the high cost of treatment poses a restraint, the improved quality of life offered by effective therapies and the increasing availability of insurance coverage are mitigating this factor. The market is segmented by route of administration (intravitreal and intravenous), sales channel (hospitals, ambulatory surgical centers), AMD type (wet and dry), disease stage (early, intermediate, late), and treatment type (drug and device-based). The competitive landscape features a mix of established pharmaceutical giants and emerging biotechnology companies actively engaged in R&D, driving further market evolution. Geographic segmentation reveals strong market performance in North America and Europe, with significant growth potential in Asia-Pacific and other emerging economies.
The substantial growth trajectory is further fueled by ongoing research into novel therapies targeting the underlying mechanisms of AMD, including gene editing and cell-based therapies. This innovation pipeline promises to enhance treatment efficacy and potentially transform the management of this vision-threatening disease. Moreover, increased awareness campaigns and improved diagnostic capabilities are contributing to earlier diagnosis and intervention, leading to better patient outcomes and market expansion. While the market faces challenges in terms of accessibility and affordability, particularly in low- and middle-income countries, ongoing efforts to address these barriers are expected to contribute to sustained and inclusive market growth throughout the forecast period. The competitive landscape is characterized by intense R&D activities and strategic partnerships, reflecting the significant commercial opportunity within this rapidly expanding market.
Macular Degeneration Treatment Market: A Comprehensive Report (2019-2033)
This in-depth report provides a comprehensive analysis of the Macular Degeneration Treatment Market, encompassing market dynamics, growth trends, regional dominance, product landscape, key players, and future outlook. The study period covers 2019-2033, with 2025 as the base and estimated year. The report segments the market by various factors including drug type, route of administration, sales channel, and disease stage, offering granular insights for strategic decision-making. The market size is presented in million units.
Macular Degeneration Treatment Market Dynamics & Structure
The macular degeneration treatment market is characterized by moderate concentration, with key players like Regeneron Pharmaceuticals Inc, Novartis AG, and Roche vying for market share. Technological innovation, particularly in gene therapy and novel drug delivery systems, is a major driver. Stringent regulatory frameworks, including FDA approvals in the US and EMA approvals in Europe, influence market entry and product lifecycle. Competitive substitutes, including existing treatments and emerging therapies, impact market dynamics. The aging global population significantly fuels market growth, with a larger segment of the population exhibiting risk factors. The rising incidence of age-related macular degeneration (AMD) globally is directly proportional to the increase in demand for treatment. M&A activity in the sector is moderate, with strategic collaborations and acquisitions shaping the competitive landscape.
- Market Concentration: Moderately concentrated, with top 5 players holding xx% market share (2025).
- Technological Innovation: Gene therapy, novel drug delivery systems (e.g., sustained-release formulations) driving growth.
- Regulatory Landscape: Stringent FDA and EMA approvals influence market access.
- Competitive Substitutes: Existing treatments and emerging therapies create competitive pressure.
- End-User Demographics: Aging global population fuels market growth, with xx million people projected to have AMD by 2033.
- M&A Trends: Moderate M&A activity, primarily driven by strategic partnerships and acquisitions.
Macular Degeneration Treatment Market Growth Trends & Insights
The macular degeneration treatment market is experiencing significant growth, driven by a rising prevalence of AMD and technological advancements in treatment modalities. The market size exhibited a CAGR of xx% during the historical period (2019-2024) and is projected to reach xx million units by 2033, with a projected CAGR of xx% during the forecast period (2025-2033). Increased adoption of intravitreal injections for wet AMD and a growing awareness of early diagnosis and treatment contribute to market expansion. Technological disruptions, including the development of novel therapeutic agents and advanced imaging techniques, are transforming the market. Changes in patient preferences and treatment paradigms are also shaping market dynamics. The market penetration rate for effective treatments is estimated to be xx% in 2025, expected to grow to xx% by 2033. Shifting consumer behavior towards proactive healthcare and personalized medicine also influence market growth.
Dominant Regions, Countries, or Segments in Macular Degeneration Treatment Market
North America currently dominates the macular degeneration treatment market, driven by high healthcare expenditure, advanced healthcare infrastructure, and a large patient population. Within North America, the US holds the largest market share due to high prevalence of AMD and strong regulatory approvals. Europe also exhibits significant market growth due to increased healthcare spending and technological advancements. Within the segmented markets:
- By Route of Administration: Intravitreal route dominates due to its efficacy, accounting for xx% of the market.
- By Sales Channel: Hospitals and ambulatory surgical centers account for the majority of sales.
- By Type: Wet age-related macular degeneration represents a larger segment due to its higher prevalence and treatment needs.
- By Stage of Disease: Late-stage AMD commands a significant market share due to the high severity of the condition.
- By Treatment Type: Drug therapies currently dominate, comprising xx% of the total market.
Macular Degeneration Treatment Market Product Landscape
The market features a range of products, including anti-VEGF injections (e.g., Lucentis, Eylea), gene therapies, and other investigational drugs. Recent product innovations focus on improving efficacy, safety, and convenience of administration. Advancements in drug delivery systems, like sustained-release formulations, are aimed at reducing treatment frequency and improving patient compliance. The unique selling propositions of many products include improved efficacy, reduced side effects, and extended duration of action.
Key Drivers, Barriers & Challenges in Macular Degeneration Treatment Market
Key Drivers:
- The rising prevalence of AMD due to an aging population.
- Technological advancements in drug development and delivery.
- Increased awareness and early diagnosis initiatives.
- Growing investment in research and development.
Challenges & Restraints:
- High cost of treatment limiting accessibility, particularly in emerging markets.
- Potential side effects of certain therapies impacting adoption rates.
- Complex regulatory pathways delaying market entry for new therapies.
- Competition from existing treatments and emerging therapies.
- The fluctuating cost of raw materials and manufacturing impacts the market negatively.
Emerging Opportunities in Macular Degeneration Treatment Market
- The development of novel therapies targeting dry AMD, currently a less-addressed segment.
- Expansion into emerging markets with growing prevalence of AMD.
- Personalized medicine approaches tailoring treatment to individual patients.
- Telemedicine platforms to improve remote monitoring and patient management.
- Development of non-invasive diagnostic techniques to improve early detection and intervention.
Growth Accelerators in the Macular Degeneration Treatment Market Industry
Technological breakthroughs in gene therapy and other novel treatment modalities represent major long-term growth catalysts. Strategic partnerships between pharmaceutical companies and research institutions accelerate innovation. Expansion into untapped markets, particularly in developing countries with rising prevalence of AMD, presents significant growth opportunities. Development of cost-effective therapies will improve accessibility and market expansion.
Key Players Shaping the Macular Degeneration Treatment Market Market
- REGENXBIO Inc
- Regeneron Pharmaceuticals Inc
- Bayer AG
- Novartis AG
- Lineage Cell Therapeutics
- Panoptica
- Oxurion
- F Hoffmann-La Roche Ltd
- Clover Therapeutics
- Aerie Pharmaceutical Inc
- ONL Therapeutics
- MeiraGTx
- Ocugen Inc
- Bausch Health Companies Inc
- Pfizer Inc
Notable Milestones in Macular Degeneration Treatment Sector
- November 2022: IVERIC bio, Inc. submitted an NDA to the US FDA for avacincaptad pegol for geographic atrophy (GA) secondary to AMD.
- November 2022: The European Commission approved Ximluci, a ranibizumab biosimilar.
In-Depth Macular Degeneration Treatment Market Outlook
The macular degeneration treatment market is poised for continued growth driven by several factors, including an aging population, technological advancements, and increased awareness. Strategic partnerships and collaborations among key players will accelerate innovation. The development of cost-effective and accessible treatments will expand market reach, particularly in underserved regions. The focus on personalized medicine and innovative drug delivery systems will drive further growth in the coming years. The market is expected to witness a significant expansion, with substantial growth potential in the forecast period.
Macular Degeneration Treatment Market Segmentation
-
1. Type
- 1.1. Dry Age-related Macular Degeneration
- 1.2. Wet Age-related Macular Degeneration
-
2. Stage of Disease
- 2.1. Early-stage AMD
- 2.2. Intermediate AMD
- 2.3. Late-stage AMD
-
3. Treatment Type
-
3.1. Drug
- 3.1.1. Anti-vascular Endothelial Growth Factor
- 3.1.2. Dietary Supplements
- 3.1.3. Other Drugs
-
3.2. Devices
- 3.2.1. Glasses
- 3.2.2. Contact Lenses
- 3.2.3. Other Devices
-
3.3. Surgery
- 3.3.1. Laser Surgery
- 3.3.2. Other Surgeries
-
3.1. Drug
-
4. Route of Administration
- 4.1. Intravenous Route
- 4.2. Intravitreal Route
-
5. Sales Channel
- 5.1. Ambulatory Surgical Centers
- 5.2. Hospitals
- 5.3. Other Sales Channels
Macular Degeneration Treatment Market Segmentation By Geography
-
1. North America
- 1.1. United States
- 1.2. Canada
- 1.3. Mexico
-
2. Europe
- 2.1. Germany
- 2.2. United Kingdom
- 2.3. France
- 2.4. Italy
- 2.5. Spain
- 2.6. Rest of Europe
-
3. Asia Pacific
- 3.1. China
- 3.2. Japan
- 3.3. India
- 3.4. Australia
- 3.5. South Korea
- 3.6. Rest of Asia Pacific
-
4. Middle East and Africa
- 4.1. GCC
- 4.2. South Africa
- 4.3. Rest of Middle East and Africa
-
5. South America
- 5.1. Brazil
- 5.2. Argentina
- 5.3. Rest of South America
Macular Degeneration Treatment Market REPORT HIGHLIGHTS
| Aspects | Details |
|---|---|
| Study Period | 2019-2033 |
| Base Year | 2024 |
| Estimated Year | 2025 |
| Forecast Period | 2025-2033 |
| Historical Period | 2019-2024 |
| Growth Rate | CAGR of 8.51% from 2019-2033 |
| Segmentation |
|
Table of Contents
- 1. Introduction
- 1.1. Research Scope
- 1.2. Market Segmentation
- 1.3. Research Methodology
- 1.4. Definitions and Assumptions
- 2. Executive Summary
- 2.1. Introduction
- 3. Market Dynamics
- 3.1. Introduction
- 3.2. Market Drivers
- 3.2.1. Increasing Burden of Retinal Disorders; Upsurge in the Geriatric Population; Increase in Research and Development Investments
- 3.3. Market Restrains
- 3.3.1. Increasing Use of Off-label Drugs; Lack of Awareness Regarding AMD
- 3.4. Market Trends
- 3.4.1. Wet Age-related Macular Degeneration is Expected to Hold Significant Market Share Over the Forecast Period
- 4. Market Factor Analysis
- 4.1. Porters Five Forces
- 4.2. Supply/Value Chain
- 4.3. PESTEL analysis
- 4.4. Market Entropy
- 4.5. Patent/Trademark Analysis
- 5. Global Macular Degeneration Treatment Market Analysis, Insights and Forecast, 2019-2031
- 5.1. Market Analysis, Insights and Forecast - by Type
- 5.1.1. Dry Age-related Macular Degeneration
- 5.1.2. Wet Age-related Macular Degeneration
- 5.2. Market Analysis, Insights and Forecast - by Stage of Disease
- 5.2.1. Early-stage AMD
- 5.2.2. Intermediate AMD
- 5.2.3. Late-stage AMD
- 5.3. Market Analysis, Insights and Forecast - by Treatment Type
- 5.3.1. Drug
- 5.3.1.1. Anti-vascular Endothelial Growth Factor
- 5.3.1.2. Dietary Supplements
- 5.3.1.3. Other Drugs
- 5.3.2. Devices
- 5.3.2.1. Glasses
- 5.3.2.2. Contact Lenses
- 5.3.2.3. Other Devices
- 5.3.3. Surgery
- 5.3.3.1. Laser Surgery
- 5.3.3.2. Other Surgeries
- 5.3.1. Drug
- 5.4. Market Analysis, Insights and Forecast - by Route of Administration
- 5.4.1. Intravenous Route
- 5.4.2. Intravitreal Route
- 5.5. Market Analysis, Insights and Forecast - by Sales Channel
- 5.5.1. Ambulatory Surgical Centers
- 5.5.2. Hospitals
- 5.5.3. Other Sales Channels
- 5.6. Market Analysis, Insights and Forecast - by Region
- 5.6.1. North America
- 5.6.2. Europe
- 5.6.3. Asia Pacific
- 5.6.4. Middle East and Africa
- 5.6.5. South America
- 5.1. Market Analysis, Insights and Forecast - by Type
- 6. North America Macular Degeneration Treatment Market Analysis, Insights and Forecast, 2019-2031
- 6.1. Market Analysis, Insights and Forecast - by Type
- 6.1.1. Dry Age-related Macular Degeneration
- 6.1.2. Wet Age-related Macular Degeneration
- 6.2. Market Analysis, Insights and Forecast - by Stage of Disease
- 6.2.1. Early-stage AMD
- 6.2.2. Intermediate AMD
- 6.2.3. Late-stage AMD
- 6.3. Market Analysis, Insights and Forecast - by Treatment Type
- 6.3.1. Drug
- 6.3.1.1. Anti-vascular Endothelial Growth Factor
- 6.3.1.2. Dietary Supplements
- 6.3.1.3. Other Drugs
- 6.3.2. Devices
- 6.3.2.1. Glasses
- 6.3.2.2. Contact Lenses
- 6.3.2.3. Other Devices
- 6.3.3. Surgery
- 6.3.3.1. Laser Surgery
- 6.3.3.2. Other Surgeries
- 6.3.1. Drug
- 6.4. Market Analysis, Insights and Forecast - by Route of Administration
- 6.4.1. Intravenous Route
- 6.4.2. Intravitreal Route
- 6.5. Market Analysis, Insights and Forecast - by Sales Channel
- 6.5.1. Ambulatory Surgical Centers
- 6.5.2. Hospitals
- 6.5.3. Other Sales Channels
- 6.1. Market Analysis, Insights and Forecast - by Type
- 7. Europe Macular Degeneration Treatment Market Analysis, Insights and Forecast, 2019-2031
- 7.1. Market Analysis, Insights and Forecast - by Type
- 7.1.1. Dry Age-related Macular Degeneration
- 7.1.2. Wet Age-related Macular Degeneration
- 7.2. Market Analysis, Insights and Forecast - by Stage of Disease
- 7.2.1. Early-stage AMD
- 7.2.2. Intermediate AMD
- 7.2.3. Late-stage AMD
- 7.3. Market Analysis, Insights and Forecast - by Treatment Type
- 7.3.1. Drug
- 7.3.1.1. Anti-vascular Endothelial Growth Factor
- 7.3.1.2. Dietary Supplements
- 7.3.1.3. Other Drugs
- 7.3.2. Devices
- 7.3.2.1. Glasses
- 7.3.2.2. Contact Lenses
- 7.3.2.3. Other Devices
- 7.3.3. Surgery
- 7.3.3.1. Laser Surgery
- 7.3.3.2. Other Surgeries
- 7.3.1. Drug
- 7.4. Market Analysis, Insights and Forecast - by Route of Administration
- 7.4.1. Intravenous Route
- 7.4.2. Intravitreal Route
- 7.5. Market Analysis, Insights and Forecast - by Sales Channel
- 7.5.1. Ambulatory Surgical Centers
- 7.5.2. Hospitals
- 7.5.3. Other Sales Channels
- 7.1. Market Analysis, Insights and Forecast - by Type
- 8. Asia Pacific Macular Degeneration Treatment Market Analysis, Insights and Forecast, 2019-2031
- 8.1. Market Analysis, Insights and Forecast - by Type
- 8.1.1. Dry Age-related Macular Degeneration
- 8.1.2. Wet Age-related Macular Degeneration
- 8.2. Market Analysis, Insights and Forecast - by Stage of Disease
- 8.2.1. Early-stage AMD
- 8.2.2. Intermediate AMD
- 8.2.3. Late-stage AMD
- 8.3. Market Analysis, Insights and Forecast - by Treatment Type
- 8.3.1. Drug
- 8.3.1.1. Anti-vascular Endothelial Growth Factor
- 8.3.1.2. Dietary Supplements
- 8.3.1.3. Other Drugs
- 8.3.2. Devices
- 8.3.2.1. Glasses
- 8.3.2.2. Contact Lenses
- 8.3.2.3. Other Devices
- 8.3.3. Surgery
- 8.3.3.1. Laser Surgery
- 8.3.3.2. Other Surgeries
- 8.3.1. Drug
- 8.4. Market Analysis, Insights and Forecast - by Route of Administration
- 8.4.1. Intravenous Route
- 8.4.2. Intravitreal Route
- 8.5. Market Analysis, Insights and Forecast - by Sales Channel
- 8.5.1. Ambulatory Surgical Centers
- 8.5.2. Hospitals
- 8.5.3. Other Sales Channels
- 8.1. Market Analysis, Insights and Forecast - by Type
- 9. Middle East and Africa Macular Degeneration Treatment Market Analysis, Insights and Forecast, 2019-2031
- 9.1. Market Analysis, Insights and Forecast - by Type
- 9.1.1. Dry Age-related Macular Degeneration
- 9.1.2. Wet Age-related Macular Degeneration
- 9.2. Market Analysis, Insights and Forecast - by Stage of Disease
- 9.2.1. Early-stage AMD
- 9.2.2. Intermediate AMD
- 9.2.3. Late-stage AMD
- 9.3. Market Analysis, Insights and Forecast - by Treatment Type
- 9.3.1. Drug
- 9.3.1.1. Anti-vascular Endothelial Growth Factor
- 9.3.1.2. Dietary Supplements
- 9.3.1.3. Other Drugs
- 9.3.2. Devices
- 9.3.2.1. Glasses
- 9.3.2.2. Contact Lenses
- 9.3.2.3. Other Devices
- 9.3.3. Surgery
- 9.3.3.1. Laser Surgery
- 9.3.3.2. Other Surgeries
- 9.3.1. Drug
- 9.4. Market Analysis, Insights and Forecast - by Route of Administration
- 9.4.1. Intravenous Route
- 9.4.2. Intravitreal Route
- 9.5. Market Analysis, Insights and Forecast - by Sales Channel
- 9.5.1. Ambulatory Surgical Centers
- 9.5.2. Hospitals
- 9.5.3. Other Sales Channels
- 9.1. Market Analysis, Insights and Forecast - by Type
- 10. South America Macular Degeneration Treatment Market Analysis, Insights and Forecast, 2019-2031
- 10.1. Market Analysis, Insights and Forecast - by Type
- 10.1.1. Dry Age-related Macular Degeneration
- 10.1.2. Wet Age-related Macular Degeneration
- 10.2. Market Analysis, Insights and Forecast - by Stage of Disease
- 10.2.1. Early-stage AMD
- 10.2.2. Intermediate AMD
- 10.2.3. Late-stage AMD
- 10.3. Market Analysis, Insights and Forecast - by Treatment Type
- 10.3.1. Drug
- 10.3.1.1. Anti-vascular Endothelial Growth Factor
- 10.3.1.2. Dietary Supplements
- 10.3.1.3. Other Drugs
- 10.3.2. Devices
- 10.3.2.1. Glasses
- 10.3.2.2. Contact Lenses
- 10.3.2.3. Other Devices
- 10.3.3. Surgery
- 10.3.3.1. Laser Surgery
- 10.3.3.2. Other Surgeries
- 10.3.1. Drug
- 10.4. Market Analysis, Insights and Forecast - by Route of Administration
- 10.4.1. Intravenous Route
- 10.4.2. Intravitreal Route
- 10.5. Market Analysis, Insights and Forecast - by Sales Channel
- 10.5.1. Ambulatory Surgical Centers
- 10.5.2. Hospitals
- 10.5.3. Other Sales Channels
- 10.1. Market Analysis, Insights and Forecast - by Type
- 11. North America Macular Degeneration Treatment Market Analysis, Insights and Forecast, 2019-2031
- 11.1. Market Analysis, Insights and Forecast - By Country/Sub-region
- 11.1.1 United States
- 11.1.2 Canada
- 11.1.3 Mexico
- 12. Europe Macular Degeneration Treatment Market Analysis, Insights and Forecast, 2019-2031
- 12.1. Market Analysis, Insights and Forecast - By Country/Sub-region
- 12.1.1 Germany
- 12.1.2 United Kingdom
- 12.1.3 France
- 12.1.4 Italy
- 12.1.5 Spain
- 12.1.6 Rest of Europe
- 13. Asia Pacific Macular Degeneration Treatment Market Analysis, Insights and Forecast, 2019-2031
- 13.1. Market Analysis, Insights and Forecast - By Country/Sub-region
- 13.1.1 China
- 13.1.2 Japan
- 13.1.3 India
- 13.1.4 Australia
- 13.1.5 South Korea
- 13.1.6 Rest of Asia Pacific
- 14. Middle East and Africa Macular Degeneration Treatment Market Analysis, Insights and Forecast, 2019-2031
- 14.1. Market Analysis, Insights and Forecast - By Country/Sub-region
- 14.1.1 GCC
- 14.1.2 South Africa
- 14.1.3 Rest of Middle East and Africa
- 15. South America Macular Degeneration Treatment Market Analysis, Insights and Forecast, 2019-2031
- 15.1. Market Analysis, Insights and Forecast - By Country/Sub-region
- 15.1.1 Brazil
- 15.1.2 Argentina
- 15.1.3 Rest of South America
- 16. Competitive Analysis
- 16.1. Global Market Share Analysis 2024
- 16.2. Company Profiles
- 16.2.1 REGENXBIO Inc
- 16.2.1.1. Overview
- 16.2.1.2. Products
- 16.2.1.3. SWOT Analysis
- 16.2.1.4. Recent Developments
- 16.2.1.5. Financials (Based on Availability)
- 16.2.2 Regeneron Pharmaceuticals Inc
- 16.2.2.1. Overview
- 16.2.2.2. Products
- 16.2.2.3. SWOT Analysis
- 16.2.2.4. Recent Developments
- 16.2.2.5. Financials (Based on Availability)
- 16.2.3 Bayer AG
- 16.2.3.1. Overview
- 16.2.3.2. Products
- 16.2.3.3. SWOT Analysis
- 16.2.3.4. Recent Developments
- 16.2.3.5. Financials (Based on Availability)
- 16.2.4 Novartis AG
- 16.2.4.1. Overview
- 16.2.4.2. Products
- 16.2.4.3. SWOT Analysis
- 16.2.4.4. Recent Developments
- 16.2.4.5. Financials (Based on Availability)
- 16.2.5 Lineage Cell Therapeutics
- 16.2.5.1. Overview
- 16.2.5.2. Products
- 16.2.5.3. SWOT Analysis
- 16.2.5.4. Recent Developments
- 16.2.5.5. Financials (Based on Availability)
- 16.2.6 Panoptica
- 16.2.6.1. Overview
- 16.2.6.2. Products
- 16.2.6.3. SWOT Analysis
- 16.2.6.4. Recent Developments
- 16.2.6.5. Financials (Based on Availability)
- 16.2.7 Oxurion
- 16.2.7.1. Overview
- 16.2.7.2. Products
- 16.2.7.3. SWOT Analysis
- 16.2.7.4. Recent Developments
- 16.2.7.5. Financials (Based on Availability)
- 16.2.8 F Hoffmann-La Roche Ltd
- 16.2.8.1. Overview
- 16.2.8.2. Products
- 16.2.8.3. SWOT Analysis
- 16.2.8.4. Recent Developments
- 16.2.8.5. Financials (Based on Availability)
- 16.2.9 Clover Therapeutics
- 16.2.9.1. Overview
- 16.2.9.2. Products
- 16.2.9.3. SWOT Analysis
- 16.2.9.4. Recent Developments
- 16.2.9.5. Financials (Based on Availability)
- 16.2.10 Aerie Pharmaceutical Inc
- 16.2.10.1. Overview
- 16.2.10.2. Products
- 16.2.10.3. SWOT Analysis
- 16.2.10.4. Recent Developments
- 16.2.10.5. Financials (Based on Availability)
- 16.2.11 ONL Therapeutics
- 16.2.11.1. Overview
- 16.2.11.2. Products
- 16.2.11.3. SWOT Analysis
- 16.2.11.4. Recent Developments
- 16.2.11.5. Financials (Based on Availability)
- 16.2.12 MeiraGTx
- 16.2.12.1. Overview
- 16.2.12.2. Products
- 16.2.12.3. SWOT Analysis
- 16.2.12.4. Recent Developments
- 16.2.12.5. Financials (Based on Availability)
- 16.2.13 Ocugen Inc
- 16.2.13.1. Overview
- 16.2.13.2. Products
- 16.2.13.3. SWOT Analysis
- 16.2.13.4. Recent Developments
- 16.2.13.5. Financials (Based on Availability)
- 16.2.14 Bausch Health Companies Inc
- 16.2.14.1. Overview
- 16.2.14.2. Products
- 16.2.14.3. SWOT Analysis
- 16.2.14.4. Recent Developments
- 16.2.14.5. Financials (Based on Availability)
- 16.2.15 Pfizer Inc
- 16.2.15.1. Overview
- 16.2.15.2. Products
- 16.2.15.3. SWOT Analysis
- 16.2.15.4. Recent Developments
- 16.2.15.5. Financials (Based on Availability)
- 16.2.1 REGENXBIO Inc
List of Figures
- Figure 1: Global Macular Degeneration Treatment Market Revenue Breakdown (Million, %) by Region 2024 & 2032
- Figure 2: Global Macular Degeneration Treatment Market Volume Breakdown (K Unit, %) by Region 2024 & 2032
- Figure 3: North America Macular Degeneration Treatment Market Revenue (Million), by Country 2024 & 2032
- Figure 4: North America Macular Degeneration Treatment Market Volume (K Unit), by Country 2024 & 2032
- Figure 5: North America Macular Degeneration Treatment Market Revenue Share (%), by Country 2024 & 2032
- Figure 6: North America Macular Degeneration Treatment Market Volume Share (%), by Country 2024 & 2032
- Figure 7: Europe Macular Degeneration Treatment Market Revenue (Million), by Country 2024 & 2032
- Figure 8: Europe Macular Degeneration Treatment Market Volume (K Unit), by Country 2024 & 2032
- Figure 9: Europe Macular Degeneration Treatment Market Revenue Share (%), by Country 2024 & 2032
- Figure 10: Europe Macular Degeneration Treatment Market Volume Share (%), by Country 2024 & 2032
- Figure 11: Asia Pacific Macular Degeneration Treatment Market Revenue (Million), by Country 2024 & 2032
- Figure 12: Asia Pacific Macular Degeneration Treatment Market Volume (K Unit), by Country 2024 & 2032
- Figure 13: Asia Pacific Macular Degeneration Treatment Market Revenue Share (%), by Country 2024 & 2032
- Figure 14: Asia Pacific Macular Degeneration Treatment Market Volume Share (%), by Country 2024 & 2032
- Figure 15: Middle East and Africa Macular Degeneration Treatment Market Revenue (Million), by Country 2024 & 2032
- Figure 16: Middle East and Africa Macular Degeneration Treatment Market Volume (K Unit), by Country 2024 & 2032
- Figure 17: Middle East and Africa Macular Degeneration Treatment Market Revenue Share (%), by Country 2024 & 2032
- Figure 18: Middle East and Africa Macular Degeneration Treatment Market Volume Share (%), by Country 2024 & 2032
- Figure 19: South America Macular Degeneration Treatment Market Revenue (Million), by Country 2024 & 2032
- Figure 20: South America Macular Degeneration Treatment Market Volume (K Unit), by Country 2024 & 2032
- Figure 21: South America Macular Degeneration Treatment Market Revenue Share (%), by Country 2024 & 2032
- Figure 22: South America Macular Degeneration Treatment Market Volume Share (%), by Country 2024 & 2032
- Figure 23: North America Macular Degeneration Treatment Market Revenue (Million), by Type 2024 & 2032
- Figure 24: North America Macular Degeneration Treatment Market Volume (K Unit), by Type 2024 & 2032
- Figure 25: North America Macular Degeneration Treatment Market Revenue Share (%), by Type 2024 & 2032
- Figure 26: North America Macular Degeneration Treatment Market Volume Share (%), by Type 2024 & 2032
- Figure 27: North America Macular Degeneration Treatment Market Revenue (Million), by Stage of Disease 2024 & 2032
- Figure 28: North America Macular Degeneration Treatment Market Volume (K Unit), by Stage of Disease 2024 & 2032
- Figure 29: North America Macular Degeneration Treatment Market Revenue Share (%), by Stage of Disease 2024 & 2032
- Figure 30: North America Macular Degeneration Treatment Market Volume Share (%), by Stage of Disease 2024 & 2032
- Figure 31: North America Macular Degeneration Treatment Market Revenue (Million), by Treatment Type 2024 & 2032
- Figure 32: North America Macular Degeneration Treatment Market Volume (K Unit), by Treatment Type 2024 & 2032
- Figure 33: North America Macular Degeneration Treatment Market Revenue Share (%), by Treatment Type 2024 & 2032
- Figure 34: North America Macular Degeneration Treatment Market Volume Share (%), by Treatment Type 2024 & 2032
- Figure 35: North America Macular Degeneration Treatment Market Revenue (Million), by Route of Administration 2024 & 2032
- Figure 36: North America Macular Degeneration Treatment Market Volume (K Unit), by Route of Administration 2024 & 2032
- Figure 37: North America Macular Degeneration Treatment Market Revenue Share (%), by Route of Administration 2024 & 2032
- Figure 38: North America Macular Degeneration Treatment Market Volume Share (%), by Route of Administration 2024 & 2032
- Figure 39: North America Macular Degeneration Treatment Market Revenue (Million), by Sales Channel 2024 & 2032
- Figure 40: North America Macular Degeneration Treatment Market Volume (K Unit), by Sales Channel 2024 & 2032
- Figure 41: North America Macular Degeneration Treatment Market Revenue Share (%), by Sales Channel 2024 & 2032
- Figure 42: North America Macular Degeneration Treatment Market Volume Share (%), by Sales Channel 2024 & 2032
- Figure 43: North America Macular Degeneration Treatment Market Revenue (Million), by Country 2024 & 2032
- Figure 44: North America Macular Degeneration Treatment Market Volume (K Unit), by Country 2024 & 2032
- Figure 45: North America Macular Degeneration Treatment Market Revenue Share (%), by Country 2024 & 2032
- Figure 46: North America Macular Degeneration Treatment Market Volume Share (%), by Country 2024 & 2032
- Figure 47: Europe Macular Degeneration Treatment Market Revenue (Million), by Type 2024 & 2032
- Figure 48: Europe Macular Degeneration Treatment Market Volume (K Unit), by Type 2024 & 2032
- Figure 49: Europe Macular Degeneration Treatment Market Revenue Share (%), by Type 2024 & 2032
- Figure 50: Europe Macular Degeneration Treatment Market Volume Share (%), by Type 2024 & 2032
- Figure 51: Europe Macular Degeneration Treatment Market Revenue (Million), by Stage of Disease 2024 & 2032
- Figure 52: Europe Macular Degeneration Treatment Market Volume (K Unit), by Stage of Disease 2024 & 2032
- Figure 53: Europe Macular Degeneration Treatment Market Revenue Share (%), by Stage of Disease 2024 & 2032
- Figure 54: Europe Macular Degeneration Treatment Market Volume Share (%), by Stage of Disease 2024 & 2032
- Figure 55: Europe Macular Degeneration Treatment Market Revenue (Million), by Treatment Type 2024 & 2032
- Figure 56: Europe Macular Degeneration Treatment Market Volume (K Unit), by Treatment Type 2024 & 2032
- Figure 57: Europe Macular Degeneration Treatment Market Revenue Share (%), by Treatment Type 2024 & 2032
- Figure 58: Europe Macular Degeneration Treatment Market Volume Share (%), by Treatment Type 2024 & 2032
- Figure 59: Europe Macular Degeneration Treatment Market Revenue (Million), by Route of Administration 2024 & 2032
- Figure 60: Europe Macular Degeneration Treatment Market Volume (K Unit), by Route of Administration 2024 & 2032
- Figure 61: Europe Macular Degeneration Treatment Market Revenue Share (%), by Route of Administration 2024 & 2032
- Figure 62: Europe Macular Degeneration Treatment Market Volume Share (%), by Route of Administration 2024 & 2032
- Figure 63: Europe Macular Degeneration Treatment Market Revenue (Million), by Sales Channel 2024 & 2032
- Figure 64: Europe Macular Degeneration Treatment Market Volume (K Unit), by Sales Channel 2024 & 2032
- Figure 65: Europe Macular Degeneration Treatment Market Revenue Share (%), by Sales Channel 2024 & 2032
- Figure 66: Europe Macular Degeneration Treatment Market Volume Share (%), by Sales Channel 2024 & 2032
- Figure 67: Europe Macular Degeneration Treatment Market Revenue (Million), by Country 2024 & 2032
- Figure 68: Europe Macular Degeneration Treatment Market Volume (K Unit), by Country 2024 & 2032
- Figure 69: Europe Macular Degeneration Treatment Market Revenue Share (%), by Country 2024 & 2032
- Figure 70: Europe Macular Degeneration Treatment Market Volume Share (%), by Country 2024 & 2032
- Figure 71: Asia Pacific Macular Degeneration Treatment Market Revenue (Million), by Type 2024 & 2032
- Figure 72: Asia Pacific Macular Degeneration Treatment Market Volume (K Unit), by Type 2024 & 2032
- Figure 73: Asia Pacific Macular Degeneration Treatment Market Revenue Share (%), by Type 2024 & 2032
- Figure 74: Asia Pacific Macular Degeneration Treatment Market Volume Share (%), by Type 2024 & 2032
- Figure 75: Asia Pacific Macular Degeneration Treatment Market Revenue (Million), by Stage of Disease 2024 & 2032
- Figure 76: Asia Pacific Macular Degeneration Treatment Market Volume (K Unit), by Stage of Disease 2024 & 2032
- Figure 77: Asia Pacific Macular Degeneration Treatment Market Revenue Share (%), by Stage of Disease 2024 & 2032
- Figure 78: Asia Pacific Macular Degeneration Treatment Market Volume Share (%), by Stage of Disease 2024 & 2032
- Figure 79: Asia Pacific Macular Degeneration Treatment Market Revenue (Million), by Treatment Type 2024 & 2032
- Figure 80: Asia Pacific Macular Degeneration Treatment Market Volume (K Unit), by Treatment Type 2024 & 2032
- Figure 81: Asia Pacific Macular Degeneration Treatment Market Revenue Share (%), by Treatment Type 2024 & 2032
- Figure 82: Asia Pacific Macular Degeneration Treatment Market Volume Share (%), by Treatment Type 2024 & 2032
- Figure 83: Asia Pacific Macular Degeneration Treatment Market Revenue (Million), by Route of Administration 2024 & 2032
- Figure 84: Asia Pacific Macular Degeneration Treatment Market Volume (K Unit), by Route of Administration 2024 & 2032
- Figure 85: Asia Pacific Macular Degeneration Treatment Market Revenue Share (%), by Route of Administration 2024 & 2032
- Figure 86: Asia Pacific Macular Degeneration Treatment Market Volume Share (%), by Route of Administration 2024 & 2032
- Figure 87: Asia Pacific Macular Degeneration Treatment Market Revenue (Million), by Sales Channel 2024 & 2032
- Figure 88: Asia Pacific Macular Degeneration Treatment Market Volume (K Unit), by Sales Channel 2024 & 2032
- Figure 89: Asia Pacific Macular Degeneration Treatment Market Revenue Share (%), by Sales Channel 2024 & 2032
- Figure 90: Asia Pacific Macular Degeneration Treatment Market Volume Share (%), by Sales Channel 2024 & 2032
- Figure 91: Asia Pacific Macular Degeneration Treatment Market Revenue (Million), by Country 2024 & 2032
- Figure 92: Asia Pacific Macular Degeneration Treatment Market Volume (K Unit), by Country 2024 & 2032
- Figure 93: Asia Pacific Macular Degeneration Treatment Market Revenue Share (%), by Country 2024 & 2032
- Figure 94: Asia Pacific Macular Degeneration Treatment Market Volume Share (%), by Country 2024 & 2032
- Figure 95: Middle East and Africa Macular Degeneration Treatment Market Revenue (Million), by Type 2024 & 2032
- Figure 96: Middle East and Africa Macular Degeneration Treatment Market Volume (K Unit), by Type 2024 & 2032
- Figure 97: Middle East and Africa Macular Degeneration Treatment Market Revenue Share (%), by Type 2024 & 2032
- Figure 98: Middle East and Africa Macular Degeneration Treatment Market Volume Share (%), by Type 2024 & 2032
- Figure 99: Middle East and Africa Macular Degeneration Treatment Market Revenue (Million), by Stage of Disease 2024 & 2032
- Figure 100: Middle East and Africa Macular Degeneration Treatment Market Volume (K Unit), by Stage of Disease 2024 & 2032
- Figure 101: Middle East and Africa Macular Degeneration Treatment Market Revenue Share (%), by Stage of Disease 2024 & 2032
- Figure 102: Middle East and Africa Macular Degeneration Treatment Market Volume Share (%), by Stage of Disease 2024 & 2032
- Figure 103: Middle East and Africa Macular Degeneration Treatment Market Revenue (Million), by Treatment Type 2024 & 2032
- Figure 104: Middle East and Africa Macular Degeneration Treatment Market Volume (K Unit), by Treatment Type 2024 & 2032
- Figure 105: Middle East and Africa Macular Degeneration Treatment Market Revenue Share (%), by Treatment Type 2024 & 2032
- Figure 106: Middle East and Africa Macular Degeneration Treatment Market Volume Share (%), by Treatment Type 2024 & 2032
- Figure 107: Middle East and Africa Macular Degeneration Treatment Market Revenue (Million), by Route of Administration 2024 & 2032
- Figure 108: Middle East and Africa Macular Degeneration Treatment Market Volume (K Unit), by Route of Administration 2024 & 2032
- Figure 109: Middle East and Africa Macular Degeneration Treatment Market Revenue Share (%), by Route of Administration 2024 & 2032
- Figure 110: Middle East and Africa Macular Degeneration Treatment Market Volume Share (%), by Route of Administration 2024 & 2032
- Figure 111: Middle East and Africa Macular Degeneration Treatment Market Revenue (Million), by Sales Channel 2024 & 2032
- Figure 112: Middle East and Africa Macular Degeneration Treatment Market Volume (K Unit), by Sales Channel 2024 & 2032
- Figure 113: Middle East and Africa Macular Degeneration Treatment Market Revenue Share (%), by Sales Channel 2024 & 2032
- Figure 114: Middle East and Africa Macular Degeneration Treatment Market Volume Share (%), by Sales Channel 2024 & 2032
- Figure 115: Middle East and Africa Macular Degeneration Treatment Market Revenue (Million), by Country 2024 & 2032
- Figure 116: Middle East and Africa Macular Degeneration Treatment Market Volume (K Unit), by Country 2024 & 2032
- Figure 117: Middle East and Africa Macular Degeneration Treatment Market Revenue Share (%), by Country 2024 & 2032
- Figure 118: Middle East and Africa Macular Degeneration Treatment Market Volume Share (%), by Country 2024 & 2032
- Figure 119: South America Macular Degeneration Treatment Market Revenue (Million), by Type 2024 & 2032
- Figure 120: South America Macular Degeneration Treatment Market Volume (K Unit), by Type 2024 & 2032
- Figure 121: South America Macular Degeneration Treatment Market Revenue Share (%), by Type 2024 & 2032
- Figure 122: South America Macular Degeneration Treatment Market Volume Share (%), by Type 2024 & 2032
- Figure 123: South America Macular Degeneration Treatment Market Revenue (Million), by Stage of Disease 2024 & 2032
- Figure 124: South America Macular Degeneration Treatment Market Volume (K Unit), by Stage of Disease 2024 & 2032
- Figure 125: South America Macular Degeneration Treatment Market Revenue Share (%), by Stage of Disease 2024 & 2032
- Figure 126: South America Macular Degeneration Treatment Market Volume Share (%), by Stage of Disease 2024 & 2032
- Figure 127: South America Macular Degeneration Treatment Market Revenue (Million), by Treatment Type 2024 & 2032
- Figure 128: South America Macular Degeneration Treatment Market Volume (K Unit), by Treatment Type 2024 & 2032
- Figure 129: South America Macular Degeneration Treatment Market Revenue Share (%), by Treatment Type 2024 & 2032
- Figure 130: South America Macular Degeneration Treatment Market Volume Share (%), by Treatment Type 2024 & 2032
- Figure 131: South America Macular Degeneration Treatment Market Revenue (Million), by Route of Administration 2024 & 2032
- Figure 132: South America Macular Degeneration Treatment Market Volume (K Unit), by Route of Administration 2024 & 2032
- Figure 133: South America Macular Degeneration Treatment Market Revenue Share (%), by Route of Administration 2024 & 2032
- Figure 134: South America Macular Degeneration Treatment Market Volume Share (%), by Route of Administration 2024 & 2032
- Figure 135: South America Macular Degeneration Treatment Market Revenue (Million), by Sales Channel 2024 & 2032
- Figure 136: South America Macular Degeneration Treatment Market Volume (K Unit), by Sales Channel 2024 & 2032
- Figure 137: South America Macular Degeneration Treatment Market Revenue Share (%), by Sales Channel 2024 & 2032
- Figure 138: South America Macular Degeneration Treatment Market Volume Share (%), by Sales Channel 2024 & 2032
- Figure 139: South America Macular Degeneration Treatment Market Revenue (Million), by Country 2024 & 2032
- Figure 140: South America Macular Degeneration Treatment Market Volume (K Unit), by Country 2024 & 2032
- Figure 141: South America Macular Degeneration Treatment Market Revenue Share (%), by Country 2024 & 2032
- Figure 142: South America Macular Degeneration Treatment Market Volume Share (%), by Country 2024 & 2032
List of Tables
- Table 1: Global Macular Degeneration Treatment Market Revenue Million Forecast, by Region 2019 & 2032
- Table 2: Global Macular Degeneration Treatment Market Volume K Unit Forecast, by Region 2019 & 2032
- Table 3: Global Macular Degeneration Treatment Market Revenue Million Forecast, by Type 2019 & 2032
- Table 4: Global Macular Degeneration Treatment Market Volume K Unit Forecast, by Type 2019 & 2032
- Table 5: Global Macular Degeneration Treatment Market Revenue Million Forecast, by Stage of Disease 2019 & 2032
- Table 6: Global Macular Degeneration Treatment Market Volume K Unit Forecast, by Stage of Disease 2019 & 2032
- Table 7: Global Macular Degeneration Treatment Market Revenue Million Forecast, by Treatment Type 2019 & 2032
- Table 8: Global Macular Degeneration Treatment Market Volume K Unit Forecast, by Treatment Type 2019 & 2032
- Table 9: Global Macular Degeneration Treatment Market Revenue Million Forecast, by Route of Administration 2019 & 2032
- Table 10: Global Macular Degeneration Treatment Market Volume K Unit Forecast, by Route of Administration 2019 & 2032
- Table 11: Global Macular Degeneration Treatment Market Revenue Million Forecast, by Sales Channel 2019 & 2032
- Table 12: Global Macular Degeneration Treatment Market Volume K Unit Forecast, by Sales Channel 2019 & 2032
- Table 13: Global Macular Degeneration Treatment Market Revenue Million Forecast, by Region 2019 & 2032
- Table 14: Global Macular Degeneration Treatment Market Volume K Unit Forecast, by Region 2019 & 2032
- Table 15: Global Macular Degeneration Treatment Market Revenue Million Forecast, by Country 2019 & 2032
- Table 16: Global Macular Degeneration Treatment Market Volume K Unit Forecast, by Country 2019 & 2032
- Table 17: United States Macular Degeneration Treatment Market Revenue (Million) Forecast, by Application 2019 & 2032
- Table 18: United States Macular Degeneration Treatment Market Volume (K Unit) Forecast, by Application 2019 & 2032
- Table 19: Canada Macular Degeneration Treatment Market Revenue (Million) Forecast, by Application 2019 & 2032
- Table 20: Canada Macular Degeneration Treatment Market Volume (K Unit) Forecast, by Application 2019 & 2032
- Table 21: Mexico Macular Degeneration Treatment Market Revenue (Million) Forecast, by Application 2019 & 2032
- Table 22: Mexico Macular Degeneration Treatment Market Volume (K Unit) Forecast, by Application 2019 & 2032
- Table 23: Global Macular Degeneration Treatment Market Revenue Million Forecast, by Country 2019 & 2032
- Table 24: Global Macular Degeneration Treatment Market Volume K Unit Forecast, by Country 2019 & 2032
- Table 25: Germany Macular Degeneration Treatment Market Revenue (Million) Forecast, by Application 2019 & 2032
- Table 26: Germany Macular Degeneration Treatment Market Volume (K Unit) Forecast, by Application 2019 & 2032
- Table 27: United Kingdom Macular Degeneration Treatment Market Revenue (Million) Forecast, by Application 2019 & 2032
- Table 28: United Kingdom Macular Degeneration Treatment Market Volume (K Unit) Forecast, by Application 2019 & 2032
- Table 29: France Macular Degeneration Treatment Market Revenue (Million) Forecast, by Application 2019 & 2032
- Table 30: France Macular Degeneration Treatment Market Volume (K Unit) Forecast, by Application 2019 & 2032
- Table 31: Italy Macular Degeneration Treatment Market Revenue (Million) Forecast, by Application 2019 & 2032
- Table 32: Italy Macular Degeneration Treatment Market Volume (K Unit) Forecast, by Application 2019 & 2032
- Table 33: Spain Macular Degeneration Treatment Market Revenue (Million) Forecast, by Application 2019 & 2032
- Table 34: Spain Macular Degeneration Treatment Market Volume (K Unit) Forecast, by Application 2019 & 2032
- Table 35: Rest of Europe Macular Degeneration Treatment Market Revenue (Million) Forecast, by Application 2019 & 2032
- Table 36: Rest of Europe Macular Degeneration Treatment Market Volume (K Unit) Forecast, by Application 2019 & 2032
- Table 37: Global Macular Degeneration Treatment Market Revenue Million Forecast, by Country 2019 & 2032
- Table 38: Global Macular Degeneration Treatment Market Volume K Unit Forecast, by Country 2019 & 2032
- Table 39: China Macular Degeneration Treatment Market Revenue (Million) Forecast, by Application 2019 & 2032
- Table 40: China Macular Degeneration Treatment Market Volume (K Unit) Forecast, by Application 2019 & 2032
- Table 41: Japan Macular Degeneration Treatment Market Revenue (Million) Forecast, by Application 2019 & 2032
- Table 42: Japan Macular Degeneration Treatment Market Volume (K Unit) Forecast, by Application 2019 & 2032
- Table 43: India Macular Degeneration Treatment Market Revenue (Million) Forecast, by Application 2019 & 2032
- Table 44: India Macular Degeneration Treatment Market Volume (K Unit) Forecast, by Application 2019 & 2032
- Table 45: Australia Macular Degeneration Treatment Market Revenue (Million) Forecast, by Application 2019 & 2032
- Table 46: Australia Macular Degeneration Treatment Market Volume (K Unit) Forecast, by Application 2019 & 2032
- Table 47: South Korea Macular Degeneration Treatment Market Revenue (Million) Forecast, by Application 2019 & 2032
- Table 48: South Korea Macular Degeneration Treatment Market Volume (K Unit) Forecast, by Application 2019 & 2032
- Table 49: Rest of Asia Pacific Macular Degeneration Treatment Market Revenue (Million) Forecast, by Application 2019 & 2032
- Table 50: Rest of Asia Pacific Macular Degeneration Treatment Market Volume (K Unit) Forecast, by Application 2019 & 2032
- Table 51: Global Macular Degeneration Treatment Market Revenue Million Forecast, by Country 2019 & 2032
- Table 52: Global Macular Degeneration Treatment Market Volume K Unit Forecast, by Country 2019 & 2032
- Table 53: GCC Macular Degeneration Treatment Market Revenue (Million) Forecast, by Application 2019 & 2032
- Table 54: GCC Macular Degeneration Treatment Market Volume (K Unit) Forecast, by Application 2019 & 2032
- Table 55: South Africa Macular Degeneration Treatment Market Revenue (Million) Forecast, by Application 2019 & 2032
- Table 56: South Africa Macular Degeneration Treatment Market Volume (K Unit) Forecast, by Application 2019 & 2032
- Table 57: Rest of Middle East and Africa Macular Degeneration Treatment Market Revenue (Million) Forecast, by Application 2019 & 2032
- Table 58: Rest of Middle East and Africa Macular Degeneration Treatment Market Volume (K Unit) Forecast, by Application 2019 & 2032
- Table 59: Global Macular Degeneration Treatment Market Revenue Million Forecast, by Country 2019 & 2032
- Table 60: Global Macular Degeneration Treatment Market Volume K Unit Forecast, by Country 2019 & 2032
- Table 61: Brazil Macular Degeneration Treatment Market Revenue (Million) Forecast, by Application 2019 & 2032
- Table 62: Brazil Macular Degeneration Treatment Market Volume (K Unit) Forecast, by Application 2019 & 2032
- Table 63: Argentina Macular Degeneration Treatment Market Revenue (Million) Forecast, by Application 2019 & 2032
- Table 64: Argentina Macular Degeneration Treatment Market Volume (K Unit) Forecast, by Application 2019 & 2032
- Table 65: Rest of South America Macular Degeneration Treatment Market Revenue (Million) Forecast, by Application 2019 & 2032
- Table 66: Rest of South America Macular Degeneration Treatment Market Volume (K Unit) Forecast, by Application 2019 & 2032
- Table 67: Global Macular Degeneration Treatment Market Revenue Million Forecast, by Type 2019 & 2032
- Table 68: Global Macular Degeneration Treatment Market Volume K Unit Forecast, by Type 2019 & 2032
- Table 69: Global Macular Degeneration Treatment Market Revenue Million Forecast, by Stage of Disease 2019 & 2032
- Table 70: Global Macular Degeneration Treatment Market Volume K Unit Forecast, by Stage of Disease 2019 & 2032
- Table 71: Global Macular Degeneration Treatment Market Revenue Million Forecast, by Treatment Type 2019 & 2032
- Table 72: Global Macular Degeneration Treatment Market Volume K Unit Forecast, by Treatment Type 2019 & 2032
- Table 73: Global Macular Degeneration Treatment Market Revenue Million Forecast, by Route of Administration 2019 & 2032
- Table 74: Global Macular Degeneration Treatment Market Volume K Unit Forecast, by Route of Administration 2019 & 2032
- Table 75: Global Macular Degeneration Treatment Market Revenue Million Forecast, by Sales Channel 2019 & 2032
- Table 76: Global Macular Degeneration Treatment Market Volume K Unit Forecast, by Sales Channel 2019 & 2032
- Table 77: Global Macular Degeneration Treatment Market Revenue Million Forecast, by Country 2019 & 2032
- Table 78: Global Macular Degeneration Treatment Market Volume K Unit Forecast, by Country 2019 & 2032
- Table 79: United States Macular Degeneration Treatment Market Revenue (Million) Forecast, by Application 2019 & 2032
- Table 80: United States Macular Degeneration Treatment Market Volume (K Unit) Forecast, by Application 2019 & 2032
- Table 81: Canada Macular Degeneration Treatment Market Revenue (Million) Forecast, by Application 2019 & 2032
- Table 82: Canada Macular Degeneration Treatment Market Volume (K Unit) Forecast, by Application 2019 & 2032
- Table 83: Mexico Macular Degeneration Treatment Market Revenue (Million) Forecast, by Application 2019 & 2032
- Table 84: Mexico Macular Degeneration Treatment Market Volume (K Unit) Forecast, by Application 2019 & 2032
- Table 85: Global Macular Degeneration Treatment Market Revenue Million Forecast, by Type 2019 & 2032
- Table 86: Global Macular Degeneration Treatment Market Volume K Unit Forecast, by Type 2019 & 2032
- Table 87: Global Macular Degeneration Treatment Market Revenue Million Forecast, by Stage of Disease 2019 & 2032
- Table 88: Global Macular Degeneration Treatment Market Volume K Unit Forecast, by Stage of Disease 2019 & 2032
- Table 89: Global Macular Degeneration Treatment Market Revenue Million Forecast, by Treatment Type 2019 & 2032
- Table 90: Global Macular Degeneration Treatment Market Volume K Unit Forecast, by Treatment Type 2019 & 2032
- Table 91: Global Macular Degeneration Treatment Market Revenue Million Forecast, by Route of Administration 2019 & 2032
- Table 92: Global Macular Degeneration Treatment Market Volume K Unit Forecast, by Route of Administration 2019 & 2032
- Table 93: Global Macular Degeneration Treatment Market Revenue Million Forecast, by Sales Channel 2019 & 2032
- Table 94: Global Macular Degeneration Treatment Market Volume K Unit Forecast, by Sales Channel 2019 & 2032
- Table 95: Global Macular Degeneration Treatment Market Revenue Million Forecast, by Country 2019 & 2032
- Table 96: Global Macular Degeneration Treatment Market Volume K Unit Forecast, by Country 2019 & 2032
- Table 97: Germany Macular Degeneration Treatment Market Revenue (Million) Forecast, by Application 2019 & 2032
- Table 98: Germany Macular Degeneration Treatment Market Volume (K Unit) Forecast, by Application 2019 & 2032
- Table 99: United Kingdom Macular Degeneration Treatment Market Revenue (Million) Forecast, by Application 2019 & 2032
- Table 100: United Kingdom Macular Degeneration Treatment Market Volume (K Unit) Forecast, by Application 2019 & 2032
- Table 101: France Macular Degeneration Treatment Market Revenue (Million) Forecast, by Application 2019 & 2032
- Table 102: France Macular Degeneration Treatment Market Volume (K Unit) Forecast, by Application 2019 & 2032
- Table 103: Italy Macular Degeneration Treatment Market Revenue (Million) Forecast, by Application 2019 & 2032
- Table 104: Italy Macular Degeneration Treatment Market Volume (K Unit) Forecast, by Application 2019 & 2032
- Table 105: Spain Macular Degeneration Treatment Market Revenue (Million) Forecast, by Application 2019 & 2032
- Table 106: Spain Macular Degeneration Treatment Market Volume (K Unit) Forecast, by Application 2019 & 2032
- Table 107: Rest of Europe Macular Degeneration Treatment Market Revenue (Million) Forecast, by Application 2019 & 2032
- Table 108: Rest of Europe Macular Degeneration Treatment Market Volume (K Unit) Forecast, by Application 2019 & 2032
- Table 109: Global Macular Degeneration Treatment Market Revenue Million Forecast, by Type 2019 & 2032
- Table 110: Global Macular Degeneration Treatment Market Volume K Unit Forecast, by Type 2019 & 2032
- Table 111: Global Macular Degeneration Treatment Market Revenue Million Forecast, by Stage of Disease 2019 & 2032
- Table 112: Global Macular Degeneration Treatment Market Volume K Unit Forecast, by Stage of Disease 2019 & 2032
- Table 113: Global Macular Degeneration Treatment Market Revenue Million Forecast, by Treatment Type 2019 & 2032
- Table 114: Global Macular Degeneration Treatment Market Volume K Unit Forecast, by Treatment Type 2019 & 2032
- Table 115: Global Macular Degeneration Treatment Market Revenue Million Forecast, by Route of Administration 2019 & 2032
- Table 116: Global Macular Degeneration Treatment Market Volume K Unit Forecast, by Route of Administration 2019 & 2032
- Table 117: Global Macular Degeneration Treatment Market Revenue Million Forecast, by Sales Channel 2019 & 2032
- Table 118: Global Macular Degeneration Treatment Market Volume K Unit Forecast, by Sales Channel 2019 & 2032
- Table 119: Global Macular Degeneration Treatment Market Revenue Million Forecast, by Country 2019 & 2032
- Table 120: Global Macular Degeneration Treatment Market Volume K Unit Forecast, by Country 2019 & 2032
- Table 121: China Macular Degeneration Treatment Market Revenue (Million) Forecast, by Application 2019 & 2032
- Table 122: China Macular Degeneration Treatment Market Volume (K Unit) Forecast, by Application 2019 & 2032
- Table 123: Japan Macular Degeneration Treatment Market Revenue (Million) Forecast, by Application 2019 & 2032
- Table 124: Japan Macular Degeneration Treatment Market Volume (K Unit) Forecast, by Application 2019 & 2032
- Table 125: India Macular Degeneration Treatment Market Revenue (Million) Forecast, by Application 2019 & 2032
- Table 126: India Macular Degeneration Treatment Market Volume (K Unit) Forecast, by Application 2019 & 2032
- Table 127: Australia Macular Degeneration Treatment Market Revenue (Million) Forecast, by Application 2019 & 2032
- Table 128: Australia Macular Degeneration Treatment Market Volume (K Unit) Forecast, by Application 2019 & 2032
- Table 129: South Korea Macular Degeneration Treatment Market Revenue (Million) Forecast, by Application 2019 & 2032
- Table 130: South Korea Macular Degeneration Treatment Market Volume (K Unit) Forecast, by Application 2019 & 2032
- Table 131: Rest of Asia Pacific Macular Degeneration Treatment Market Revenue (Million) Forecast, by Application 2019 & 2032
- Table 132: Rest of Asia Pacific Macular Degeneration Treatment Market Volume (K Unit) Forecast, by Application 2019 & 2032
- Table 133: Global Macular Degeneration Treatment Market Revenue Million Forecast, by Type 2019 & 2032
- Table 134: Global Macular Degeneration Treatment Market Volume K Unit Forecast, by Type 2019 & 2032
- Table 135: Global Macular Degeneration Treatment Market Revenue Million Forecast, by Stage of Disease 2019 & 2032
- Table 136: Global Macular Degeneration Treatment Market Volume K Unit Forecast, by Stage of Disease 2019 & 2032
- Table 137: Global Macular Degeneration Treatment Market Revenue Million Forecast, by Treatment Type 2019 & 2032
- Table 138: Global Macular Degeneration Treatment Market Volume K Unit Forecast, by Treatment Type 2019 & 2032
- Table 139: Global Macular Degeneration Treatment Market Revenue Million Forecast, by Route of Administration 2019 & 2032
- Table 140: Global Macular Degeneration Treatment Market Volume K Unit Forecast, by Route of Administration 2019 & 2032
- Table 141: Global Macular Degeneration Treatment Market Revenue Million Forecast, by Sales Channel 2019 & 2032
- Table 142: Global Macular Degeneration Treatment Market Volume K Unit Forecast, by Sales Channel 2019 & 2032
- Table 143: Global Macular Degeneration Treatment Market Revenue Million Forecast, by Country 2019 & 2032
- Table 144: Global Macular Degeneration Treatment Market Volume K Unit Forecast, by Country 2019 & 2032
- Table 145: GCC Macular Degeneration Treatment Market Revenue (Million) Forecast, by Application 2019 & 2032
- Table 146: GCC Macular Degeneration Treatment Market Volume (K Unit) Forecast, by Application 2019 & 2032
- Table 147: South Africa Macular Degeneration Treatment Market Revenue (Million) Forecast, by Application 2019 & 2032
- Table 148: South Africa Macular Degeneration Treatment Market Volume (K Unit) Forecast, by Application 2019 & 2032
- Table 149: Rest of Middle East and Africa Macular Degeneration Treatment Market Revenue (Million) Forecast, by Application 2019 & 2032
- Table 150: Rest of Middle East and Africa Macular Degeneration Treatment Market Volume (K Unit) Forecast, by Application 2019 & 2032
- Table 151: Global Macular Degeneration Treatment Market Revenue Million Forecast, by Type 2019 & 2032
- Table 152: Global Macular Degeneration Treatment Market Volume K Unit Forecast, by Type 2019 & 2032
- Table 153: Global Macular Degeneration Treatment Market Revenue Million Forecast, by Stage of Disease 2019 & 2032
- Table 154: Global Macular Degeneration Treatment Market Volume K Unit Forecast, by Stage of Disease 2019 & 2032
- Table 155: Global Macular Degeneration Treatment Market Revenue Million Forecast, by Treatment Type 2019 & 2032
- Table 156: Global Macular Degeneration Treatment Market Volume K Unit Forecast, by Treatment Type 2019 & 2032
- Table 157: Global Macular Degeneration Treatment Market Revenue Million Forecast, by Route of Administration 2019 & 2032
- Table 158: Global Macular Degeneration Treatment Market Volume K Unit Forecast, by Route of Administration 2019 & 2032
- Table 159: Global Macular Degeneration Treatment Market Revenue Million Forecast, by Sales Channel 2019 & 2032
- Table 160: Global Macular Degeneration Treatment Market Volume K Unit Forecast, by Sales Channel 2019 & 2032
- Table 161: Global Macular Degeneration Treatment Market Revenue Million Forecast, by Country 2019 & 2032
- Table 162: Global Macular Degeneration Treatment Market Volume K Unit Forecast, by Country 2019 & 2032
- Table 163: Brazil Macular Degeneration Treatment Market Revenue (Million) Forecast, by Application 2019 & 2032
- Table 164: Brazil Macular Degeneration Treatment Market Volume (K Unit) Forecast, by Application 2019 & 2032
- Table 165: Argentina Macular Degeneration Treatment Market Revenue (Million) Forecast, by Application 2019 & 2032
- Table 166: Argentina Macular Degeneration Treatment Market Volume (K Unit) Forecast, by Application 2019 & 2032
- Table 167: Rest of South America Macular Degeneration Treatment Market Revenue (Million) Forecast, by Application 2019 & 2032
- Table 168: Rest of South America Macular Degeneration Treatment Market Volume (K Unit) Forecast, by Application 2019 & 2032
Frequently Asked Questions
1. What is the projected Compound Annual Growth Rate (CAGR) of the Macular Degeneration Treatment Market?
The projected CAGR is approximately 8.51%.
2. Which companies are prominent players in the Macular Degeneration Treatment Market?
Key companies in the market include REGENXBIO Inc, Regeneron Pharmaceuticals Inc, Bayer AG, Novartis AG, Lineage Cell Therapeutics, Panoptica, Oxurion, F Hoffmann-La Roche Ltd, Clover Therapeutics, Aerie Pharmaceutical Inc, ONL Therapeutics, MeiraGTx, Ocugen Inc, Bausch Health Companies Inc, Pfizer Inc.
3. What are the main segments of the Macular Degeneration Treatment Market?
The market segments include Type, Stage of Disease, Treatment Type, Route of Administration, Sales Channel.
4. Can you provide details about the market size?
The market size is estimated to be USD 15.47 Million as of 2022.
5. What are some drivers contributing to market growth?
Increasing Burden of Retinal Disorders; Upsurge in the Geriatric Population; Increase in Research and Development Investments.
6. What are the notable trends driving market growth?
Wet Age-related Macular Degeneration is Expected to Hold Significant Market Share Over the Forecast Period.
7. Are there any restraints impacting market growth?
Increasing Use of Off-label Drugs; Lack of Awareness Regarding AMD.
8. Can you provide examples of recent developments in the market?
In November 2022, IVERIC bio, Inc. submitted the first part of its NDA to the US FDA for a rolling review of avacincaptad pegol a novel investigational complement C5 inhibitor, for the treatment of geographic atrophy (GA) secondary to Age-Related Macular Degeneration (AMD).
9. What pricing options are available for accessing the report?
Pricing options include single-user, multi-user, and enterprise licenses priced at USD 4750, USD 5250, and USD 8750 respectively.
10. Is the market size provided in terms of value or volume?
The market size is provided in terms of value, measured in Million and volume, measured in K Unit.
11. Are there any specific market keywords associated with the report?
Yes, the market keyword associated with the report is "Macular Degeneration Treatment Market," which aids in identifying and referencing the specific market segment covered.
12. How do I determine which pricing option suits my needs best?
The pricing options vary based on user requirements and access needs. Individual users may opt for single-user licenses, while businesses requiring broader access may choose multi-user or enterprise licenses for cost-effective access to the report.
13. Are there any additional resources or data provided in the Macular Degeneration Treatment Market report?
While the report offers comprehensive insights, it's advisable to review the specific contents or supplementary materials provided to ascertain if additional resources or data are available.
14. How can I stay updated on further developments or reports in the Macular Degeneration Treatment Market?
To stay informed about further developments, trends, and reports in the Macular Degeneration Treatment Market, consider subscribing to industry newsletters, following relevant companies and organizations, or regularly checking reputable industry news sources and publications.
Methodology
Step 1 - Identification of Relevant Samples Size from Population Database


Step 2 - Approaches for Defining Global Market Size (Value, Volume* & Price*)

Note*: In applicable scenarios
Step 3 - Data Sources
Primary Research
- Web Analytics
- Survey Reports
- Research Institute
- Latest Research Reports
- Opinion Leaders
Secondary Research
- Annual Reports
- White Paper
- Latest Press Release
- Industry Association
- Paid Database
- Investor Presentations

Step 4 - Data Triangulation
Involves using different sources of information in order to increase the validity of a study
These sources are likely to be stakeholders in a program - participants, other researchers, program staff, other community members, and so on.
Then we put all data in single framework & apply various statistical tools to find out the dynamic on the market.
During the analysis stage, feedback from the stakeholder groups would be compared to determine areas of agreement as well as areas of divergence


