
Key Insights
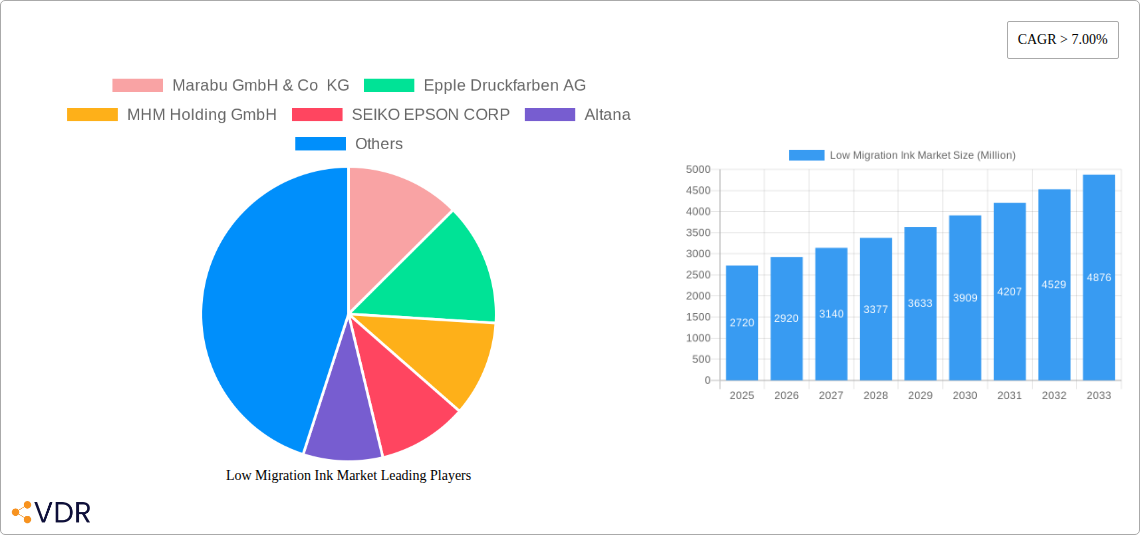
The global low migration ink market, valued at $2.72 billion in 2025, is projected to experience robust growth, exhibiting a Compound Annual Growth Rate (CAGR) exceeding 7% from 2025 to 2033. This expansion is driven by several key factors. The increasing demand for safe and sustainable packaging solutions in the food and beverage, pharmaceutical, and personal care sectors is a primary catalyst. Consumers are increasingly conscious of potential chemical migration from packaging into their products, pushing manufacturers to adopt low migration inks that ensure product safety and maintain brand reputation. Furthermore, stringent regulatory frameworks globally are compelling companies to comply with stricter regulations concerning food contact materials, further accelerating the adoption of low migration inks. Technological advancements in ink formulations, offering improved performance and reduced migration levels, also contribute to market growth. The rise of digital printing technologies offers higher precision and control, providing another impetus for growth within specific segments.
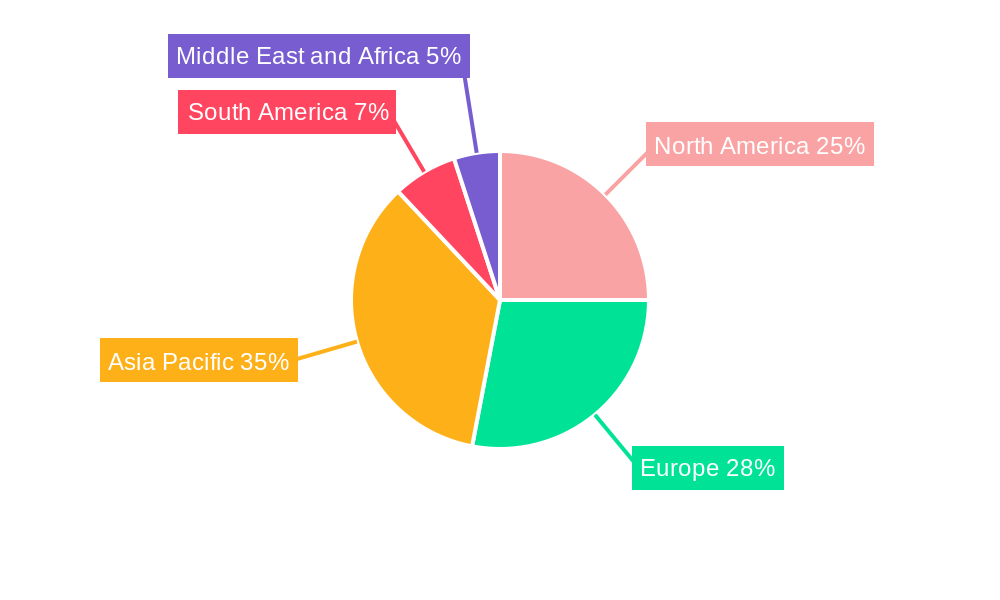
The market segmentation reveals significant opportunities across various printing processes and end-user industries. Gravure printing, a dominant method for flexible packaging, holds a substantial market share, while digital and flexography are gaining traction due to their versatility and shorter lead times. The personal care and pharmaceutical sectors are key end-users, demanding high-quality, safe inks for packaging that meet rigorous safety standards. The food and beverage industry, driven by heightened consumer awareness, is also experiencing significant growth in its adoption of low migration inks. Geographic analysis indicates strong growth in Asia-Pacific, fueled by expanding economies and increasing demand for packaged goods, followed by North America and Europe, where stringent regulations and strong consumer preference for sustainable products are key drivers. Competitive analysis reveals a landscape featuring both established players and emerging companies, leading to ongoing innovation and price competition.
Low Migration Ink Market: A Comprehensive Report (2019-2033)
This comprehensive report provides an in-depth analysis of the Low Migration Ink market, encompassing market dynamics, growth trends, regional dominance, product landscape, and key players. The report covers the period from 2019 to 2033, with a base year of 2025 and a forecast period from 2025 to 2033. This crucial market intelligence is essential for industry professionals seeking to understand and capitalize on the opportunities within the parent market of Printing Inks and the child market of Low Migration Inks. The global market size is projected to reach xx Million units by 2033.
Low Migration Ink Market Dynamics & Structure
The Low Migration Ink market is characterized by moderate concentration, with several key players holding significant market share. Technological innovation, driven by the increasing demand for food-safe and pharmaceutical-grade packaging, is a key growth driver. Stringent regulatory frameworks concerning food safety and environmental concerns are shaping market trends. Competitive pressure from alternative printing technologies and inks exists, but the inherent safety and regulatory compliance benefits of low migration inks provide a strong competitive advantage. Mergers and acquisitions (M&A) are increasingly common, with xx deals recorded between 2019 and 2024, resulting in a consolidation of market players. End-user demographics, particularly the growing demand from the food and beverage and pharmaceutical sectors, significantly impact market growth.
- Market Concentration: Moderately concentrated, with top 5 players holding approximately xx% market share in 2024.
- Innovation Drivers: Stringent food safety regulations, demand for sustainable packaging solutions.
- Regulatory Framework: Stringent regulations concerning migration limits in various regions.
- Competitive Substitutes: Conventional inks, alternative printing technologies.
- M&A Trends: Increasing consolidation through acquisitions and partnerships.
- Innovation Barriers: High R&D costs, stringent regulatory approvals.
Low Migration Ink Market Growth Trends & Insights
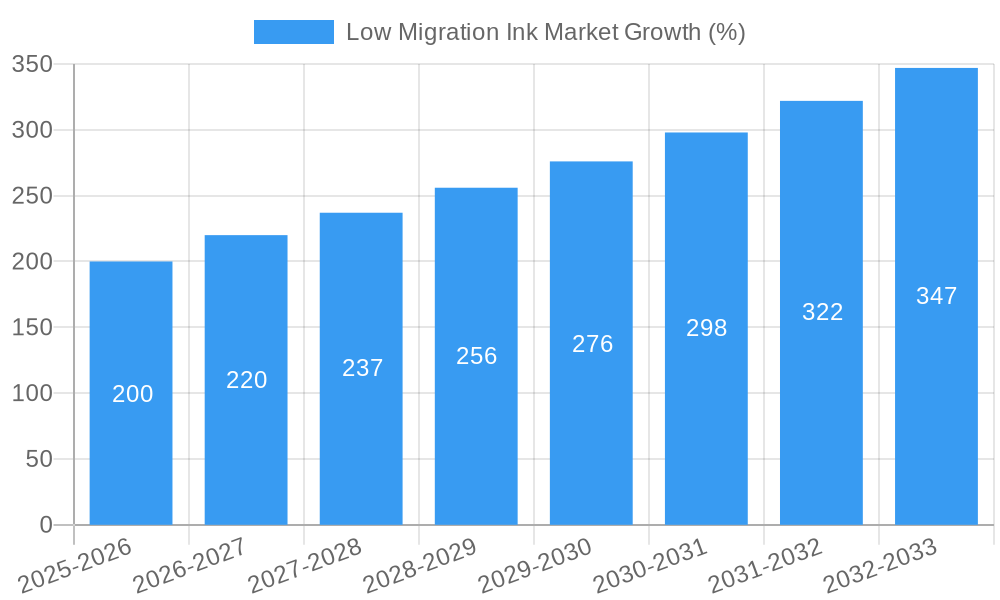
The Low Migration Ink market has experienced steady growth over the historical period (2019-2024), driven by increasing consumer awareness of food safety and the growing demand for sustainable packaging. The market size expanded from xx Million units in 2019 to xx Million units in 2024, exhibiting a CAGR of xx%. This growth trajectory is expected to continue during the forecast period (2025-2033), with a projected CAGR of xx%, reaching xx Million units by 2033. Technological disruptions, particularly the development of AI-assisted ink formulation and sustainable production processes, are accelerating market adoption. Consumer behavior shifts towards healthier and more sustainable products are further contributing to the market's expansion. The market penetration rate is currently estimated at xx% and is expected to reach xx% by 2033.
Dominant Regions, Countries, or Segments in Low Migration Ink Market
Western Europe and North America currently dominate the Low Migration Ink market, driven by stringent food safety regulations and a high concentration of major food and pharmaceutical companies. Within printing processes, Flexography and Offset printing segments account for the largest market share (xx% and xx%, respectively in 2024), while within end-user industries, the Food and Beverage sector shows the most substantial growth potential, projected to account for xx% of the market by 2033. Asia-Pacific is expected to witness significant growth due to increasing economic development and rising demand for packaged goods.
- Key Drivers (Western Europe & North America): Stringent regulations, strong consumer demand, high adoption rates.
- Key Drivers (Asia-Pacific): Rising disposable incomes, growing food and beverage industry, expanding manufacturing sector.
- Dominant Segment (Printing Process): Flexography and Offset printing.
- Dominant Segment (End-user Industry): Food and Beverage.
Low Migration Ink Market Product Landscape
Low migration inks are characterized by their exceptional safety and performance characteristics, ensuring minimal migration of ink components into packaged goods. Innovation focuses on developing ultra-low-migration inks with enhanced color strength, durability, and printability. These inks are suitable for various applications, including food packaging, pharmaceuticals, and personal care products. Recent advancements include improved UV resistance and reduced VOC emissions, catering to environmental sustainability concerns. Unique selling propositions center on safety certifications, high-performance properties, and compliance with stringent industry standards.
Key Drivers, Barriers & Challenges in Low Migration Ink Market
Key Drivers:
- Growing demand for safe food packaging.
- Increasing focus on sustainable packaging solutions.
- Stringent regulations concerning ink migration limits.
- Advancements in ink formulation technologies.
Challenges & Restraints:
- High R&D costs associated with developing new ultra-low-migration inks.
- Complex regulatory approval processes for new ink formulations, causing delays in product launch (estimated xx% of new product delays attributed to regulatory hurdles).
- Fluctuations in raw material prices impacting production costs.
- Intense competition among established ink manufacturers.
Emerging Opportunities in Low Migration Ink Market
Emerging opportunities lie in untapped markets like developing economies with growing packaged goods sectors. The development of bio-based and biodegradable low migration inks represents a significant opportunity. Furthermore, increasing demand for inks suitable for flexible packaging, digital printing, and specialized applications presents significant growth potential. Customization options for specific applications and product requirements can also drive market expansion.
Growth Accelerators in the Low Migration Ink Market Industry
Technological breakthroughs, particularly in AI-assisted ink formulation, are significantly accelerating market growth. Strategic partnerships between ink manufacturers and packaging companies enhance product development and market penetration. Expansion strategies focused on developing markets and diversification into specialized application areas provide opportunities for sustained growth. Investments in sustainable production processes will further boost market appeal and environmental compliance.
Key Players Shaping the Low Migration Ink Market Market
- Marabu GmbH & Co KG
- Epple Druckfarben AG
- MHM Holding GmbH
- SEIKO EPSON CORP
- Altana
- Sun Chemical
- TOYO INK CO LTD
- FUJIFILM Corporation
- HAPA AG
- HP Development Company L P
- Encres Dubuit
- Wikoff Color Corporation
- Siegwerk Druckfarben AG & Co KGaA
- INX International Ink Co
- hubergroup Deutschland GmbH
- Kao Collins Corporation
- SPGPrints B V
- Flint Group
- Agfa-Gevaert Group
- RUCO Druckfarben
Notable Milestones in Low Migration Ink Market Sector
- 2021 Q3: Launch of a new ultra-low-migration ink series by Sun Chemical.
- 2022 Q1: Acquisition of a smaller ink manufacturer by Flint Group, expanding its product portfolio.
- 2023 Q2: Introduction of AI-assisted ink formulation technology by Altana.
- 2024 Q4: Significant investment in sustainable ink production announced by TOYO INK CO LTD.
In-Depth Low Migration Ink Market Market Outlook
The future of the Low Migration Ink market is promising, driven by continued growth in the food and beverage and pharmaceutical sectors, along with increasing consumer awareness and stricter regulations. Strategic partnerships, technological advancements, and expansion into new markets will significantly contribute to sustained growth. Opportunities exist for manufacturers focusing on sustainability, high-performance inks, and customized solutions for niche applications. The market is poised for considerable expansion, presenting attractive opportunities for both established players and new entrants.
Low Migration Ink Market Segmentation
-
1. Printing Process
- 1.1. Gravure
- 1.2. Digital
- 1.3. Offset
- 1.4. Flexography
-
2. End-user Industry
- 2.1. Personal Care
- 2.2. Pharmaceuticals
- 2.3. Food and Beverage
- 2.4. Others
Low Migration Ink Market Segmentation By Geography
-
1. Asia Pacific
- 1.1. China
- 1.2. India
- 1.3. Japan
- 1.4. South Korea
- 1.5. Rest of Asia Pacific
-
2. North America
- 2.1. United States
- 2.2. Canada
- 2.3. Mexico
-
3. Europe
- 3.1. Germany
- 3.2. United Kingdom
- 3.3. France
- 3.4. Italy
- 3.5. Rest of Europe
-
4. South America
- 4.1. Brazil
- 4.2. Argentina
- 4.3. Rest of South America
-
5. Middle East and Africa
- 5.1. Saudi Arabia
- 5.2. South Africa
- 5.3. Rest of Middle East and Africa
Low Migration Ink Market REPORT HIGHLIGHTS
| Aspects | Details |
|---|---|
| Study Period | 2019-2033 |
| Base Year | 2024 |
| Estimated Year | 2025 |
| Forecast Period | 2025-2033 |
| Historical Period | 2019-2024 |
| Growth Rate | CAGR of > 7.00% from 2019-2033 |
| Segmentation |
|
Table of Contents
- 1. Introduction
- 1.1. Research Scope
- 1.2. Market Segmentation
- 1.3. Research Methodology
- 1.4. Definitions and Assumptions
- 2. Executive Summary
- 2.1. Introduction
- 3. Market Dynamics
- 3.1. Introduction
- 3.2. Market Drivers
- 3.2.1. ; Significant Growth in Food and Beverage Industry; Rise in Demand for Personal Care Products
- 3.3. Market Restrains
- 3.3.1. ; High Cost Compared to Conventional Inks; Unfavorable Conditions Arising Due to COVID-19 Outbreak
- 3.4. Market Trends
- 3.4.1. Significant Growth in Food and Beverage Industry
- 4. Market Factor Analysis
- 4.1. Porters Five Forces
- 4.2. Supply/Value Chain
- 4.3. PESTEL analysis
- 4.4. Market Entropy
- 4.5. Patent/Trademark Analysis
- 5. Global Low Migration Ink Market Analysis, Insights and Forecast, 2019-2031
- 5.1. Market Analysis, Insights and Forecast - by Printing Process
- 5.1.1. Gravure
- 5.1.2. Digital
- 5.1.3. Offset
- 5.1.4. Flexography
- 5.2. Market Analysis, Insights and Forecast - by End-user Industry
- 5.2.1. Personal Care
- 5.2.2. Pharmaceuticals
- 5.2.3. Food and Beverage
- 5.2.4. Others
- 5.3. Market Analysis, Insights and Forecast - by Region
- 5.3.1. Asia Pacific
- 5.3.2. North America
- 5.3.3. Europe
- 5.3.4. South America
- 5.3.5. Middle East and Africa
- 5.1. Market Analysis, Insights and Forecast - by Printing Process
- 6. Asia Pacific Low Migration Ink Market Analysis, Insights and Forecast, 2019-2031
- 6.1. Market Analysis, Insights and Forecast - by Printing Process
- 6.1.1. Gravure
- 6.1.2. Digital
- 6.1.3. Offset
- 6.1.4. Flexography
- 6.2. Market Analysis, Insights and Forecast - by End-user Industry
- 6.2.1. Personal Care
- 6.2.2. Pharmaceuticals
- 6.2.3. Food and Beverage
- 6.2.4. Others
- 6.1. Market Analysis, Insights and Forecast - by Printing Process
- 7. North America Low Migration Ink Market Analysis, Insights and Forecast, 2019-2031
- 7.1. Market Analysis, Insights and Forecast - by Printing Process
- 7.1.1. Gravure
- 7.1.2. Digital
- 7.1.3. Offset
- 7.1.4. Flexography
- 7.2. Market Analysis, Insights and Forecast - by End-user Industry
- 7.2.1. Personal Care
- 7.2.2. Pharmaceuticals
- 7.2.3. Food and Beverage
- 7.2.4. Others
- 7.1. Market Analysis, Insights and Forecast - by Printing Process
- 8. Europe Low Migration Ink Market Analysis, Insights and Forecast, 2019-2031
- 8.1. Market Analysis, Insights and Forecast - by Printing Process
- 8.1.1. Gravure
- 8.1.2. Digital
- 8.1.3. Offset
- 8.1.4. Flexography
- 8.2. Market Analysis, Insights and Forecast - by End-user Industry
- 8.2.1. Personal Care
- 8.2.2. Pharmaceuticals
- 8.2.3. Food and Beverage
- 8.2.4. Others
- 8.1. Market Analysis, Insights and Forecast - by Printing Process
- 9. South America Low Migration Ink Market Analysis, Insights and Forecast, 2019-2031
- 9.1. Market Analysis, Insights and Forecast - by Printing Process
- 9.1.1. Gravure
- 9.1.2. Digital
- 9.1.3. Offset
- 9.1.4. Flexography
- 9.2. Market Analysis, Insights and Forecast - by End-user Industry
- 9.2.1. Personal Care
- 9.2.2. Pharmaceuticals
- 9.2.3. Food and Beverage
- 9.2.4. Others
- 9.1. Market Analysis, Insights and Forecast - by Printing Process
- 10. Middle East and Africa Low Migration Ink Market Analysis, Insights and Forecast, 2019-2031
- 10.1. Market Analysis, Insights and Forecast - by Printing Process
- 10.1.1. Gravure
- 10.1.2. Digital
- 10.1.3. Offset
- 10.1.4. Flexography
- 10.2. Market Analysis, Insights and Forecast - by End-user Industry
- 10.2.1. Personal Care
- 10.2.2. Pharmaceuticals
- 10.2.3. Food and Beverage
- 10.2.4. Others
- 10.1. Market Analysis, Insights and Forecast - by Printing Process
- 11. Asia Pacific Low Migration Ink Market Analysis, Insights and Forecast, 2019-2031
- 11.1. Market Analysis, Insights and Forecast - By Country/Sub-region
- 11.1.1 China
- 11.1.2 India
- 11.1.3 Japan
- 11.1.4 South Korea
- 11.1.5 Rest of Asia Pacific
- 12. North America Low Migration Ink Market Analysis, Insights and Forecast, 2019-2031
- 12.1. Market Analysis, Insights and Forecast - By Country/Sub-region
- 12.1.1 United States
- 12.1.2 Canada
- 12.1.3 Mexico
- 13. Europe Low Migration Ink Market Analysis, Insights and Forecast, 2019-2031
- 13.1. Market Analysis, Insights and Forecast - By Country/Sub-region
- 13.1.1 Germany
- 13.1.2 United Kingdom
- 13.1.3 France
- 13.1.4 Italy
- 13.1.5 Rest of Europe
- 14. South America Low Migration Ink Market Analysis, Insights and Forecast, 2019-2031
- 14.1. Market Analysis, Insights and Forecast - By Country/Sub-region
- 14.1.1 Brazil
- 14.1.2 Argentina
- 14.1.3 Rest of South America
- 15. Middle East and Africa Low Migration Ink Market Analysis, Insights and Forecast, 2019-2031
- 15.1. Market Analysis, Insights and Forecast - By Country/Sub-region
- 15.1.1 Saudi Arabia
- 15.1.2 South Africa
- 15.1.3 Rest of Middle East and Africa
- 16. Competitive Analysis
- 16.1. Global Market Share Analysis 2024
- 16.2. Company Profiles
- 16.2.1 Marabu GmbH & Co KG
- 16.2.1.1. Overview
- 16.2.1.2. Products
- 16.2.1.3. SWOT Analysis
- 16.2.1.4. Recent Developments
- 16.2.1.5. Financials (Based on Availability)
- 16.2.2 Epple Druckfarben AG
- 16.2.2.1. Overview
- 16.2.2.2. Products
- 16.2.2.3. SWOT Analysis
- 16.2.2.4. Recent Developments
- 16.2.2.5. Financials (Based on Availability)
- 16.2.3 MHM Holding GmbH
- 16.2.3.1. Overview
- 16.2.3.2. Products
- 16.2.3.3. SWOT Analysis
- 16.2.3.4. Recent Developments
- 16.2.3.5. Financials (Based on Availability)
- 16.2.4 SEIKO EPSON CORP
- 16.2.4.1. Overview
- 16.2.4.2. Products
- 16.2.4.3. SWOT Analysis
- 16.2.4.4. Recent Developments
- 16.2.4.5. Financials (Based on Availability)
- 16.2.5 Altana
- 16.2.5.1. Overview
- 16.2.5.2. Products
- 16.2.5.3. SWOT Analysis
- 16.2.5.4. Recent Developments
- 16.2.5.5. Financials (Based on Availability)
- 16.2.6 Sun Chemical
- 16.2.6.1. Overview
- 16.2.6.2. Products
- 16.2.6.3. SWOT Analysis
- 16.2.6.4. Recent Developments
- 16.2.6.5. Financials (Based on Availability)
- 16.2.7 TOYO INK CO LTD
- 16.2.7.1. Overview
- 16.2.7.2. Products
- 16.2.7.3. SWOT Analysis
- 16.2.7.4. Recent Developments
- 16.2.7.5. Financials (Based on Availability)
- 16.2.8 FUJIFILM Corporation
- 16.2.8.1. Overview
- 16.2.8.2. Products
- 16.2.8.3. SWOT Analysis
- 16.2.8.4. Recent Developments
- 16.2.8.5. Financials (Based on Availability)
- 16.2.9 HAPA AG
- 16.2.9.1. Overview
- 16.2.9.2. Products
- 16.2.9.3. SWOT Analysis
- 16.2.9.4. Recent Developments
- 16.2.9.5. Financials (Based on Availability)
- 16.2.10 HP Development Company L P
- 16.2.10.1. Overview
- 16.2.10.2. Products
- 16.2.10.3. SWOT Analysis
- 16.2.10.4. Recent Developments
- 16.2.10.5. Financials (Based on Availability)
- 16.2.11 Encres Dubuit
- 16.2.11.1. Overview
- 16.2.11.2. Products
- 16.2.11.3. SWOT Analysis
- 16.2.11.4. Recent Developments
- 16.2.11.5. Financials (Based on Availability)
- 16.2.12 Wikoff Color Corporation*List Not Exhaustive
- 16.2.12.1. Overview
- 16.2.12.2. Products
- 16.2.12.3. SWOT Analysis
- 16.2.12.4. Recent Developments
- 16.2.12.5. Financials (Based on Availability)
- 16.2.13 Siegwerk Druckfarben AG & Co KGaA
- 16.2.13.1. Overview
- 16.2.13.2. Products
- 16.2.13.3. SWOT Analysis
- 16.2.13.4. Recent Developments
- 16.2.13.5. Financials (Based on Availability)
- 16.2.14 INX International Ink Co
- 16.2.14.1. Overview
- 16.2.14.2. Products
- 16.2.14.3. SWOT Analysis
- 16.2.14.4. Recent Developments
- 16.2.14.5. Financials (Based on Availability)
- 16.2.15 hubergroup Deutschland GmbH
- 16.2.15.1. Overview
- 16.2.15.2. Products
- 16.2.15.3. SWOT Analysis
- 16.2.15.4. Recent Developments
- 16.2.15.5. Financials (Based on Availability)
- 16.2.16 Kao Collins Corporation
- 16.2.16.1. Overview
- 16.2.16.2. Products
- 16.2.16.3. SWOT Analysis
- 16.2.16.4. Recent Developments
- 16.2.16.5. Financials (Based on Availability)
- 16.2.17 SPGPrints B V
- 16.2.17.1. Overview
- 16.2.17.2. Products
- 16.2.17.3. SWOT Analysis
- 16.2.17.4. Recent Developments
- 16.2.17.5. Financials (Based on Availability)
- 16.2.18 Flint Group
- 16.2.18.1. Overview
- 16.2.18.2. Products
- 16.2.18.3. SWOT Analysis
- 16.2.18.4. Recent Developments
- 16.2.18.5. Financials (Based on Availability)
- 16.2.19 Agfa-Gevaert Group
- 16.2.19.1. Overview
- 16.2.19.2. Products
- 16.2.19.3. SWOT Analysis
- 16.2.19.4. Recent Developments
- 16.2.19.5. Financials (Based on Availability)
- 16.2.20 RUCO Druckfarben
- 16.2.20.1. Overview
- 16.2.20.2. Products
- 16.2.20.3. SWOT Analysis
- 16.2.20.4. Recent Developments
- 16.2.20.5. Financials (Based on Availability)
- 16.2.1 Marabu GmbH & Co KG
List of Figures
- Figure 1: Global Low Migration Ink Market Revenue Breakdown (Million, %) by Region 2024 & 2032
- Figure 2: Global Low Migration Ink Market Volume Breakdown (liter , %) by Region 2024 & 2032
- Figure 3: Asia Pacific Low Migration Ink Market Revenue (Million), by Country 2024 & 2032
- Figure 4: Asia Pacific Low Migration Ink Market Volume (liter ), by Country 2024 & 2032
- Figure 5: Asia Pacific Low Migration Ink Market Revenue Share (%), by Country 2024 & 2032
- Figure 6: Asia Pacific Low Migration Ink Market Volume Share (%), by Country 2024 & 2032
- Figure 7: North America Low Migration Ink Market Revenue (Million), by Country 2024 & 2032
- Figure 8: North America Low Migration Ink Market Volume (liter ), by Country 2024 & 2032
- Figure 9: North America Low Migration Ink Market Revenue Share (%), by Country 2024 & 2032
- Figure 10: North America Low Migration Ink Market Volume Share (%), by Country 2024 & 2032
- Figure 11: Europe Low Migration Ink Market Revenue (Million), by Country 2024 & 2032
- Figure 12: Europe Low Migration Ink Market Volume (liter ), by Country 2024 & 2032
- Figure 13: Europe Low Migration Ink Market Revenue Share (%), by Country 2024 & 2032
- Figure 14: Europe Low Migration Ink Market Volume Share (%), by Country 2024 & 2032
- Figure 15: South America Low Migration Ink Market Revenue (Million), by Country 2024 & 2032
- Figure 16: South America Low Migration Ink Market Volume (liter ), by Country 2024 & 2032
- Figure 17: South America Low Migration Ink Market Revenue Share (%), by Country 2024 & 2032
- Figure 18: South America Low Migration Ink Market Volume Share (%), by Country 2024 & 2032
- Figure 19: Middle East and Africa Low Migration Ink Market Revenue (Million), by Country 2024 & 2032
- Figure 20: Middle East and Africa Low Migration Ink Market Volume (liter ), by Country 2024 & 2032
- Figure 21: Middle East and Africa Low Migration Ink Market Revenue Share (%), by Country 2024 & 2032
- Figure 22: Middle East and Africa Low Migration Ink Market Volume Share (%), by Country 2024 & 2032
- Figure 23: Asia Pacific Low Migration Ink Market Revenue (Million), by Printing Process 2024 & 2032
- Figure 24: Asia Pacific Low Migration Ink Market Volume (liter ), by Printing Process 2024 & 2032
- Figure 25: Asia Pacific Low Migration Ink Market Revenue Share (%), by Printing Process 2024 & 2032
- Figure 26: Asia Pacific Low Migration Ink Market Volume Share (%), by Printing Process 2024 & 2032
- Figure 27: Asia Pacific Low Migration Ink Market Revenue (Million), by End-user Industry 2024 & 2032
- Figure 28: Asia Pacific Low Migration Ink Market Volume (liter ), by End-user Industry 2024 & 2032
- Figure 29: Asia Pacific Low Migration Ink Market Revenue Share (%), by End-user Industry 2024 & 2032
- Figure 30: Asia Pacific Low Migration Ink Market Volume Share (%), by End-user Industry 2024 & 2032
- Figure 31: Asia Pacific Low Migration Ink Market Revenue (Million), by Country 2024 & 2032
- Figure 32: Asia Pacific Low Migration Ink Market Volume (liter ), by Country 2024 & 2032
- Figure 33: Asia Pacific Low Migration Ink Market Revenue Share (%), by Country 2024 & 2032
- Figure 34: Asia Pacific Low Migration Ink Market Volume Share (%), by Country 2024 & 2032
- Figure 35: North America Low Migration Ink Market Revenue (Million), by Printing Process 2024 & 2032
- Figure 36: North America Low Migration Ink Market Volume (liter ), by Printing Process 2024 & 2032
- Figure 37: North America Low Migration Ink Market Revenue Share (%), by Printing Process 2024 & 2032
- Figure 38: North America Low Migration Ink Market Volume Share (%), by Printing Process 2024 & 2032
- Figure 39: North America Low Migration Ink Market Revenue (Million), by End-user Industry 2024 & 2032
- Figure 40: North America Low Migration Ink Market Volume (liter ), by End-user Industry 2024 & 2032
- Figure 41: North America Low Migration Ink Market Revenue Share (%), by End-user Industry 2024 & 2032
- Figure 42: North America Low Migration Ink Market Volume Share (%), by End-user Industry 2024 & 2032
- Figure 43: North America Low Migration Ink Market Revenue (Million), by Country 2024 & 2032
- Figure 44: North America Low Migration Ink Market Volume (liter ), by Country 2024 & 2032
- Figure 45: North America Low Migration Ink Market Revenue Share (%), by Country 2024 & 2032
- Figure 46: North America Low Migration Ink Market Volume Share (%), by Country 2024 & 2032
- Figure 47: Europe Low Migration Ink Market Revenue (Million), by Printing Process 2024 & 2032
- Figure 48: Europe Low Migration Ink Market Volume (liter ), by Printing Process 2024 & 2032
- Figure 49: Europe Low Migration Ink Market Revenue Share (%), by Printing Process 2024 & 2032
- Figure 50: Europe Low Migration Ink Market Volume Share (%), by Printing Process 2024 & 2032
- Figure 51: Europe Low Migration Ink Market Revenue (Million), by End-user Industry 2024 & 2032
- Figure 52: Europe Low Migration Ink Market Volume (liter ), by End-user Industry 2024 & 2032
- Figure 53: Europe Low Migration Ink Market Revenue Share (%), by End-user Industry 2024 & 2032
- Figure 54: Europe Low Migration Ink Market Volume Share (%), by End-user Industry 2024 & 2032
- Figure 55: Europe Low Migration Ink Market Revenue (Million), by Country 2024 & 2032
- Figure 56: Europe Low Migration Ink Market Volume (liter ), by Country 2024 & 2032
- Figure 57: Europe Low Migration Ink Market Revenue Share (%), by Country 2024 & 2032
- Figure 58: Europe Low Migration Ink Market Volume Share (%), by Country 2024 & 2032
- Figure 59: South America Low Migration Ink Market Revenue (Million), by Printing Process 2024 & 2032
- Figure 60: South America Low Migration Ink Market Volume (liter ), by Printing Process 2024 & 2032
- Figure 61: South America Low Migration Ink Market Revenue Share (%), by Printing Process 2024 & 2032
- Figure 62: South America Low Migration Ink Market Volume Share (%), by Printing Process 2024 & 2032
- Figure 63: South America Low Migration Ink Market Revenue (Million), by End-user Industry 2024 & 2032
- Figure 64: South America Low Migration Ink Market Volume (liter ), by End-user Industry 2024 & 2032
- Figure 65: South America Low Migration Ink Market Revenue Share (%), by End-user Industry 2024 & 2032
- Figure 66: South America Low Migration Ink Market Volume Share (%), by End-user Industry 2024 & 2032
- Figure 67: South America Low Migration Ink Market Revenue (Million), by Country 2024 & 2032
- Figure 68: South America Low Migration Ink Market Volume (liter ), by Country 2024 & 2032
- Figure 69: South America Low Migration Ink Market Revenue Share (%), by Country 2024 & 2032
- Figure 70: South America Low Migration Ink Market Volume Share (%), by Country 2024 & 2032
- Figure 71: Middle East and Africa Low Migration Ink Market Revenue (Million), by Printing Process 2024 & 2032
- Figure 72: Middle East and Africa Low Migration Ink Market Volume (liter ), by Printing Process 2024 & 2032
- Figure 73: Middle East and Africa Low Migration Ink Market Revenue Share (%), by Printing Process 2024 & 2032
- Figure 74: Middle East and Africa Low Migration Ink Market Volume Share (%), by Printing Process 2024 & 2032
- Figure 75: Middle East and Africa Low Migration Ink Market Revenue (Million), by End-user Industry 2024 & 2032
- Figure 76: Middle East and Africa Low Migration Ink Market Volume (liter ), by End-user Industry 2024 & 2032
- Figure 77: Middle East and Africa Low Migration Ink Market Revenue Share (%), by End-user Industry 2024 & 2032
- Figure 78: Middle East and Africa Low Migration Ink Market Volume Share (%), by End-user Industry 2024 & 2032
- Figure 79: Middle East and Africa Low Migration Ink Market Revenue (Million), by Country 2024 & 2032
- Figure 80: Middle East and Africa Low Migration Ink Market Volume (liter ), by Country 2024 & 2032
- Figure 81: Middle East and Africa Low Migration Ink Market Revenue Share (%), by Country 2024 & 2032
- Figure 82: Middle East and Africa Low Migration Ink Market Volume Share (%), by Country 2024 & 2032
List of Tables
- Table 1: Global Low Migration Ink Market Revenue Million Forecast, by Region 2019 & 2032
- Table 2: Global Low Migration Ink Market Volume liter Forecast, by Region 2019 & 2032
- Table 3: Global Low Migration Ink Market Revenue Million Forecast, by Printing Process 2019 & 2032
- Table 4: Global Low Migration Ink Market Volume liter Forecast, by Printing Process 2019 & 2032
- Table 5: Global Low Migration Ink Market Revenue Million Forecast, by End-user Industry 2019 & 2032
- Table 6: Global Low Migration Ink Market Volume liter Forecast, by End-user Industry 2019 & 2032
- Table 7: Global Low Migration Ink Market Revenue Million Forecast, by Region 2019 & 2032
- Table 8: Global Low Migration Ink Market Volume liter Forecast, by Region 2019 & 2032
- Table 9: Global Low Migration Ink Market Revenue Million Forecast, by Country 2019 & 2032
- Table 10: Global Low Migration Ink Market Volume liter Forecast, by Country 2019 & 2032
- Table 11: China Low Migration Ink Market Revenue (Million) Forecast, by Application 2019 & 2032
- Table 12: China Low Migration Ink Market Volume (liter ) Forecast, by Application 2019 & 2032
- Table 13: India Low Migration Ink Market Revenue (Million) Forecast, by Application 2019 & 2032
- Table 14: India Low Migration Ink Market Volume (liter ) Forecast, by Application 2019 & 2032
- Table 15: Japan Low Migration Ink Market Revenue (Million) Forecast, by Application 2019 & 2032
- Table 16: Japan Low Migration Ink Market Volume (liter ) Forecast, by Application 2019 & 2032
- Table 17: South Korea Low Migration Ink Market Revenue (Million) Forecast, by Application 2019 & 2032
- Table 18: South Korea Low Migration Ink Market Volume (liter ) Forecast, by Application 2019 & 2032
- Table 19: Rest of Asia Pacific Low Migration Ink Market Revenue (Million) Forecast, by Application 2019 & 2032
- Table 20: Rest of Asia Pacific Low Migration Ink Market Volume (liter ) Forecast, by Application 2019 & 2032
- Table 21: Global Low Migration Ink Market Revenue Million Forecast, by Country 2019 & 2032
- Table 22: Global Low Migration Ink Market Volume liter Forecast, by Country 2019 & 2032
- Table 23: United States Low Migration Ink Market Revenue (Million) Forecast, by Application 2019 & 2032
- Table 24: United States Low Migration Ink Market Volume (liter ) Forecast, by Application 2019 & 2032
- Table 25: Canada Low Migration Ink Market Revenue (Million) Forecast, by Application 2019 & 2032
- Table 26: Canada Low Migration Ink Market Volume (liter ) Forecast, by Application 2019 & 2032
- Table 27: Mexico Low Migration Ink Market Revenue (Million) Forecast, by Application 2019 & 2032
- Table 28: Mexico Low Migration Ink Market Volume (liter ) Forecast, by Application 2019 & 2032
- Table 29: Global Low Migration Ink Market Revenue Million Forecast, by Country 2019 & 2032
- Table 30: Global Low Migration Ink Market Volume liter Forecast, by Country 2019 & 2032
- Table 31: Germany Low Migration Ink Market Revenue (Million) Forecast, by Application 2019 & 2032
- Table 32: Germany Low Migration Ink Market Volume (liter ) Forecast, by Application 2019 & 2032
- Table 33: United Kingdom Low Migration Ink Market Revenue (Million) Forecast, by Application 2019 & 2032
- Table 34: United Kingdom Low Migration Ink Market Volume (liter ) Forecast, by Application 2019 & 2032
- Table 35: France Low Migration Ink Market Revenue (Million) Forecast, by Application 2019 & 2032
- Table 36: France Low Migration Ink Market Volume (liter ) Forecast, by Application 2019 & 2032
- Table 37: Italy Low Migration Ink Market Revenue (Million) Forecast, by Application 2019 & 2032
- Table 38: Italy Low Migration Ink Market Volume (liter ) Forecast, by Application 2019 & 2032
- Table 39: Rest of Europe Low Migration Ink Market Revenue (Million) Forecast, by Application 2019 & 2032
- Table 40: Rest of Europe Low Migration Ink Market Volume (liter ) Forecast, by Application 2019 & 2032
- Table 41: Global Low Migration Ink Market Revenue Million Forecast, by Country 2019 & 2032
- Table 42: Global Low Migration Ink Market Volume liter Forecast, by Country 2019 & 2032
- Table 43: Brazil Low Migration Ink Market Revenue (Million) Forecast, by Application 2019 & 2032
- Table 44: Brazil Low Migration Ink Market Volume (liter ) Forecast, by Application 2019 & 2032
- Table 45: Argentina Low Migration Ink Market Revenue (Million) Forecast, by Application 2019 & 2032
- Table 46: Argentina Low Migration Ink Market Volume (liter ) Forecast, by Application 2019 & 2032
- Table 47: Rest of South America Low Migration Ink Market Revenue (Million) Forecast, by Application 2019 & 2032
- Table 48: Rest of South America Low Migration Ink Market Volume (liter ) Forecast, by Application 2019 & 2032
- Table 49: Global Low Migration Ink Market Revenue Million Forecast, by Country 2019 & 2032
- Table 50: Global Low Migration Ink Market Volume liter Forecast, by Country 2019 & 2032
- Table 51: Saudi Arabia Low Migration Ink Market Revenue (Million) Forecast, by Application 2019 & 2032
- Table 52: Saudi Arabia Low Migration Ink Market Volume (liter ) Forecast, by Application 2019 & 2032
- Table 53: South Africa Low Migration Ink Market Revenue (Million) Forecast, by Application 2019 & 2032
- Table 54: South Africa Low Migration Ink Market Volume (liter ) Forecast, by Application 2019 & 2032
- Table 55: Rest of Middle East and Africa Low Migration Ink Market Revenue (Million) Forecast, by Application 2019 & 2032
- Table 56: Rest of Middle East and Africa Low Migration Ink Market Volume (liter ) Forecast, by Application 2019 & 2032
- Table 57: Global Low Migration Ink Market Revenue Million Forecast, by Printing Process 2019 & 2032
- Table 58: Global Low Migration Ink Market Volume liter Forecast, by Printing Process 2019 & 2032
- Table 59: Global Low Migration Ink Market Revenue Million Forecast, by End-user Industry 2019 & 2032
- Table 60: Global Low Migration Ink Market Volume liter Forecast, by End-user Industry 2019 & 2032
- Table 61: Global Low Migration Ink Market Revenue Million Forecast, by Country 2019 & 2032
- Table 62: Global Low Migration Ink Market Volume liter Forecast, by Country 2019 & 2032
- Table 63: China Low Migration Ink Market Revenue (Million) Forecast, by Application 2019 & 2032
- Table 64: China Low Migration Ink Market Volume (liter ) Forecast, by Application 2019 & 2032
- Table 65: India Low Migration Ink Market Revenue (Million) Forecast, by Application 2019 & 2032
- Table 66: India Low Migration Ink Market Volume (liter ) Forecast, by Application 2019 & 2032
- Table 67: Japan Low Migration Ink Market Revenue (Million) Forecast, by Application 2019 & 2032
- Table 68: Japan Low Migration Ink Market Volume (liter ) Forecast, by Application 2019 & 2032
- Table 69: South Korea Low Migration Ink Market Revenue (Million) Forecast, by Application 2019 & 2032
- Table 70: South Korea Low Migration Ink Market Volume (liter ) Forecast, by Application 2019 & 2032
- Table 71: Rest of Asia Pacific Low Migration Ink Market Revenue (Million) Forecast, by Application 2019 & 2032
- Table 72: Rest of Asia Pacific Low Migration Ink Market Volume (liter ) Forecast, by Application 2019 & 2032
- Table 73: Global Low Migration Ink Market Revenue Million Forecast, by Printing Process 2019 & 2032
- Table 74: Global Low Migration Ink Market Volume liter Forecast, by Printing Process 2019 & 2032
- Table 75: Global Low Migration Ink Market Revenue Million Forecast, by End-user Industry 2019 & 2032
- Table 76: Global Low Migration Ink Market Volume liter Forecast, by End-user Industry 2019 & 2032
- Table 77: Global Low Migration Ink Market Revenue Million Forecast, by Country 2019 & 2032
- Table 78: Global Low Migration Ink Market Volume liter Forecast, by Country 2019 & 2032
- Table 79: United States Low Migration Ink Market Revenue (Million) Forecast, by Application 2019 & 2032
- Table 80: United States Low Migration Ink Market Volume (liter ) Forecast, by Application 2019 & 2032
- Table 81: Canada Low Migration Ink Market Revenue (Million) Forecast, by Application 2019 & 2032
- Table 82: Canada Low Migration Ink Market Volume (liter ) Forecast, by Application 2019 & 2032
- Table 83: Mexico Low Migration Ink Market Revenue (Million) Forecast, by Application 2019 & 2032
- Table 84: Mexico Low Migration Ink Market Volume (liter ) Forecast, by Application 2019 & 2032
- Table 85: Global Low Migration Ink Market Revenue Million Forecast, by Printing Process 2019 & 2032
- Table 86: Global Low Migration Ink Market Volume liter Forecast, by Printing Process 2019 & 2032
- Table 87: Global Low Migration Ink Market Revenue Million Forecast, by End-user Industry 2019 & 2032
- Table 88: Global Low Migration Ink Market Volume liter Forecast, by End-user Industry 2019 & 2032
- Table 89: Global Low Migration Ink Market Revenue Million Forecast, by Country 2019 & 2032
- Table 90: Global Low Migration Ink Market Volume liter Forecast, by Country 2019 & 2032
- Table 91: Germany Low Migration Ink Market Revenue (Million) Forecast, by Application 2019 & 2032
- Table 92: Germany Low Migration Ink Market Volume (liter ) Forecast, by Application 2019 & 2032
- Table 93: United Kingdom Low Migration Ink Market Revenue (Million) Forecast, by Application 2019 & 2032
- Table 94: United Kingdom Low Migration Ink Market Volume (liter ) Forecast, by Application 2019 & 2032
- Table 95: France Low Migration Ink Market Revenue (Million) Forecast, by Application 2019 & 2032
- Table 96: France Low Migration Ink Market Volume (liter ) Forecast, by Application 2019 & 2032
- Table 97: Italy Low Migration Ink Market Revenue (Million) Forecast, by Application 2019 & 2032
- Table 98: Italy Low Migration Ink Market Volume (liter ) Forecast, by Application 2019 & 2032
- Table 99: Rest of Europe Low Migration Ink Market Revenue (Million) Forecast, by Application 2019 & 2032
- Table 100: Rest of Europe Low Migration Ink Market Volume (liter ) Forecast, by Application 2019 & 2032
- Table 101: Global Low Migration Ink Market Revenue Million Forecast, by Printing Process 2019 & 2032
- Table 102: Global Low Migration Ink Market Volume liter Forecast, by Printing Process 2019 & 2032
- Table 103: Global Low Migration Ink Market Revenue Million Forecast, by End-user Industry 2019 & 2032
- Table 104: Global Low Migration Ink Market Volume liter Forecast, by End-user Industry 2019 & 2032
- Table 105: Global Low Migration Ink Market Revenue Million Forecast, by Country 2019 & 2032
- Table 106: Global Low Migration Ink Market Volume liter Forecast, by Country 2019 & 2032
- Table 107: Brazil Low Migration Ink Market Revenue (Million) Forecast, by Application 2019 & 2032
- Table 108: Brazil Low Migration Ink Market Volume (liter ) Forecast, by Application 2019 & 2032
- Table 109: Argentina Low Migration Ink Market Revenue (Million) Forecast, by Application 2019 & 2032
- Table 110: Argentina Low Migration Ink Market Volume (liter ) Forecast, by Application 2019 & 2032
- Table 111: Rest of South America Low Migration Ink Market Revenue (Million) Forecast, by Application 2019 & 2032
- Table 112: Rest of South America Low Migration Ink Market Volume (liter ) Forecast, by Application 2019 & 2032
- Table 113: Global Low Migration Ink Market Revenue Million Forecast, by Printing Process 2019 & 2032
- Table 114: Global Low Migration Ink Market Volume liter Forecast, by Printing Process 2019 & 2032
- Table 115: Global Low Migration Ink Market Revenue Million Forecast, by End-user Industry 2019 & 2032
- Table 116: Global Low Migration Ink Market Volume liter Forecast, by End-user Industry 2019 & 2032
- Table 117: Global Low Migration Ink Market Revenue Million Forecast, by Country 2019 & 2032
- Table 118: Global Low Migration Ink Market Volume liter Forecast, by Country 2019 & 2032
- Table 119: Saudi Arabia Low Migration Ink Market Revenue (Million) Forecast, by Application 2019 & 2032
- Table 120: Saudi Arabia Low Migration Ink Market Volume (liter ) Forecast, by Application 2019 & 2032
- Table 121: South Africa Low Migration Ink Market Revenue (Million) Forecast, by Application 2019 & 2032
- Table 122: South Africa Low Migration Ink Market Volume (liter ) Forecast, by Application 2019 & 2032
- Table 123: Rest of Middle East and Africa Low Migration Ink Market Revenue (Million) Forecast, by Application 2019 & 2032
- Table 124: Rest of Middle East and Africa Low Migration Ink Market Volume (liter ) Forecast, by Application 2019 & 2032
Frequently Asked Questions
1. What is the projected Compound Annual Growth Rate (CAGR) of the Low Migration Ink Market?
The projected CAGR is approximately > 7.00%.
2. Which companies are prominent players in the Low Migration Ink Market?
Key companies in the market include Marabu GmbH & Co KG, Epple Druckfarben AG, MHM Holding GmbH, SEIKO EPSON CORP, Altana, Sun Chemical, TOYO INK CO LTD, FUJIFILM Corporation, HAPA AG, HP Development Company L P, Encres Dubuit, Wikoff Color Corporation*List Not Exhaustive, Siegwerk Druckfarben AG & Co KGaA, INX International Ink Co, hubergroup Deutschland GmbH, Kao Collins Corporation, SPGPrints B V, Flint Group, Agfa-Gevaert Group, RUCO Druckfarben.
3. What are the main segments of the Low Migration Ink Market?
The market segments include Printing Process, End-user Industry.
4. Can you provide details about the market size?
The market size is estimated to be USD 2720 Million as of 2022.
5. What are some drivers contributing to market growth?
; Significant Growth in Food and Beverage Industry; Rise in Demand for Personal Care Products.
6. What are the notable trends driving market growth?
Significant Growth in Food and Beverage Industry.
7. Are there any restraints impacting market growth?
; High Cost Compared to Conventional Inks; Unfavorable Conditions Arising Due to COVID-19 Outbreak.
8. Can you provide examples of recent developments in the market?
The Low Migration Ink Market has witnessed several significant developments in recent years: Launch of new ultra-low-migration inks by leading players Strategic acquisitions and partnerships to expand product portfolios Development of AI-assisted ink formulation technologies Growing investment in sustainable ink production processes
9. What pricing options are available for accessing the report?
Pricing options include single-user, multi-user, and enterprise licenses priced at USD 4750, USD 5250, and USD 8750 respectively.
10. Is the market size provided in terms of value or volume?
The market size is provided in terms of value, measured in Million and volume, measured in liter .
11. Are there any specific market keywords associated with the report?
Yes, the market keyword associated with the report is "Low Migration Ink Market," which aids in identifying and referencing the specific market segment covered.
12. How do I determine which pricing option suits my needs best?
The pricing options vary based on user requirements and access needs. Individual users may opt for single-user licenses, while businesses requiring broader access may choose multi-user or enterprise licenses for cost-effective access to the report.
13. Are there any additional resources or data provided in the Low Migration Ink Market report?
While the report offers comprehensive insights, it's advisable to review the specific contents or supplementary materials provided to ascertain if additional resources or data are available.
14. How can I stay updated on further developments or reports in the Low Migration Ink Market?
To stay informed about further developments, trends, and reports in the Low Migration Ink Market, consider subscribing to industry newsletters, following relevant companies and organizations, or regularly checking reputable industry news sources and publications.
Methodology
Step 1 - Identification of Relevant Samples Size from Population Database


Step 2 - Approaches for Defining Global Market Size (Value, Volume* & Price*)

Note*: In applicable scenarios
Step 3 - Data Sources
Primary Research
- Web Analytics
- Survey Reports
- Research Institute
- Latest Research Reports
- Opinion Leaders
Secondary Research
- Annual Reports
- White Paper
- Latest Press Release
- Industry Association
- Paid Database
- Investor Presentations

Step 4 - Data Triangulation
Involves using different sources of information in order to increase the validity of a study
These sources are likely to be stakeholders in a program - participants, other researchers, program staff, other community members, and so on.
Then we put all data in single framework & apply various statistical tools to find out the dynamic on the market.
During the analysis stage, feedback from the stakeholder groups would be compared to determine areas of agreement as well as areas of divergence


