

Key Insights
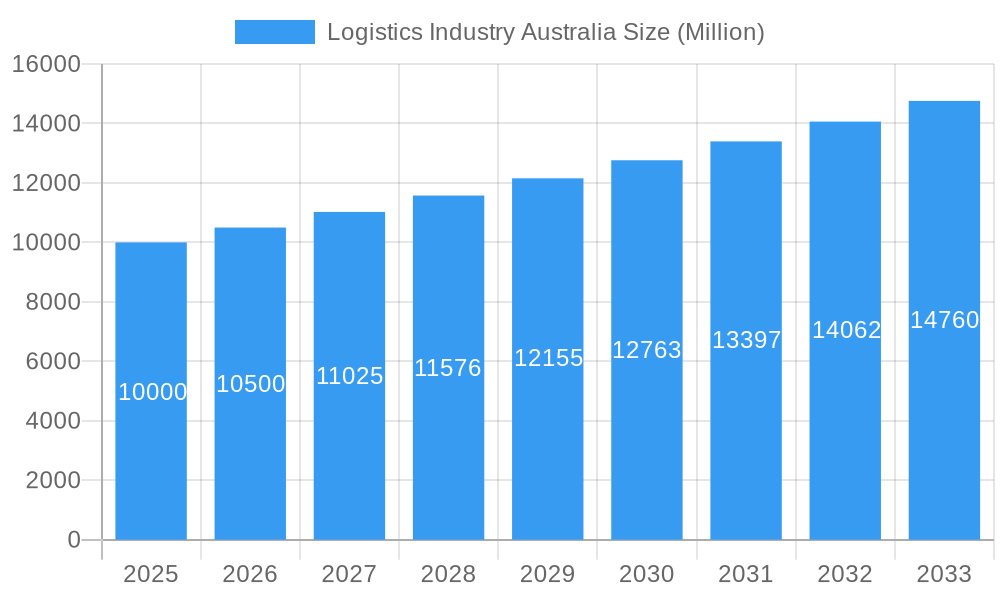
Australia's logistics industry, valued at $137.7 billion in 2025, is poised for significant expansion with a projected Compound Annual Growth Rate (CAGR) of over 5% through 2033. This growth is propelled by several key drivers. The e-commerce surge is increasing demand for efficient last-mile delivery and temperature-controlled logistics, particularly within the Courier, Express, and Parcel (CEP) segment. Concurrently, expanding sectors such as agriculture, construction, and mining require robust logistics for sourcing raw materials and distributing finished goods. Enhanced government investment in infrastructure, focusing on road and rail networks, will further bolster logistics efficiency and support market growth. However, persistent challenges including driver shortages, escalating fuel costs, and global supply chain volatility may temper this growth trajectory.
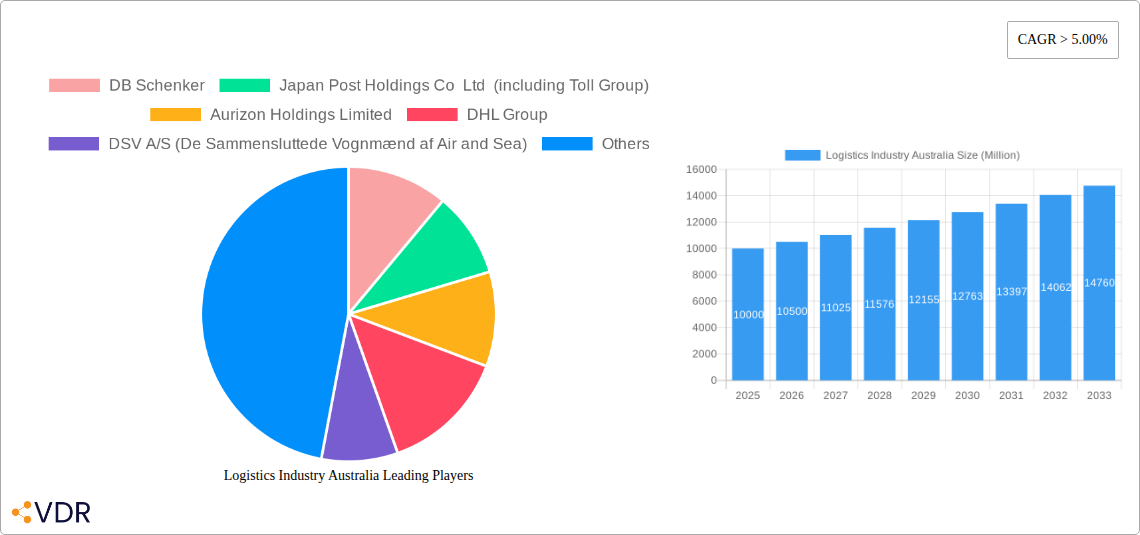
Logistics Industry Australia Market Size (In Billion)
The industry's segmentation highlights distinct opportunities. The CEP sector remains a primary growth engine, vital for e-commerce fulfillment. Temperature-controlled logistics, essential for food and pharmaceuticals, presents another lucrative and expanding segment. Leading market participants include DB Schenker, DHL, FedEx, and Toll Group, capitalizing on extensive networks and advanced technologies. Specialized niche players like LINX Cargo Care Group, focusing on temperature-sensitive goods, are also emerging. Regional market dynamics are influenced by industrial activity and population distribution. The forecast anticipates ongoing market consolidation as major companies acquire smaller entities to broaden their service portfolios and market reach.
Logistics Industry Australia Company Market Share
Logistics Industry Australia: Market Report 2019-2033
This comprehensive report provides a detailed analysis of the Australian logistics industry, encompassing market size, growth trends, competitive landscape, and future outlook. With a focus on key players like DHL, FedEx, and Toll Group, this report is essential for industry professionals, investors, and strategic decision-makers seeking to navigate this dynamic sector. The report covers the parent market of Transportation and Logistics and the child market of Freight Transportation. The study period spans from 2019 to 2033, with a base year of 2025. All values are presented in Million Australian Dollars (AUD).
Logistics Industry Australia Market Dynamics & Structure
The Australian logistics market is characterized by a moderately concentrated landscape with several major players holding significant market share. The market's growth is driven by technological advancements such as automation, data analytics, and the rise of e-commerce. Stringent regulatory frameworks, including safety and environmental regulations, shape industry practices. Competitive product substitutes, such as digital platforms and alternative transportation modes, impact market dynamics. End-user demographics, particularly the growth of e-commerce and the increasing demand for specialized logistics services, influence market growth. M&A activity, while fluctuating, plays a crucial role in market consolidation and expansion.
- Market Concentration: Top 5 players hold approximately xx% of market share in 2025.
- Technological Innovation: Adoption of AI, IoT, and blockchain technologies is accelerating, but high implementation costs pose a barrier for smaller players.
- Regulatory Framework: Stringent regulations on safety, environmental impact, and data privacy significantly impact operational costs and strategies.
- Competitive Substitutes: The rise of e-commerce platforms offering integrated logistics solutions creates competitive pressure.
- End-User Demographics: Growth in e-commerce and specialized industries (e.g., healthcare, pharmaceuticals) fuels demand for diverse logistics services.
- M&A Trends: An average of xx M&A deals were recorded annually during 2019-2024, with deal values averaging xx million AUD.
Logistics Industry Australia Growth Trends & Insights
The Australian logistics market experienced steady growth during the historical period (2019-2024), with a CAGR of xx%. This growth is expected to continue during the forecast period (2025-2033), driven by increasing e-commerce penetration, infrastructure development, and the expansion of key industries like mining and manufacturing. Technological disruptions, such as the adoption of autonomous vehicles and drone delivery, are poised to reshape the industry's landscape. Consumer behavior shifts toward faster delivery times and increased transparency are impacting logistics service requirements. Market penetration of new technologies is expected to increase significantly by 2033.
- Market Size: The market size was valued at xx million AUD in 2024 and is projected to reach xx million AUD by 2033.
- CAGR: Projected CAGR for 2025-2033 is xx%.
- Market Penetration: Adoption of AI and automation in warehousing is expected to reach xx% by 2033.
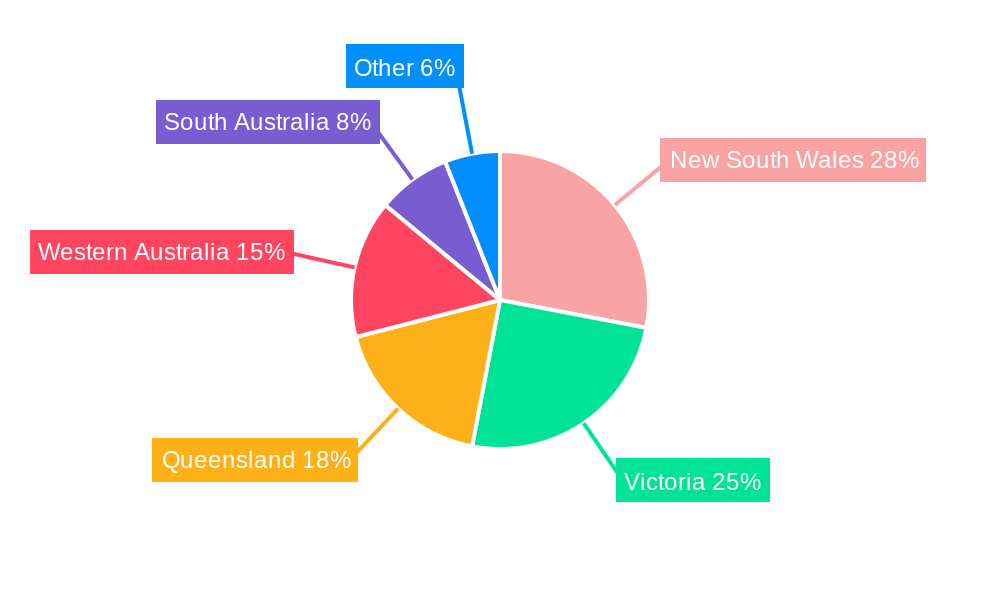
Dominant Regions, Countries, or Segments in Logistics Industry Australia
The strongest growth in the Australian logistics market is observed in the major metropolitan areas due to higher population density and robust e-commerce activity. The Manufacturing and Wholesale and Retail Trade segments are major contributors to market growth, driven by increasing production and consumer spending. Within logistics functions, Courier, Express, and Parcel (CEP) services exhibit significant growth potential.
- Key Growth Drivers:
- Robust infrastructure development in major cities.
- Government initiatives supporting trade and economic growth.
- Strong growth in e-commerce and related delivery services.
- Increased demand for temperature-controlled logistics from the food and pharmaceutical sectors.
- Dominant Segments:
- End-User Industry: Wholesale and Retail Trade (xx% market share), Manufacturing (xx% market share).
- Logistics Function: Courier, Express, and Parcel (CEP) (xx% market share).
Logistics Industry Australia Product Landscape
The Australian logistics market is witnessing significant product innovation, driven by technological advancements. New offerings include advanced warehouse management systems (WMS), route optimization software, real-time tracking solutions, and specialized temperature-controlled containers. These innovations enhance efficiency, reduce costs, and improve supply chain visibility. Unique selling propositions include customized solutions tailored to specific industry needs and integrated platforms offering end-to-end visibility.
Key Drivers, Barriers & Challenges in Logistics Industry Australia
Key Drivers: The growth of e-commerce, the expansion of the manufacturing sector, and government investment in infrastructure are key drivers. Technological advancements in automation, data analytics, and sustainable transportation are also contributing to market expansion.
Challenges: Labor shortages, rising fuel costs, and the need for greater supply chain resilience pose significant challenges. Stringent regulations, particularly concerning environmental sustainability and data privacy, also impact operational costs and strategies. Increased competition and pressure to reduce prices further complicate the operational landscape. The impact of these challenges is estimated to cost the industry xx million AUD annually.
Emerging Opportunities in Logistics Industry Australia
Emerging opportunities include the growth of last-mile delivery solutions, the increased adoption of sustainable logistics practices, and the expansion of specialized logistics services, like those supporting the healthcare and e-commerce sectors. Untapped markets in regional areas and the growing demand for integrated logistics platforms provide further growth avenues. The development of smart logistics solutions through AI and IoT technology is a promising area.
Growth Accelerators in the Logistics Industry Australia Industry
Technological breakthroughs in automation and data analytics are key growth accelerators, increasing efficiency and optimizing supply chain processes. Strategic partnerships between logistics providers and technology companies drive innovation and create integrated solutions. Market expansion into regional areas and the development of sustainable and environmentally responsible logistics practices are also crucial for long-term growth.
Key Players Shaping the Logistics Industry Australia Market
- DB Schenker
- Japan Post Holdings Co Ltd (including Toll Group)
- Aurizon Holdings Limited
- DHL Group
- DSV A/S (De Sammensluttede Vognmænd af Air and Sea)
- FedEx
- Qube Holdings Ltd
- LINX Cargo Care Group
- Kuehne + Nagel
- Linfox Pty Ltd
- K&S Corporation Limited
- Toll Group
- Centurion Transport
Notable Milestones in Logistics Industry Australia Sector
- January 2024: DHL Express deploys final Boeing 777 freighter in Singapore, significantly boosting Asia-Pacific to Americas connectivity.
- January 2024: Kuehne + Nagel launches Book & Claim insetting solution for electric vehicles, enhancing decarbonization efforts.
- February 2024: DHL Supply Chain introduces electric vehicles to its Australian fleet, furthering its decarbonization strategy.
In-Depth Logistics Industry Australia Market Outlook
The Australian logistics industry is poised for continued growth, driven by technological advancements, e-commerce expansion, and government infrastructure investments. Strategic opportunities exist in developing sustainable solutions, expanding into regional markets, and providing specialized services to niche sectors. The market's future potential is significant, with projections indicating substantial growth in market size and increased adoption of innovative technologies over the next decade.
Logistics Industry Australia Segmentation
-
1. End User Industry
- 1.1. Agriculture, Fishing, and Forestry
- 1.2. Construction
- 1.3. Manufacturing
- 1.4. Oil and Gas, Mining and Quarrying
- 1.5. Wholesale and Retail Trade
- 1.6. Others
-
2. Logistics Function
-
2.1. Courier, Express, and Parcel (CEP)
-
2.1.1. By Destination Type
- 2.1.1.1. Domestic
- 2.1.1.2. International
-
2.1.1. By Destination Type
-
2.2. Freight Forwarding
-
2.2.1. By Mode Of Transport
- 2.2.1.1. Air
- 2.2.1.2. Sea and Inland Waterways
- 2.2.1.3. Others
-
2.2.1. By Mode Of Transport
-
2.3. Freight Transport
- 2.3.1. Pipelines
- 2.3.2. Rail
- 2.3.3. Road
-
2.4. Warehousing and Storage
-
2.4.1. By Temperature Control
- 2.4.1.1. Non-Temperature Controlled
-
2.4.1. By Temperature Control
- 2.5. Other Services
-
2.1. Courier, Express, and Parcel (CEP)
Logistics Industry Australia Segmentation By Geography
-
1. North America
- 1.1. United States
- 1.2. Canada
- 1.3. Mexico
-
2. South America
- 2.1. Brazil
- 2.2. Argentina
- 2.3. Rest of South America
-
3. Europe
- 3.1. United Kingdom
- 3.2. Germany
- 3.3. France
- 3.4. Italy
- 3.5. Spain
- 3.6. Russia
- 3.7. Benelux
- 3.8. Nordics
- 3.9. Rest of Europe
-
4. Middle East & Africa
- 4.1. Turkey
- 4.2. Israel
- 4.3. GCC
- 4.4. North Africa
- 4.5. South Africa
- 4.6. Rest of Middle East & Africa
-
5. Asia Pacific
- 5.1. China
- 5.2. India
- 5.3. Japan
- 5.4. South Korea
- 5.5. ASEAN
- 5.6. Oceania
- 5.7. Rest of Asia Pacific
Logistics Industry Australia Regional Market Share
Geographic Coverage of Logistics Industry Australia
Logistics Industry Australia REPORT HIGHLIGHTS
| Aspects | Details |
|---|---|
| Study Period | 2020-2034 |
| Base Year | 2025 |
| Estimated Year | 2026 |
| Forecast Period | 2026-2034 |
| Historical Period | 2020-2025 |
| Growth Rate | CAGR of 1% from 2020-2034 |
| Segmentation |
|
Table of Contents
- 1. Introduction
- 1.1. Research Scope
- 1.2. Market Segmentation
- 1.3. Research Methodology
- 1.4. Definitions and Assumptions
- 2. Executive Summary
- 2.1. Introduction
- 3. Market Dynamics
- 3.1. Introduction
- 3.2. Market Drivers
- 3.2.1. 4.; Increase demand of Petrochemical is driving the market4.; Increase in Investments is driving the market
- 3.3. Market Restrains
- 3.3.1. 4.; High Cost of Operations
- 3.4. Market Trends
- 3.4.1. OTHER KEY INDUSTRY TRENDS COVERED IN THE REPORT
- 4. Market Factor Analysis
- 4.1. Porters Five Forces
- 4.2. Supply/Value Chain
- 4.3. PESTEL analysis
- 4.4. Market Entropy
- 4.5. Patent/Trademark Analysis
- 5. Global Logistics Industry Australia Analysis, Insights and Forecast, 2020-2032
- 5.1. Market Analysis, Insights and Forecast - by End User Industry
- 5.1.1. Agriculture, Fishing, and Forestry
- 5.1.2. Construction
- 5.1.3. Manufacturing
- 5.1.4. Oil and Gas, Mining and Quarrying
- 5.1.5. Wholesale and Retail Trade
- 5.1.6. Others
- 5.2. Market Analysis, Insights and Forecast - by Logistics Function
- 5.2.1. Courier, Express, and Parcel (CEP)
- 5.2.1.1. By Destination Type
- 5.2.1.1.1. Domestic
- 5.2.1.1.2. International
- 5.2.1.1. By Destination Type
- 5.2.2. Freight Forwarding
- 5.2.2.1. By Mode Of Transport
- 5.2.2.1.1. Air
- 5.2.2.1.2. Sea and Inland Waterways
- 5.2.2.1.3. Others
- 5.2.2.1. By Mode Of Transport
- 5.2.3. Freight Transport
- 5.2.3.1. Pipelines
- 5.2.3.2. Rail
- 5.2.3.3. Road
- 5.2.4. Warehousing and Storage
- 5.2.4.1. By Temperature Control
- 5.2.4.1.1. Non-Temperature Controlled
- 5.2.4.1. By Temperature Control
- 5.2.5. Other Services
- 5.2.1. Courier, Express, and Parcel (CEP)
- 5.3. Market Analysis, Insights and Forecast - by Region
- 5.3.1. North America
- 5.3.2. South America
- 5.3.3. Europe
- 5.3.4. Middle East & Africa
- 5.3.5. Asia Pacific
- 5.1. Market Analysis, Insights and Forecast - by End User Industry
- 6. North America Logistics Industry Australia Analysis, Insights and Forecast, 2020-2032
- 6.1. Market Analysis, Insights and Forecast - by End User Industry
- 6.1.1. Agriculture, Fishing, and Forestry
- 6.1.2. Construction
- 6.1.3. Manufacturing
- 6.1.4. Oil and Gas, Mining and Quarrying
- 6.1.5. Wholesale and Retail Trade
- 6.1.6. Others
- 6.2. Market Analysis, Insights and Forecast - by Logistics Function
- 6.2.1. Courier, Express, and Parcel (CEP)
- 6.2.1.1. By Destination Type
- 6.2.1.1.1. Domestic
- 6.2.1.1.2. International
- 6.2.1.1. By Destination Type
- 6.2.2. Freight Forwarding
- 6.2.2.1. By Mode Of Transport
- 6.2.2.1.1. Air
- 6.2.2.1.2. Sea and Inland Waterways
- 6.2.2.1.3. Others
- 6.2.2.1. By Mode Of Transport
- 6.2.3. Freight Transport
- 6.2.3.1. Pipelines
- 6.2.3.2. Rail
- 6.2.3.3. Road
- 6.2.4. Warehousing and Storage
- 6.2.4.1. By Temperature Control
- 6.2.4.1.1. Non-Temperature Controlled
- 6.2.4.1. By Temperature Control
- 6.2.5. Other Services
- 6.2.1. Courier, Express, and Parcel (CEP)
- 6.1. Market Analysis, Insights and Forecast - by End User Industry
- 7. South America Logistics Industry Australia Analysis, Insights and Forecast, 2020-2032
- 7.1. Market Analysis, Insights and Forecast - by End User Industry
- 7.1.1. Agriculture, Fishing, and Forestry
- 7.1.2. Construction
- 7.1.3. Manufacturing
- 7.1.4. Oil and Gas, Mining and Quarrying
- 7.1.5. Wholesale and Retail Trade
- 7.1.6. Others
- 7.2. Market Analysis, Insights and Forecast - by Logistics Function
- 7.2.1. Courier, Express, and Parcel (CEP)
- 7.2.1.1. By Destination Type
- 7.2.1.1.1. Domestic
- 7.2.1.1.2. International
- 7.2.1.1. By Destination Type
- 7.2.2. Freight Forwarding
- 7.2.2.1. By Mode Of Transport
- 7.2.2.1.1. Air
- 7.2.2.1.2. Sea and Inland Waterways
- 7.2.2.1.3. Others
- 7.2.2.1. By Mode Of Transport
- 7.2.3. Freight Transport
- 7.2.3.1. Pipelines
- 7.2.3.2. Rail
- 7.2.3.3. Road
- 7.2.4. Warehousing and Storage
- 7.2.4.1. By Temperature Control
- 7.2.4.1.1. Non-Temperature Controlled
- 7.2.4.1. By Temperature Control
- 7.2.5. Other Services
- 7.2.1. Courier, Express, and Parcel (CEP)
- 7.1. Market Analysis, Insights and Forecast - by End User Industry
- 8. Europe Logistics Industry Australia Analysis, Insights and Forecast, 2020-2032
- 8.1. Market Analysis, Insights and Forecast - by End User Industry
- 8.1.1. Agriculture, Fishing, and Forestry
- 8.1.2. Construction
- 8.1.3. Manufacturing
- 8.1.4. Oil and Gas, Mining and Quarrying
- 8.1.5. Wholesale and Retail Trade
- 8.1.6. Others
- 8.2. Market Analysis, Insights and Forecast - by Logistics Function
- 8.2.1. Courier, Express, and Parcel (CEP)
- 8.2.1.1. By Destination Type
- 8.2.1.1.1. Domestic
- 8.2.1.1.2. International
- 8.2.1.1. By Destination Type
- 8.2.2. Freight Forwarding
- 8.2.2.1. By Mode Of Transport
- 8.2.2.1.1. Air
- 8.2.2.1.2. Sea and Inland Waterways
- 8.2.2.1.3. Others
- 8.2.2.1. By Mode Of Transport
- 8.2.3. Freight Transport
- 8.2.3.1. Pipelines
- 8.2.3.2. Rail
- 8.2.3.3. Road
- 8.2.4. Warehousing and Storage
- 8.2.4.1. By Temperature Control
- 8.2.4.1.1. Non-Temperature Controlled
- 8.2.4.1. By Temperature Control
- 8.2.5. Other Services
- 8.2.1. Courier, Express, and Parcel (CEP)
- 8.1. Market Analysis, Insights and Forecast - by End User Industry
- 9. Middle East & Africa Logistics Industry Australia Analysis, Insights and Forecast, 2020-2032
- 9.1. Market Analysis, Insights and Forecast - by End User Industry
- 9.1.1. Agriculture, Fishing, and Forestry
- 9.1.2. Construction
- 9.1.3. Manufacturing
- 9.1.4. Oil and Gas, Mining and Quarrying
- 9.1.5. Wholesale and Retail Trade
- 9.1.6. Others
- 9.2. Market Analysis, Insights and Forecast - by Logistics Function
- 9.2.1. Courier, Express, and Parcel (CEP)
- 9.2.1.1. By Destination Type
- 9.2.1.1.1. Domestic
- 9.2.1.1.2. International
- 9.2.1.1. By Destination Type
- 9.2.2. Freight Forwarding
- 9.2.2.1. By Mode Of Transport
- 9.2.2.1.1. Air
- 9.2.2.1.2. Sea and Inland Waterways
- 9.2.2.1.3. Others
- 9.2.2.1. By Mode Of Transport
- 9.2.3. Freight Transport
- 9.2.3.1. Pipelines
- 9.2.3.2. Rail
- 9.2.3.3. Road
- 9.2.4. Warehousing and Storage
- 9.2.4.1. By Temperature Control
- 9.2.4.1.1. Non-Temperature Controlled
- 9.2.4.1. By Temperature Control
- 9.2.5. Other Services
- 9.2.1. Courier, Express, and Parcel (CEP)
- 9.1. Market Analysis, Insights and Forecast - by End User Industry
- 10. Asia Pacific Logistics Industry Australia Analysis, Insights and Forecast, 2020-2032
- 10.1. Market Analysis, Insights and Forecast - by End User Industry
- 10.1.1. Agriculture, Fishing, and Forestry
- 10.1.2. Construction
- 10.1.3. Manufacturing
- 10.1.4. Oil and Gas, Mining and Quarrying
- 10.1.5. Wholesale and Retail Trade
- 10.1.6. Others
- 10.2. Market Analysis, Insights and Forecast - by Logistics Function
- 10.2.1. Courier, Express, and Parcel (CEP)
- 10.2.1.1. By Destination Type
- 10.2.1.1.1. Domestic
- 10.2.1.1.2. International
- 10.2.1.1. By Destination Type
- 10.2.2. Freight Forwarding
- 10.2.2.1. By Mode Of Transport
- 10.2.2.1.1. Air
- 10.2.2.1.2. Sea and Inland Waterways
- 10.2.2.1.3. Others
- 10.2.2.1. By Mode Of Transport
- 10.2.3. Freight Transport
- 10.2.3.1. Pipelines
- 10.2.3.2. Rail
- 10.2.3.3. Road
- 10.2.4. Warehousing and Storage
- 10.2.4.1. By Temperature Control
- 10.2.4.1.1. Non-Temperature Controlled
- 10.2.4.1. By Temperature Control
- 10.2.5. Other Services
- 10.2.1. Courier, Express, and Parcel (CEP)
- 10.1. Market Analysis, Insights and Forecast - by End User Industry
- 11. Competitive Analysis
- 11.1. Global Market Share Analysis 2025
- 11.2. Company Profiles
- 11.2.1 DB Schenker
- 11.2.1.1. Overview
- 11.2.1.2. Products
- 11.2.1.3. SWOT Analysis
- 11.2.1.4. Recent Developments
- 11.2.1.5. Financials (Based on Availability)
- 11.2.2 Japan Post Holdings Co Ltd (including Toll Group)
- 11.2.2.1. Overview
- 11.2.2.2. Products
- 11.2.2.3. SWOT Analysis
- 11.2.2.4. Recent Developments
- 11.2.2.5. Financials (Based on Availability)
- 11.2.3 Aurizon Holdings Limited
- 11.2.3.1. Overview
- 11.2.3.2. Products
- 11.2.3.3. SWOT Analysis
- 11.2.3.4. Recent Developments
- 11.2.3.5. Financials (Based on Availability)
- 11.2.4 DHL Group
- 11.2.4.1. Overview
- 11.2.4.2. Products
- 11.2.4.3. SWOT Analysis
- 11.2.4.4. Recent Developments
- 11.2.4.5. Financials (Based on Availability)
- 11.2.5 DSV A/S (De Sammensluttede Vognmænd af Air and Sea)
- 11.2.5.1. Overview
- 11.2.5.2. Products
- 11.2.5.3. SWOT Analysis
- 11.2.5.4. Recent Developments
- 11.2.5.5. Financials (Based on Availability)
- 11.2.6 FedEx
- 11.2.6.1. Overview
- 11.2.6.2. Products
- 11.2.6.3. SWOT Analysis
- 11.2.6.4. Recent Developments
- 11.2.6.5. Financials (Based on Availability)
- 11.2.7 Qube Holdings Ltd
- 11.2.7.1. Overview
- 11.2.7.2. Products
- 11.2.7.3. SWOT Analysis
- 11.2.7.4. Recent Developments
- 11.2.7.5. Financials (Based on Availability)
- 11.2.8 LINX Cargo Care Group
- 11.2.8.1. Overview
- 11.2.8.2. Products
- 11.2.8.3. SWOT Analysis
- 11.2.8.4. Recent Developments
- 11.2.8.5. Financials (Based on Availability)
- 11.2.9 Kuehne + Nagel
- 11.2.9.1. Overview
- 11.2.9.2. Products
- 11.2.9.3. SWOT Analysis
- 11.2.9.4. Recent Developments
- 11.2.9.5. Financials (Based on Availability)
- 11.2.10 Linfox Pty Ltd
- 11.2.10.1. Overview
- 11.2.10.2. Products
- 11.2.10.3. SWOT Analysis
- 11.2.10.4. Recent Developments
- 11.2.10.5. Financials (Based on Availability)
- 11.2.11 K&S Corporation Limited
- 11.2.11.1. Overview
- 11.2.11.2. Products
- 11.2.11.3. SWOT Analysis
- 11.2.11.4. Recent Developments
- 11.2.11.5. Financials (Based on Availability)
- 11.2.12 Toll Grou
- 11.2.12.1. Overview
- 11.2.12.2. Products
- 11.2.12.3. SWOT Analysis
- 11.2.12.4. Recent Developments
- 11.2.12.5. Financials (Based on Availability)
- 11.2.13 Centurion Transport
- 11.2.13.1. Overview
- 11.2.13.2. Products
- 11.2.13.3. SWOT Analysis
- 11.2.13.4. Recent Developments
- 11.2.13.5. Financials (Based on Availability)
- 11.2.1 DB Schenker
List of Figures
- Figure 1: Global Logistics Industry Australia Revenue Breakdown (billion, %) by Region 2025 & 2033
- Figure 2: North America Logistics Industry Australia Revenue (billion), by End User Industry 2025 & 2033
- Figure 3: North America Logistics Industry Australia Revenue Share (%), by End User Industry 2025 & 2033
- Figure 4: North America Logistics Industry Australia Revenue (billion), by Logistics Function 2025 & 2033
- Figure 5: North America Logistics Industry Australia Revenue Share (%), by Logistics Function 2025 & 2033
- Figure 6: North America Logistics Industry Australia Revenue (billion), by Country 2025 & 2033
- Figure 7: North America Logistics Industry Australia Revenue Share (%), by Country 2025 & 2033
- Figure 8: South America Logistics Industry Australia Revenue (billion), by End User Industry 2025 & 2033
- Figure 9: South America Logistics Industry Australia Revenue Share (%), by End User Industry 2025 & 2033
- Figure 10: South America Logistics Industry Australia Revenue (billion), by Logistics Function 2025 & 2033
- Figure 11: South America Logistics Industry Australia Revenue Share (%), by Logistics Function 2025 & 2033
- Figure 12: South America Logistics Industry Australia Revenue (billion), by Country 2025 & 2033
- Figure 13: South America Logistics Industry Australia Revenue Share (%), by Country 2025 & 2033
- Figure 14: Europe Logistics Industry Australia Revenue (billion), by End User Industry 2025 & 2033
- Figure 15: Europe Logistics Industry Australia Revenue Share (%), by End User Industry 2025 & 2033
- Figure 16: Europe Logistics Industry Australia Revenue (billion), by Logistics Function 2025 & 2033
- Figure 17: Europe Logistics Industry Australia Revenue Share (%), by Logistics Function 2025 & 2033
- Figure 18: Europe Logistics Industry Australia Revenue (billion), by Country 2025 & 2033
- Figure 19: Europe Logistics Industry Australia Revenue Share (%), by Country 2025 & 2033
- Figure 20: Middle East & Africa Logistics Industry Australia Revenue (billion), by End User Industry 2025 & 2033
- Figure 21: Middle East & Africa Logistics Industry Australia Revenue Share (%), by End User Industry 2025 & 2033
- Figure 22: Middle East & Africa Logistics Industry Australia Revenue (billion), by Logistics Function 2025 & 2033
- Figure 23: Middle East & Africa Logistics Industry Australia Revenue Share (%), by Logistics Function 2025 & 2033
- Figure 24: Middle East & Africa Logistics Industry Australia Revenue (billion), by Country 2025 & 2033
- Figure 25: Middle East & Africa Logistics Industry Australia Revenue Share (%), by Country 2025 & 2033
- Figure 26: Asia Pacific Logistics Industry Australia Revenue (billion), by End User Industry 2025 & 2033
- Figure 27: Asia Pacific Logistics Industry Australia Revenue Share (%), by End User Industry 2025 & 2033
- Figure 28: Asia Pacific Logistics Industry Australia Revenue (billion), by Logistics Function 2025 & 2033
- Figure 29: Asia Pacific Logistics Industry Australia Revenue Share (%), by Logistics Function 2025 & 2033
- Figure 30: Asia Pacific Logistics Industry Australia Revenue (billion), by Country 2025 & 2033
- Figure 31: Asia Pacific Logistics Industry Australia Revenue Share (%), by Country 2025 & 2033
List of Tables
- Table 1: Global Logistics Industry Australia Revenue billion Forecast, by End User Industry 2020 & 2033
- Table 2: Global Logistics Industry Australia Revenue billion Forecast, by Logistics Function 2020 & 2033
- Table 3: Global Logistics Industry Australia Revenue billion Forecast, by Region 2020 & 2033
- Table 4: Global Logistics Industry Australia Revenue billion Forecast, by End User Industry 2020 & 2033
- Table 5: Global Logistics Industry Australia Revenue billion Forecast, by Logistics Function 2020 & 2033
- Table 6: Global Logistics Industry Australia Revenue billion Forecast, by Country 2020 & 2033
- Table 7: United States Logistics Industry Australia Revenue (billion) Forecast, by Application 2020 & 2033
- Table 8: Canada Logistics Industry Australia Revenue (billion) Forecast, by Application 2020 & 2033
- Table 9: Mexico Logistics Industry Australia Revenue (billion) Forecast, by Application 2020 & 2033
- Table 10: Global Logistics Industry Australia Revenue billion Forecast, by End User Industry 2020 & 2033
- Table 11: Global Logistics Industry Australia Revenue billion Forecast, by Logistics Function 2020 & 2033
- Table 12: Global Logistics Industry Australia Revenue billion Forecast, by Country 2020 & 2033
- Table 13: Brazil Logistics Industry Australia Revenue (billion) Forecast, by Application 2020 & 2033
- Table 14: Argentina Logistics Industry Australia Revenue (billion) Forecast, by Application 2020 & 2033
- Table 15: Rest of South America Logistics Industry Australia Revenue (billion) Forecast, by Application 2020 & 2033
- Table 16: Global Logistics Industry Australia Revenue billion Forecast, by End User Industry 2020 & 2033
- Table 17: Global Logistics Industry Australia Revenue billion Forecast, by Logistics Function 2020 & 2033
- Table 18: Global Logistics Industry Australia Revenue billion Forecast, by Country 2020 & 2033
- Table 19: United Kingdom Logistics Industry Australia Revenue (billion) Forecast, by Application 2020 & 2033
- Table 20: Germany Logistics Industry Australia Revenue (billion) Forecast, by Application 2020 & 2033
- Table 21: France Logistics Industry Australia Revenue (billion) Forecast, by Application 2020 & 2033
- Table 22: Italy Logistics Industry Australia Revenue (billion) Forecast, by Application 2020 & 2033
- Table 23: Spain Logistics Industry Australia Revenue (billion) Forecast, by Application 2020 & 2033
- Table 24: Russia Logistics Industry Australia Revenue (billion) Forecast, by Application 2020 & 2033
- Table 25: Benelux Logistics Industry Australia Revenue (billion) Forecast, by Application 2020 & 2033
- Table 26: Nordics Logistics Industry Australia Revenue (billion) Forecast, by Application 2020 & 2033
- Table 27: Rest of Europe Logistics Industry Australia Revenue (billion) Forecast, by Application 2020 & 2033
- Table 28: Global Logistics Industry Australia Revenue billion Forecast, by End User Industry 2020 & 2033
- Table 29: Global Logistics Industry Australia Revenue billion Forecast, by Logistics Function 2020 & 2033
- Table 30: Global Logistics Industry Australia Revenue billion Forecast, by Country 2020 & 2033
- Table 31: Turkey Logistics Industry Australia Revenue (billion) Forecast, by Application 2020 & 2033
- Table 32: Israel Logistics Industry Australia Revenue (billion) Forecast, by Application 2020 & 2033
- Table 33: GCC Logistics Industry Australia Revenue (billion) Forecast, by Application 2020 & 2033
- Table 34: North Africa Logistics Industry Australia Revenue (billion) Forecast, by Application 2020 & 2033
- Table 35: South Africa Logistics Industry Australia Revenue (billion) Forecast, by Application 2020 & 2033
- Table 36: Rest of Middle East & Africa Logistics Industry Australia Revenue (billion) Forecast, by Application 2020 & 2033
- Table 37: Global Logistics Industry Australia Revenue billion Forecast, by End User Industry 2020 & 2033
- Table 38: Global Logistics Industry Australia Revenue billion Forecast, by Logistics Function 2020 & 2033
- Table 39: Global Logistics Industry Australia Revenue billion Forecast, by Country 2020 & 2033
- Table 40: China Logistics Industry Australia Revenue (billion) Forecast, by Application 2020 & 2033
- Table 41: India Logistics Industry Australia Revenue (billion) Forecast, by Application 2020 & 2033
- Table 42: Japan Logistics Industry Australia Revenue (billion) Forecast, by Application 2020 & 2033
- Table 43: South Korea Logistics Industry Australia Revenue (billion) Forecast, by Application 2020 & 2033
- Table 44: ASEAN Logistics Industry Australia Revenue (billion) Forecast, by Application 2020 & 2033
- Table 45: Oceania Logistics Industry Australia Revenue (billion) Forecast, by Application 2020 & 2033
- Table 46: Rest of Asia Pacific Logistics Industry Australia Revenue (billion) Forecast, by Application 2020 & 2033
Frequently Asked Questions
1. What is the projected Compound Annual Growth Rate (CAGR) of the Logistics Industry Australia?
The projected CAGR is approximately 1%.
2. Which companies are prominent players in the Logistics Industry Australia?
Key companies in the market include DB Schenker, Japan Post Holdings Co Ltd (including Toll Group), Aurizon Holdings Limited, DHL Group, DSV A/S (De Sammensluttede Vognmænd af Air and Sea), FedEx, Qube Holdings Ltd, LINX Cargo Care Group, Kuehne + Nagel, Linfox Pty Ltd, K&S Corporation Limited, Toll Grou, Centurion Transport.
3. What are the main segments of the Logistics Industry Australia?
The market segments include End User Industry, Logistics Function.
4. Can you provide details about the market size?
The market size is estimated to be USD 137.7 billion as of 2022.
5. What are some drivers contributing to market growth?
4.; Increase demand of Petrochemical is driving the market4.; Increase in Investments is driving the market.
6. What are the notable trends driving market growth?
OTHER KEY INDUSTRY TRENDS COVERED IN THE REPORT.
7. Are there any restraints impacting market growth?
4.; High Cost of Operations.
8. Can you provide examples of recent developments in the market?
February 2024: DHL Supply Chain (DHL) is continuing the decarbonization of its Australian transport fleet by introducing additional new electric vehicles. The company has added two Terberg YT200EV electric yard tractors to its truck fleet and is supporting Australian electric vehicle manufacturing with the introduction of its first SEA Electric light duty truck to its last-mile fleet.January 2024: DHL Express has commenced services for the final Boeing 777 freighter deployed at the South Asia Hub in Singapore. With a payload capability of 102 tons, the aircraft joins the four other Boeing 777 freighters already deployed in Singapore to boost inter-continental connectivity between the Asia Pacific and the Americas. Sporting a dual DHL-Singapore Airlines (SIA) livery, these five freighters provide a total of 1,224 tons of payload capacity to meet growing customer demand for international express shipping services.January 2024: Kuehne + Nagel has announced its Book & Claim insetting solution for electric vehicles, to improve its decarbonization solutions. Developing Book & Claim insetting solutions for road freight was a strategic priority for Kuehne + Nagel. Customers who use Kuehne + Nagel's road transport services can now claim the carbon reductions of electric trucks when it is not possible to physically move their goods on these vehicles.
9. What pricing options are available for accessing the report?
Pricing options include single-user, multi-user, and enterprise licenses priced at USD 3800, USD 4500, and USD 5800 respectively.
10. Is the market size provided in terms of value or volume?
The market size is provided in terms of value, measured in billion.
11. Are there any specific market keywords associated with the report?
Yes, the market keyword associated with the report is "Logistics Industry Australia," which aids in identifying and referencing the specific market segment covered.
12. How do I determine which pricing option suits my needs best?
The pricing options vary based on user requirements and access needs. Individual users may opt for single-user licenses, while businesses requiring broader access may choose multi-user or enterprise licenses for cost-effective access to the report.
13. Are there any additional resources or data provided in the Logistics Industry Australia report?
While the report offers comprehensive insights, it's advisable to review the specific contents or supplementary materials provided to ascertain if additional resources or data are available.
14. How can I stay updated on further developments or reports in the Logistics Industry Australia?
To stay informed about further developments, trends, and reports in the Logistics Industry Australia, consider subscribing to industry newsletters, following relevant companies and organizations, or regularly checking reputable industry news sources and publications.
Methodology
Step 1 - Identification of Relevant Samples Size from Population Database


Step 2 - Approaches for Defining Global Market Size (Value, Volume* & Price*)

Note*: In applicable scenarios
Step 3 - Data Sources
Primary Research
- Web Analytics
- Survey Reports
- Research Institute
- Latest Research Reports
- Opinion Leaders
Secondary Research
- Annual Reports
- White Paper
- Latest Press Release
- Industry Association
- Paid Database
- Investor Presentations

Step 4 - Data Triangulation
Involves using different sources of information in order to increase the validity of a study
These sources are likely to be stakeholders in a program - participants, other researchers, program staff, other community members, and so on.
Then we put all data in single framework & apply various statistical tools to find out the dynamic on the market.
During the analysis stage, feedback from the stakeholder groups would be compared to determine areas of agreement as well as areas of divergence