

Key Insights
The Asia-Pacific (APAC) road freight market is projected for significant expansion. Valued at $68827.8 million in the base year of 2024, the market is expected to grow at a Compound Annual Growth Rate (CAGR) of 5.3%. This growth is driven by the rapid expansion of e-commerce, necessitating efficient last-mile delivery solutions. Concurrent infrastructure development across APAC, particularly in Southeast Asia, is enhancing long-haul freight capabilities. The adoption of advanced logistics technologies, including software and GPS tracking, is improving operational efficiency and supply chain transparency, further contributing to market growth. Diverse end-user industries such as manufacturing, construction, and retail also bolster overall demand. Key challenges include volatile fuel prices, driver shortages, and evolving emission and safety regulations. The market is segmented by transport distance (long and short haul), goods configuration (fluid, solid, temperature-controlled), and end-user industries, with China, India, and Japan leading market share. While Full-Truck-Load (FTL) shipments currently dominate, Less-than-Truck-Load (LTL) shipments are anticipated to increase with the rise of e-commerce.
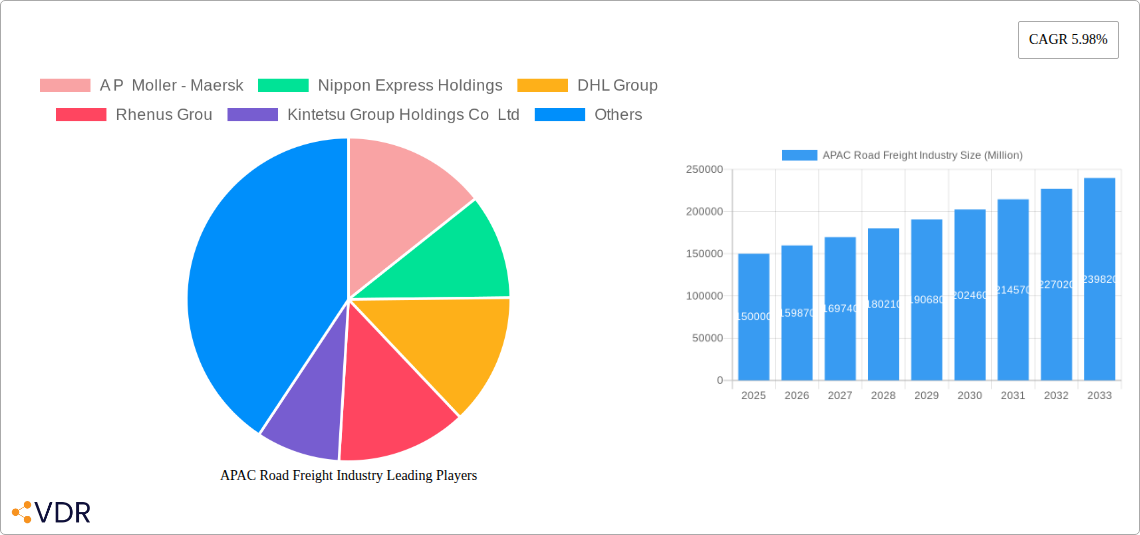
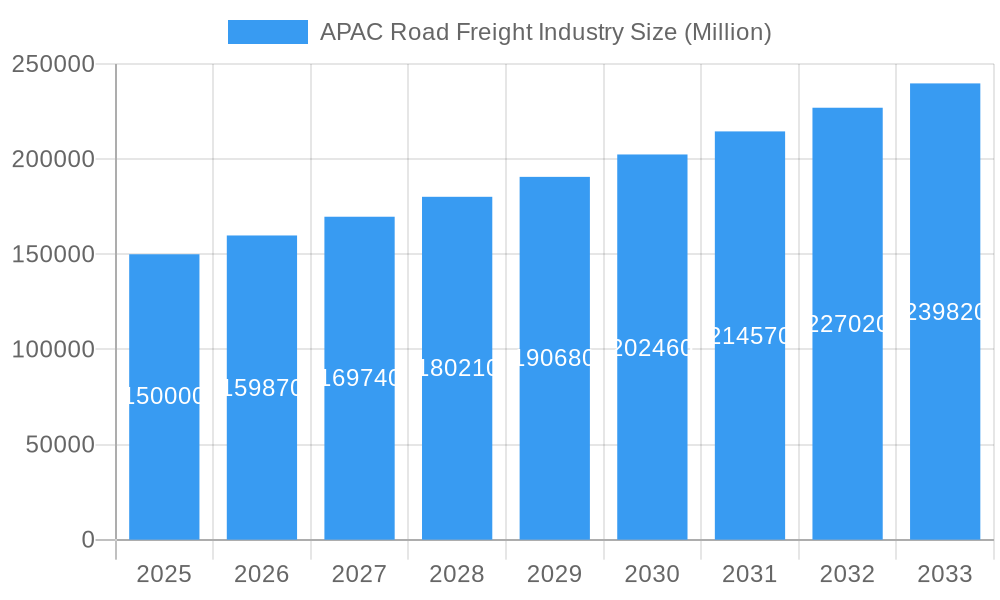
APAC Road Freight Industry Market Size (In Billion)
The competitive arena features both international leaders such as A.P. Moller-Maersk and DHL, and prominent regional enterprises. These entities are actively pursuing technological advancements, network expansion, and sustainable operational practices to secure their market standing. The APAC road freight sector demonstrates a promising outlook with considerable growth potential. Addressing existing challenges, investing in advanced technologies, improving infrastructure, and mitigating driver shortages will be critical for maximizing the industry's potential and ensuring sustainable, efficient operations. A growing emphasis on eco-friendly practices, including the integration of electric and hybrid vehicles, will also significantly influence the sector's future trajectory.
APAC Road Freight Industry Company Market Share
APAC Road Freight Industry Market Report: 2019-2033
This comprehensive report provides a detailed analysis of the Asia-Pacific (APAC) road freight industry, covering market dynamics, growth trends, dominant segments, and key players. With a focus on the period 2019-2033, this report offers invaluable insights for industry professionals, investors, and strategists seeking to navigate this dynamic landscape. The report utilizes data from 2019-2024 as the historical period, 2025 as the base year, and projects the market outlook until 2033. Market values are presented in Million units.
APAC Road Freight Industry Market Dynamics & Structure
The APAC road freight market is characterized by a moderately concentrated landscape with key players like A P Moller - Maersk, Nippon Express Holdings, DHL Group, and CMA CGM Group holding significant market share. However, the market is also experiencing increased competition from smaller, specialized providers. Technological innovation, particularly in telematics, route optimization software, and electric vehicle adoption, is a major driver of growth. Regulatory frameworks, including emission standards and driver regulations, significantly influence operational costs and strategies. The emergence of electric vehicles presents a compelling substitute for traditional diesel trucks, pushing for decarbonization and influencing the overall cost structure. End-user demographics, particularly the rise of e-commerce, are fueling demand for last-mile delivery solutions. M&A activity is relatively high, reflecting consolidation and expansion strategies among major players. We estimate that approximately xx M&A deals occurred in the APAC road freight sector between 2019 and 2024, with a total value of xx Million.
- Market Concentration: Moderately concentrated, with top players holding xx% market share in 2025.
- Technological Innovation: Focus on telematics, route optimization, and electric vehicle integration.
- Regulatory Framework: Emission standards and driver regulations impact operational costs.
- Competitive Substitutes: Electric vehicles present a key challenge and opportunity.
- End-User Demographics: E-commerce growth drives demand for last-mile delivery.
- M&A Trends: Significant M&A activity driven by consolidation and expansion.
APAC Road Freight Industry Growth Trends & Insights
The APAC road freight market experienced robust growth during the historical period (2019-2024), driven primarily by increasing industrial activity and e-commerce expansion. The market size reached xx Million in 2024. The industry exhibits a Compound Annual Growth Rate (CAGR) of xx% during the historical period. Technological disruptions, such as the implementation of advanced logistics technologies, are enhancing efficiency and creating new business models. The adoption rate of these technologies is projected to increase from xx% in 2024 to xx% by 2033. Consumer behavior shifts toward greater convenience and faster delivery times further fuel demand. We project the market to reach xx Million by 2033, exhibiting a CAGR of xx% during the forecast period (2025-2033). Market penetration for temperature-controlled transportation is expected to increase from xx% to xx% within the same period.
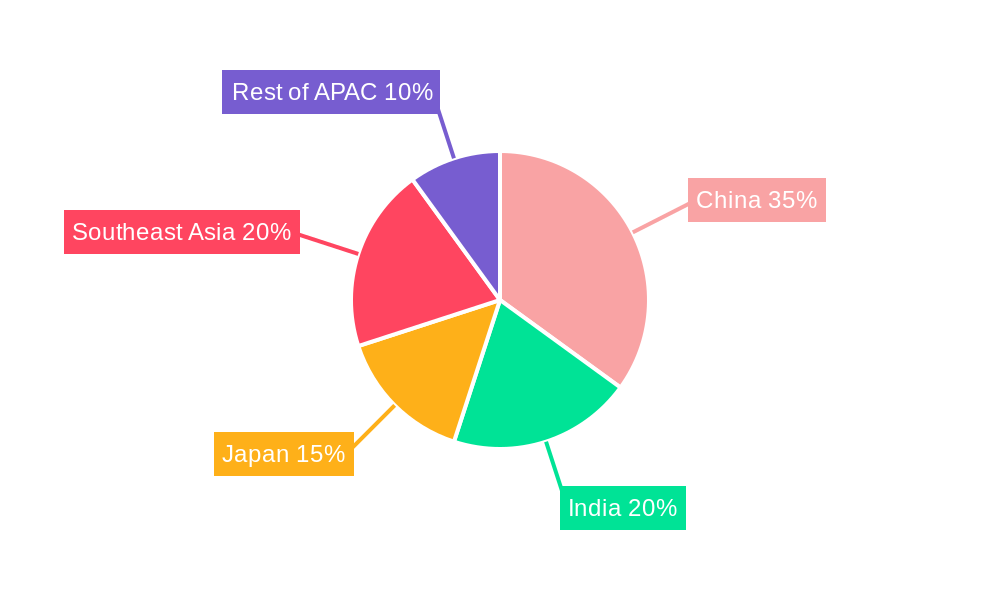
Dominant Regions, Countries, or Segments in APAC Road Freight Industry
China remains the dominant market within APAC, accounting for xx% of the total market value in 2025, followed by India (xx%) and Japan (xx%). Within segments, Long Haul transportation holds the largest share (xx%), driven by inter-regional trade. Solid Goods transportation accounts for xx% of the market, significantly surpassing Fluid Goods. Non-Temperature Controlled transportation constitutes the majority of the market (xx%). The Manufacturing and Wholesale and Retail Trade end-user industries contribute the most to market demand, together comprising over xx% of total volume. International transport dominates the Destination segment (xx%). Full Truck Load (FTL) shipments continue to be prevalent (xx%), while Containerized shipments are increasing at a faster rate.
- Key Drivers: Strong economic growth in key countries, expanding infrastructure, and rising e-commerce.
- China's Dominance: Driven by its massive manufacturing base and expanding logistics network.
- India's Growth Potential: Rapid economic growth and infrastructure development offer significant opportunities.
- Long Haul Dominance: Reflecting substantial inter-regional trade flows.
- Solid Goods Preeminence: Driven by the manufacturing sector's prominence.
APAC Road Freight Industry Product Landscape
The product landscape is characterized by increasing sophistication in transportation management systems (TMS), route optimization software, and telematics solutions. These innovations enhance efficiency, reduce operational costs, and improve delivery times. The integration of electric and alternative fuel vehicles is gaining traction, driven by environmental concerns and regulatory pressures. Unique selling propositions often center around speed, reliability, and advanced technological capabilities.
Key Drivers, Barriers & Challenges in APAP Road Freight Industry
Key Drivers:
- Growing e-commerce and consumer demand for faster deliveries.
- Expansion of manufacturing and industrial activities across the region.
- Increasing investments in infrastructure development and logistics networks.
Key Challenges and Restraints:
- Driver shortages and high labor costs. The industry faces a shortage of xx thousand drivers in 2025, impacting operational efficiency.
- Fluctuating fuel prices and their impact on operational costs. Fuel price volatility increases operational uncertainty by xx%.
- Stringent regulatory compliance requirements, leading to increased administrative burden.
- Intense competition among existing and new market entrants.
Emerging Opportunities in APAP Road Freight Industry
- Growing demand for last-mile delivery solutions, particularly in urban areas.
- Increased adoption of technology-driven solutions such as AI-powered route optimization and autonomous vehicles.
- Expansion into underserved rural markets and the development of sustainable logistics solutions.
Growth Accelerators in the APAC Road Freight Industry
Technological advancements, particularly in autonomous driving and electric vehicles, are poised to revolutionize the industry. Strategic partnerships and collaborations among logistics providers, technology companies, and infrastructure developers are creating new growth opportunities. The expansion into emerging markets and the development of sustainable logistics solutions are also driving long-term growth.
Key Players Shaping the APAC Road Freight Industry Market
- A P Moller - Maersk
- Nippon Express Holdings
- DHL Group
- Rhenus Group
- Kintetsu Group Holdings Co Ltd
- C H Robinson
- Expeditors International of Washington Inc
- CMA CGM Group
Notable Milestones in APAC Road Freight Industry Sector
- January 2024: DHL Express deploys final Boeing 777 freighter in Singapore, boosting Asia-Pacific to Americas connectivity.
- November 2023: DHL Express launches EUR 562 million Central Asia Hub in Hong Kong, its largest APAC investment.
- October 2023: Volvo, Renault, and CMA CGM unveil a joint venture to develop electric vans for logistics.
In-Depth APAC Road Freight Industry Market Outlook
The APAC road freight industry is poised for continued growth, driven by technological innovation, infrastructure development, and the expanding e-commerce sector. Strategic partnerships and investments in sustainable solutions will be critical for long-term success. The market's evolution toward greater efficiency, sustainability, and digitalization presents substantial opportunities for both established players and new entrants. The projected market size of xx Million by 2033 underscores the significant potential for growth and investment in this dynamic industry.
APAC Road Freight Industry Segmentation
-
1. End User Industry
- 1.1. Agriculture, Fishing, and Forestry
- 1.2. Construction
- 1.3. Manufacturing
- 1.4. Oil and Gas, Mining and Quarrying
- 1.5. Wholesale and Retail Trade
- 1.6. Others
-
2. Destination
- 2.1. Domestic
- 2.2. International
-
3. Truckload Specification
- 3.1. Full-Truck-Load (FTL)
- 3.2. Less than-Truck-Load (LTL)
-
4. Containerization
- 4.1. Containerized
- 4.2. Non-Containerized
-
5. Distance
- 5.1. Long Haul
- 5.2. Short Haul
-
6. Goods Configuration
- 6.1. Fluid Goods
- 6.2. Solid Goods
-
7. Temperature Control
- 7.1. Non-Temperature Controlled
APAC Road Freight Industry Segmentation By Geography
-
1. North America
- 1.1. United States
- 1.2. Canada
- 1.3. Mexico
-
2. South America
- 2.1. Brazil
- 2.2. Argentina
- 2.3. Rest of South America
-
3. Europe
- 3.1. United Kingdom
- 3.2. Germany
- 3.3. France
- 3.4. Italy
- 3.5. Spain
- 3.6. Russia
- 3.7. Benelux
- 3.8. Nordics
- 3.9. Rest of Europe
-
4. Middle East & Africa
- 4.1. Turkey
- 4.2. Israel
- 4.3. GCC
- 4.4. North Africa
- 4.5. South Africa
- 4.6. Rest of Middle East & Africa
-
5. Asia Pacific
- 5.1. China
- 5.2. India
- 5.3. Japan
- 5.4. South Korea
- 5.5. ASEAN
- 5.6. Oceania
- 5.7. Rest of Asia Pacific
APAC Road Freight Industry Regional Market Share
Geographic Coverage of APAC Road Freight Industry
APAC Road Freight Industry REPORT HIGHLIGHTS
| Aspects | Details |
|---|---|
| Study Period | 2020-2034 |
| Base Year | 2025 |
| Estimated Year | 2026 |
| Forecast Period | 2026-2034 |
| Historical Period | 2020-2025 |
| Growth Rate | CAGR of 5.3% from 2020-2034 |
| Segmentation |
|
Table of Contents
- 1. Introduction
- 1.1. Research Scope
- 1.2. Market Segmentation
- 1.3. Research Objective
- 1.4. Definitions and Assumptions
- 2. Executive Summary
- 2.1. Market Snapshot
- 3. Market Dynamics
- 3.1. Market Drivers
- 3.2. Market Restrains
- 3.3. Market Trends
- 3.4. Market Opportunities
- 4. Market Factor Analysis
- 4.1. Porters Five Forces
- 4.1.1. Bargaining Power of Suppliers
- 4.1.2. Bargaining Power of Buyers
- 4.1.3. Threat of New Entrants
- 4.1.4. Threat of Substitutes
- 4.1.5. Competitive Rivalry
- 4.2. PESTEL analysis
- 4.3. BCG Analysis
- 4.3.1. Stars (High Growth, High Market Share)
- 4.3.2. Cash Cows (Low Growth, High Market Share)
- 4.3.3. Question Mark (High Growth, Low Market Share)
- 4.3.4. Dogs (Low Growth, Low Market Share)
- 4.4. Ansoff Matrix Analysis
- 4.5. Supply Chain Analysis
- 4.6. Regulatory Landscape
- 4.7. Current Market Potential and Opportunity Assessment (TAM–SAM–SOM Framework)
- 4.8. VDR Analyst Note
- 4.1. Porters Five Forces
- 5. Market Analysis, Insights and Forecast 2021-2033
- 5.1. Market Analysis, Insights and Forecast - by End User Industry
- 5.1.1. Agriculture, Fishing, and Forestry
- 5.1.2. Construction
- 5.1.3. Manufacturing
- 5.1.4. Oil and Gas, Mining and Quarrying
- 5.1.5. Wholesale and Retail Trade
- 5.1.6. Others
- 5.2. Market Analysis, Insights and Forecast - by Destination
- 5.2.1. Domestic
- 5.2.2. International
- 5.3. Market Analysis, Insights and Forecast - by Truckload Specification
- 5.3.1. Full-Truck-Load (FTL)
- 5.3.2. Less than-Truck-Load (LTL)
- 5.4. Market Analysis, Insights and Forecast - by Containerization
- 5.4.1. Containerized
- 5.4.2. Non-Containerized
- 5.5. Market Analysis, Insights and Forecast - by Distance
- 5.5.1. Long Haul
- 5.5.2. Short Haul
- 5.6. Market Analysis, Insights and Forecast - by Goods Configuration
- 5.6.1. Fluid Goods
- 5.6.2. Solid Goods
- 5.7. Market Analysis, Insights and Forecast - by Temperature Control
- 5.7.1. Non-Temperature Controlled
- 5.8. Market Analysis, Insights and Forecast - by Region
- 5.8.1. North America
- 5.8.2. South America
- 5.8.3. Europe
- 5.8.4. Middle East & Africa
- 5.8.5. Asia Pacific
- 5.1. Market Analysis, Insights and Forecast - by End User Industry
- 6. Global APAC Road Freight Industry Analysis, Insights and Forecast, 2021-2033
- 6.1. Market Analysis, Insights and Forecast - by End User Industry
- 6.1.1. Agriculture, Fishing, and Forestry
- 6.1.2. Construction
- 6.1.3. Manufacturing
- 6.1.4. Oil and Gas, Mining and Quarrying
- 6.1.5. Wholesale and Retail Trade
- 6.1.6. Others
- 6.2. Market Analysis, Insights and Forecast - by Destination
- 6.2.1. Domestic
- 6.2.2. International
- 6.3. Market Analysis, Insights and Forecast - by Truckload Specification
- 6.3.1. Full-Truck-Load (FTL)
- 6.3.2. Less than-Truck-Load (LTL)
- 6.4. Market Analysis, Insights and Forecast - by Containerization
- 6.4.1. Containerized
- 6.4.2. Non-Containerized
- 6.5. Market Analysis, Insights and Forecast - by Distance
- 6.5.1. Long Haul
- 6.5.2. Short Haul
- 6.6. Market Analysis, Insights and Forecast - by Goods Configuration
- 6.6.1. Fluid Goods
- 6.6.2. Solid Goods
- 6.7. Market Analysis, Insights and Forecast - by Temperature Control
- 6.7.1. Non-Temperature Controlled
- 6.1. Market Analysis, Insights and Forecast - by End User Industry
- 7. North America APAC Road Freight Industry Analysis, Insights and Forecast, 2021-2033
- 7.1. Market Analysis, Insights and Forecast - by End User Industry
- 7.1.1. Agriculture, Fishing, and Forestry
- 7.1.2. Construction
- 7.1.3. Manufacturing
- 7.1.4. Oil and Gas, Mining and Quarrying
- 7.1.5. Wholesale and Retail Trade
- 7.1.6. Others
- 7.2. Market Analysis, Insights and Forecast - by Destination
- 7.2.1. Domestic
- 7.2.2. International
- 7.3. Market Analysis, Insights and Forecast - by Truckload Specification
- 7.3.1. Full-Truck-Load (FTL)
- 7.3.2. Less than-Truck-Load (LTL)
- 7.4. Market Analysis, Insights and Forecast - by Containerization
- 7.4.1. Containerized
- 7.4.2. Non-Containerized
- 7.5. Market Analysis, Insights and Forecast - by Distance
- 7.5.1. Long Haul
- 7.5.2. Short Haul
- 7.6. Market Analysis, Insights and Forecast - by Goods Configuration
- 7.6.1. Fluid Goods
- 7.6.2. Solid Goods
- 7.7. Market Analysis, Insights and Forecast - by Temperature Control
- 7.7.1. Non-Temperature Controlled
- 7.1. Market Analysis, Insights and Forecast - by End User Industry
- 8. South America APAC Road Freight Industry Analysis, Insights and Forecast, 2021-2033
- 8.1. Market Analysis, Insights and Forecast - by End User Industry
- 8.1.1. Agriculture, Fishing, and Forestry
- 8.1.2. Construction
- 8.1.3. Manufacturing
- 8.1.4. Oil and Gas, Mining and Quarrying
- 8.1.5. Wholesale and Retail Trade
- 8.1.6. Others
- 8.2. Market Analysis, Insights and Forecast - by Destination
- 8.2.1. Domestic
- 8.2.2. International
- 8.3. Market Analysis, Insights and Forecast - by Truckload Specification
- 8.3.1. Full-Truck-Load (FTL)
- 8.3.2. Less than-Truck-Load (LTL)
- 8.4. Market Analysis, Insights and Forecast - by Containerization
- 8.4.1. Containerized
- 8.4.2. Non-Containerized
- 8.5. Market Analysis, Insights and Forecast - by Distance
- 8.5.1. Long Haul
- 8.5.2. Short Haul
- 8.6. Market Analysis, Insights and Forecast - by Goods Configuration
- 8.6.1. Fluid Goods
- 8.6.2. Solid Goods
- 8.7. Market Analysis, Insights and Forecast - by Temperature Control
- 8.7.1. Non-Temperature Controlled
- 8.1. Market Analysis, Insights and Forecast - by End User Industry
- 9. Europe APAC Road Freight Industry Analysis, Insights and Forecast, 2021-2033
- 9.1. Market Analysis, Insights and Forecast - by End User Industry
- 9.1.1. Agriculture, Fishing, and Forestry
- 9.1.2. Construction
- 9.1.3. Manufacturing
- 9.1.4. Oil and Gas, Mining and Quarrying
- 9.1.5. Wholesale and Retail Trade
- 9.1.6. Others
- 9.2. Market Analysis, Insights and Forecast - by Destination
- 9.2.1. Domestic
- 9.2.2. International
- 9.3. Market Analysis, Insights and Forecast - by Truckload Specification
- 9.3.1. Full-Truck-Load (FTL)
- 9.3.2. Less than-Truck-Load (LTL)
- 9.4. Market Analysis, Insights and Forecast - by Containerization
- 9.4.1. Containerized
- 9.4.2. Non-Containerized
- 9.5. Market Analysis, Insights and Forecast - by Distance
- 9.5.1. Long Haul
- 9.5.2. Short Haul
- 9.6. Market Analysis, Insights and Forecast - by Goods Configuration
- 9.6.1. Fluid Goods
- 9.6.2. Solid Goods
- 9.7. Market Analysis, Insights and Forecast - by Temperature Control
- 9.7.1. Non-Temperature Controlled
- 9.1. Market Analysis, Insights and Forecast - by End User Industry
- 10. Middle East & Africa APAC Road Freight Industry Analysis, Insights and Forecast, 2021-2033
- 10.1. Market Analysis, Insights and Forecast - by End User Industry
- 10.1.1. Agriculture, Fishing, and Forestry
- 10.1.2. Construction
- 10.1.3. Manufacturing
- 10.1.4. Oil and Gas, Mining and Quarrying
- 10.1.5. Wholesale and Retail Trade
- 10.1.6. Others
- 10.2. Market Analysis, Insights and Forecast - by Destination
- 10.2.1. Domestic
- 10.2.2. International
- 10.3. Market Analysis, Insights and Forecast - by Truckload Specification
- 10.3.1. Full-Truck-Load (FTL)
- 10.3.2. Less than-Truck-Load (LTL)
- 10.4. Market Analysis, Insights and Forecast - by Containerization
- 10.4.1. Containerized
- 10.4.2. Non-Containerized
- 10.5. Market Analysis, Insights and Forecast - by Distance
- 10.5.1. Long Haul
- 10.5.2. Short Haul
- 10.6. Market Analysis, Insights and Forecast - by Goods Configuration
- 10.6.1. Fluid Goods
- 10.6.2. Solid Goods
- 10.7. Market Analysis, Insights and Forecast - by Temperature Control
- 10.7.1. Non-Temperature Controlled
- 10.1. Market Analysis, Insights and Forecast - by End User Industry
- 11. Asia Pacific APAC Road Freight Industry Analysis, Insights and Forecast, 2021-2033
- 11.1. Market Analysis, Insights and Forecast - by End User Industry
- 11.1.1. Agriculture, Fishing, and Forestry
- 11.1.2. Construction
- 11.1.3. Manufacturing
- 11.1.4. Oil and Gas, Mining and Quarrying
- 11.1.5. Wholesale and Retail Trade
- 11.1.6. Others
- 11.2. Market Analysis, Insights and Forecast - by Destination
- 11.2.1. Domestic
- 11.2.2. International
- 11.3. Market Analysis, Insights and Forecast - by Truckload Specification
- 11.3.1. Full-Truck-Load (FTL)
- 11.3.2. Less than-Truck-Load (LTL)
- 11.4. Market Analysis, Insights and Forecast - by Containerization
- 11.4.1. Containerized
- 11.4.2. Non-Containerized
- 11.5. Market Analysis, Insights and Forecast - by Distance
- 11.5.1. Long Haul
- 11.5.2. Short Haul
- 11.6. Market Analysis, Insights and Forecast - by Goods Configuration
- 11.6.1. Fluid Goods
- 11.6.2. Solid Goods
- 11.7. Market Analysis, Insights and Forecast - by Temperature Control
- 11.7.1. Non-Temperature Controlled
- 11.1. Market Analysis, Insights and Forecast - by End User Industry
- 12. Competitive Analysis
- 12.1. Company Profiles
- 12.1.1 A P Moller - Maersk
- 12.1.1.1. Company Overview
- 12.1.1.2. Products
- 12.1.1.3. Company Financials
- 12.1.1.4. SWOT Analysis
- 12.1.2 Nippon Express Holdings
- 12.1.2.1. Company Overview
- 12.1.2.2. Products
- 12.1.2.3. Company Financials
- 12.1.2.4. SWOT Analysis
- 12.1.3 DHL Group
- 12.1.3.1. Company Overview
- 12.1.3.2. Products
- 12.1.3.3. Company Financials
- 12.1.3.4. SWOT Analysis
- 12.1.4 Rhenus Grou
- 12.1.4.1. Company Overview
- 12.1.4.2. Products
- 12.1.4.3. Company Financials
- 12.1.4.4. SWOT Analysis
- 12.1.5 Kintetsu Group Holdings Co Ltd
- 12.1.5.1. Company Overview
- 12.1.5.2. Products
- 12.1.5.3. Company Financials
- 12.1.5.4. SWOT Analysis
- 12.1.6 C H Robinson
- 12.1.6.1. Company Overview
- 12.1.6.2. Products
- 12.1.6.3. Company Financials
- 12.1.6.4. SWOT Analysis
- 12.1.7 Expeditors International of Washington Inc
- 12.1.7.1. Company Overview
- 12.1.7.2. Products
- 12.1.7.3. Company Financials
- 12.1.7.4. SWOT Analysis
- 12.1.8 CMA CGM Group
- 12.1.8.1. Company Overview
- 12.1.8.2. Products
- 12.1.8.3. Company Financials
- 12.1.8.4. SWOT Analysis
- 12.1.1 A P Moller - Maersk
- 12.2. Market Entropy
- 12.2.1 Company's Key Areas Served
- 12.2.2 Recent Developments
- 12.3. Company Market Share Analysis 2025
- 12.3.1 Top 5 Companies Market Share Analysis
- 12.3.2 Top 3 Companies Market Share Analysis
- 12.4. List of Potential Customers
- 13. Research Methodology
List of Figures
- Figure 1: Global APAC Road Freight Industry Revenue Breakdown (million, %) by Region 2025 & 2033
- Figure 2: North America APAC Road Freight Industry Revenue (million), by End User Industry 2025 & 2033
- Figure 3: North America APAC Road Freight Industry Revenue Share (%), by End User Industry 2025 & 2033
- Figure 4: North America APAC Road Freight Industry Revenue (million), by Destination 2025 & 2033
- Figure 5: North America APAC Road Freight Industry Revenue Share (%), by Destination 2025 & 2033
- Figure 6: North America APAC Road Freight Industry Revenue (million), by Truckload Specification 2025 & 2033
- Figure 7: North America APAC Road Freight Industry Revenue Share (%), by Truckload Specification 2025 & 2033
- Figure 8: North America APAC Road Freight Industry Revenue (million), by Containerization 2025 & 2033
- Figure 9: North America APAC Road Freight Industry Revenue Share (%), by Containerization 2025 & 2033
- Figure 10: North America APAC Road Freight Industry Revenue (million), by Distance 2025 & 2033
- Figure 11: North America APAC Road Freight Industry Revenue Share (%), by Distance 2025 & 2033
- Figure 12: North America APAC Road Freight Industry Revenue (million), by Goods Configuration 2025 & 2033
- Figure 13: North America APAC Road Freight Industry Revenue Share (%), by Goods Configuration 2025 & 2033
- Figure 14: North America APAC Road Freight Industry Revenue (million), by Temperature Control 2025 & 2033
- Figure 15: North America APAC Road Freight Industry Revenue Share (%), by Temperature Control 2025 & 2033
- Figure 16: North America APAC Road Freight Industry Revenue (million), by Country 2025 & 2033
- Figure 17: North America APAC Road Freight Industry Revenue Share (%), by Country 2025 & 2033
- Figure 18: South America APAC Road Freight Industry Revenue (million), by End User Industry 2025 & 2033
- Figure 19: South America APAC Road Freight Industry Revenue Share (%), by End User Industry 2025 & 2033
- Figure 20: South America APAC Road Freight Industry Revenue (million), by Destination 2025 & 2033
- Figure 21: South America APAC Road Freight Industry Revenue Share (%), by Destination 2025 & 2033
- Figure 22: South America APAC Road Freight Industry Revenue (million), by Truckload Specification 2025 & 2033
- Figure 23: South America APAC Road Freight Industry Revenue Share (%), by Truckload Specification 2025 & 2033
- Figure 24: South America APAC Road Freight Industry Revenue (million), by Containerization 2025 & 2033
- Figure 25: South America APAC Road Freight Industry Revenue Share (%), by Containerization 2025 & 2033
- Figure 26: South America APAC Road Freight Industry Revenue (million), by Distance 2025 & 2033
- Figure 27: South America APAC Road Freight Industry Revenue Share (%), by Distance 2025 & 2033
- Figure 28: South America APAC Road Freight Industry Revenue (million), by Goods Configuration 2025 & 2033
- Figure 29: South America APAC Road Freight Industry Revenue Share (%), by Goods Configuration 2025 & 2033
- Figure 30: South America APAC Road Freight Industry Revenue (million), by Temperature Control 2025 & 2033
- Figure 31: South America APAC Road Freight Industry Revenue Share (%), by Temperature Control 2025 & 2033
- Figure 32: South America APAC Road Freight Industry Revenue (million), by Country 2025 & 2033
- Figure 33: South America APAC Road Freight Industry Revenue Share (%), by Country 2025 & 2033
- Figure 34: Europe APAC Road Freight Industry Revenue (million), by End User Industry 2025 & 2033
- Figure 35: Europe APAC Road Freight Industry Revenue Share (%), by End User Industry 2025 & 2033
- Figure 36: Europe APAC Road Freight Industry Revenue (million), by Destination 2025 & 2033
- Figure 37: Europe APAC Road Freight Industry Revenue Share (%), by Destination 2025 & 2033
- Figure 38: Europe APAC Road Freight Industry Revenue (million), by Truckload Specification 2025 & 2033
- Figure 39: Europe APAC Road Freight Industry Revenue Share (%), by Truckload Specification 2025 & 2033
- Figure 40: Europe APAC Road Freight Industry Revenue (million), by Containerization 2025 & 2033
- Figure 41: Europe APAC Road Freight Industry Revenue Share (%), by Containerization 2025 & 2033
- Figure 42: Europe APAC Road Freight Industry Revenue (million), by Distance 2025 & 2033
- Figure 43: Europe APAC Road Freight Industry Revenue Share (%), by Distance 2025 & 2033
- Figure 44: Europe APAC Road Freight Industry Revenue (million), by Goods Configuration 2025 & 2033
- Figure 45: Europe APAC Road Freight Industry Revenue Share (%), by Goods Configuration 2025 & 2033
- Figure 46: Europe APAC Road Freight Industry Revenue (million), by Temperature Control 2025 & 2033
- Figure 47: Europe APAC Road Freight Industry Revenue Share (%), by Temperature Control 2025 & 2033
- Figure 48: Europe APAC Road Freight Industry Revenue (million), by Country 2025 & 2033
- Figure 49: Europe APAC Road Freight Industry Revenue Share (%), by Country 2025 & 2033
- Figure 50: Middle East & Africa APAC Road Freight Industry Revenue (million), by End User Industry 2025 & 2033
- Figure 51: Middle East & Africa APAC Road Freight Industry Revenue Share (%), by End User Industry 2025 & 2033
- Figure 52: Middle East & Africa APAC Road Freight Industry Revenue (million), by Destination 2025 & 2033
- Figure 53: Middle East & Africa APAC Road Freight Industry Revenue Share (%), by Destination 2025 & 2033
- Figure 54: Middle East & Africa APAC Road Freight Industry Revenue (million), by Truckload Specification 2025 & 2033
- Figure 55: Middle East & Africa APAC Road Freight Industry Revenue Share (%), by Truckload Specification 2025 & 2033
- Figure 56: Middle East & Africa APAC Road Freight Industry Revenue (million), by Containerization 2025 & 2033
- Figure 57: Middle East & Africa APAC Road Freight Industry Revenue Share (%), by Containerization 2025 & 2033
- Figure 58: Middle East & Africa APAC Road Freight Industry Revenue (million), by Distance 2025 & 2033
- Figure 59: Middle East & Africa APAC Road Freight Industry Revenue Share (%), by Distance 2025 & 2033
- Figure 60: Middle East & Africa APAC Road Freight Industry Revenue (million), by Goods Configuration 2025 & 2033
- Figure 61: Middle East & Africa APAC Road Freight Industry Revenue Share (%), by Goods Configuration 2025 & 2033
- Figure 62: Middle East & Africa APAC Road Freight Industry Revenue (million), by Temperature Control 2025 & 2033
- Figure 63: Middle East & Africa APAC Road Freight Industry Revenue Share (%), by Temperature Control 2025 & 2033
- Figure 64: Middle East & Africa APAC Road Freight Industry Revenue (million), by Country 2025 & 2033
- Figure 65: Middle East & Africa APAC Road Freight Industry Revenue Share (%), by Country 2025 & 2033
- Figure 66: Asia Pacific APAC Road Freight Industry Revenue (million), by End User Industry 2025 & 2033
- Figure 67: Asia Pacific APAC Road Freight Industry Revenue Share (%), by End User Industry 2025 & 2033
- Figure 68: Asia Pacific APAC Road Freight Industry Revenue (million), by Destination 2025 & 2033
- Figure 69: Asia Pacific APAC Road Freight Industry Revenue Share (%), by Destination 2025 & 2033
- Figure 70: Asia Pacific APAC Road Freight Industry Revenue (million), by Truckload Specification 2025 & 2033
- Figure 71: Asia Pacific APAC Road Freight Industry Revenue Share (%), by Truckload Specification 2025 & 2033
- Figure 72: Asia Pacific APAC Road Freight Industry Revenue (million), by Containerization 2025 & 2033
- Figure 73: Asia Pacific APAC Road Freight Industry Revenue Share (%), by Containerization 2025 & 2033
- Figure 74: Asia Pacific APAC Road Freight Industry Revenue (million), by Distance 2025 & 2033
- Figure 75: Asia Pacific APAC Road Freight Industry Revenue Share (%), by Distance 2025 & 2033
- Figure 76: Asia Pacific APAC Road Freight Industry Revenue (million), by Goods Configuration 2025 & 2033
- Figure 77: Asia Pacific APAC Road Freight Industry Revenue Share (%), by Goods Configuration 2025 & 2033
- Figure 78: Asia Pacific APAC Road Freight Industry Revenue (million), by Temperature Control 2025 & 2033
- Figure 79: Asia Pacific APAC Road Freight Industry Revenue Share (%), by Temperature Control 2025 & 2033
- Figure 80: Asia Pacific APAC Road Freight Industry Revenue (million), by Country 2025 & 2033
- Figure 81: Asia Pacific APAC Road Freight Industry Revenue Share (%), by Country 2025 & 2033
List of Tables
- Table 1: Global APAC Road Freight Industry Revenue million Forecast, by End User Industry 2020 & 2033
- Table 2: Global APAC Road Freight Industry Revenue million Forecast, by Destination 2020 & 2033
- Table 3: Global APAC Road Freight Industry Revenue million Forecast, by Truckload Specification 2020 & 2033
- Table 4: Global APAC Road Freight Industry Revenue million Forecast, by Containerization 2020 & 2033
- Table 5: Global APAC Road Freight Industry Revenue million Forecast, by Distance 2020 & 2033
- Table 6: Global APAC Road Freight Industry Revenue million Forecast, by Goods Configuration 2020 & 2033
- Table 7: Global APAC Road Freight Industry Revenue million Forecast, by Temperature Control 2020 & 2033
- Table 8: Global APAC Road Freight Industry Revenue million Forecast, by Region 2020 & 2033
- Table 9: Global APAC Road Freight Industry Revenue million Forecast, by End User Industry 2020 & 2033
- Table 10: Global APAC Road Freight Industry Revenue million Forecast, by Destination 2020 & 2033
- Table 11: Global APAC Road Freight Industry Revenue million Forecast, by Truckload Specification 2020 & 2033
- Table 12: Global APAC Road Freight Industry Revenue million Forecast, by Containerization 2020 & 2033
- Table 13: Global APAC Road Freight Industry Revenue million Forecast, by Distance 2020 & 2033
- Table 14: Global APAC Road Freight Industry Revenue million Forecast, by Goods Configuration 2020 & 2033
- Table 15: Global APAC Road Freight Industry Revenue million Forecast, by Temperature Control 2020 & 2033
- Table 16: Global APAC Road Freight Industry Revenue million Forecast, by Country 2020 & 2033
- Table 17: United States APAC Road Freight Industry Revenue (million) Forecast, by Application 2020 & 2033
- Table 18: Canada APAC Road Freight Industry Revenue (million) Forecast, by Application 2020 & 2033
- Table 19: Mexico APAC Road Freight Industry Revenue (million) Forecast, by Application 2020 & 2033
- Table 20: Global APAC Road Freight Industry Revenue million Forecast, by End User Industry 2020 & 2033
- Table 21: Global APAC Road Freight Industry Revenue million Forecast, by Destination 2020 & 2033
- Table 22: Global APAC Road Freight Industry Revenue million Forecast, by Truckload Specification 2020 & 2033
- Table 23: Global APAC Road Freight Industry Revenue million Forecast, by Containerization 2020 & 2033
- Table 24: Global APAC Road Freight Industry Revenue million Forecast, by Distance 2020 & 2033
- Table 25: Global APAC Road Freight Industry Revenue million Forecast, by Goods Configuration 2020 & 2033
- Table 26: Global APAC Road Freight Industry Revenue million Forecast, by Temperature Control 2020 & 2033
- Table 27: Global APAC Road Freight Industry Revenue million Forecast, by Country 2020 & 2033
- Table 28: Brazil APAC Road Freight Industry Revenue (million) Forecast, by Application 2020 & 2033
- Table 29: Argentina APAC Road Freight Industry Revenue (million) Forecast, by Application 2020 & 2033
- Table 30: Rest of South America APAC Road Freight Industry Revenue (million) Forecast, by Application 2020 & 2033
- Table 31: Global APAC Road Freight Industry Revenue million Forecast, by End User Industry 2020 & 2033
- Table 32: Global APAC Road Freight Industry Revenue million Forecast, by Destination 2020 & 2033
- Table 33: Global APAC Road Freight Industry Revenue million Forecast, by Truckload Specification 2020 & 2033
- Table 34: Global APAC Road Freight Industry Revenue million Forecast, by Containerization 2020 & 2033
- Table 35: Global APAC Road Freight Industry Revenue million Forecast, by Distance 2020 & 2033
- Table 36: Global APAC Road Freight Industry Revenue million Forecast, by Goods Configuration 2020 & 2033
- Table 37: Global APAC Road Freight Industry Revenue million Forecast, by Temperature Control 2020 & 2033
- Table 38: Global APAC Road Freight Industry Revenue million Forecast, by Country 2020 & 2033
- Table 39: United Kingdom APAC Road Freight Industry Revenue (million) Forecast, by Application 2020 & 2033
- Table 40: Germany APAC Road Freight Industry Revenue (million) Forecast, by Application 2020 & 2033
- Table 41: France APAC Road Freight Industry Revenue (million) Forecast, by Application 2020 & 2033
- Table 42: Italy APAC Road Freight Industry Revenue (million) Forecast, by Application 2020 & 2033
- Table 43: Spain APAC Road Freight Industry Revenue (million) Forecast, by Application 2020 & 2033
- Table 44: Russia APAC Road Freight Industry Revenue (million) Forecast, by Application 2020 & 2033
- Table 45: Benelux APAC Road Freight Industry Revenue (million) Forecast, by Application 2020 & 2033
- Table 46: Nordics APAC Road Freight Industry Revenue (million) Forecast, by Application 2020 & 2033
- Table 47: Rest of Europe APAC Road Freight Industry Revenue (million) Forecast, by Application 2020 & 2033
- Table 48: Global APAC Road Freight Industry Revenue million Forecast, by End User Industry 2020 & 2033
- Table 49: Global APAC Road Freight Industry Revenue million Forecast, by Destination 2020 & 2033
- Table 50: Global APAC Road Freight Industry Revenue million Forecast, by Truckload Specification 2020 & 2033
- Table 51: Global APAC Road Freight Industry Revenue million Forecast, by Containerization 2020 & 2033
- Table 52: Global APAC Road Freight Industry Revenue million Forecast, by Distance 2020 & 2033
- Table 53: Global APAC Road Freight Industry Revenue million Forecast, by Goods Configuration 2020 & 2033
- Table 54: Global APAC Road Freight Industry Revenue million Forecast, by Temperature Control 2020 & 2033
- Table 55: Global APAC Road Freight Industry Revenue million Forecast, by Country 2020 & 2033
- Table 56: Turkey APAC Road Freight Industry Revenue (million) Forecast, by Application 2020 & 2033
- Table 57: Israel APAC Road Freight Industry Revenue (million) Forecast, by Application 2020 & 2033
- Table 58: GCC APAC Road Freight Industry Revenue (million) Forecast, by Application 2020 & 2033
- Table 59: North Africa APAC Road Freight Industry Revenue (million) Forecast, by Application 2020 & 2033
- Table 60: South Africa APAC Road Freight Industry Revenue (million) Forecast, by Application 2020 & 2033
- Table 61: Rest of Middle East & Africa APAC Road Freight Industry Revenue (million) Forecast, by Application 2020 & 2033
- Table 62: Global APAC Road Freight Industry Revenue million Forecast, by End User Industry 2020 & 2033
- Table 63: Global APAC Road Freight Industry Revenue million Forecast, by Destination 2020 & 2033
- Table 64: Global APAC Road Freight Industry Revenue million Forecast, by Truckload Specification 2020 & 2033
- Table 65: Global APAC Road Freight Industry Revenue million Forecast, by Containerization 2020 & 2033
- Table 66: Global APAC Road Freight Industry Revenue million Forecast, by Distance 2020 & 2033
- Table 67: Global APAC Road Freight Industry Revenue million Forecast, by Goods Configuration 2020 & 2033
- Table 68: Global APAC Road Freight Industry Revenue million Forecast, by Temperature Control 2020 & 2033
- Table 69: Global APAC Road Freight Industry Revenue million Forecast, by Country 2020 & 2033
- Table 70: China APAC Road Freight Industry Revenue (million) Forecast, by Application 2020 & 2033
- Table 71: India APAC Road Freight Industry Revenue (million) Forecast, by Application 2020 & 2033
- Table 72: Japan APAC Road Freight Industry Revenue (million) Forecast, by Application 2020 & 2033
- Table 73: South Korea APAC Road Freight Industry Revenue (million) Forecast, by Application 2020 & 2033
- Table 74: ASEAN APAC Road Freight Industry Revenue (million) Forecast, by Application 2020 & 2033
- Table 75: Oceania APAC Road Freight Industry Revenue (million) Forecast, by Application 2020 & 2033
- Table 76: Rest of Asia Pacific APAC Road Freight Industry Revenue (million) Forecast, by Application 2020 & 2033
Frequently Asked Questions
1. What is the projected Compound Annual Growth Rate (CAGR) of the APAC Road Freight Industry?
The projected CAGR is approximately 5.3%.
2. Which companies are prominent players in the APAC Road Freight Industry?
Key companies in the market include A P Moller - Maersk, Nippon Express Holdings, DHL Group, Rhenus Grou, Kintetsu Group Holdings Co Ltd, C H Robinson, Expeditors International of Washington Inc, CMA CGM Group.
3. What are the main segments of the APAC Road Freight Industry?
The market segments include End User Industry, Destination, Truckload Specification, Containerization, Distance, Goods Configuration, Temperature Control.
4. Can you provide details about the market size?
The market size is estimated to be USD 68827.8 million as of 2022.
5. What are some drivers contributing to market growth?
Growing trade relations; Increased demand for perishable goods.
6. What are the notable trends driving market growth?
OTHER KEY INDUSTRY TRENDS COVERED IN THE REPORT.
7. Are there any restraints impacting market growth?
Cargo theft; High cost of maintainig.
8. Can you provide examples of recent developments in the market?
January 2024: DHL Express has commenced services for the final Boeing 777 freighter deployed at the South Asia Hub in Singapore. With a payload capability of 102 tons, the aircraft joins the four other Boeing 777 freighters already deployed in Singapore to boost inter-continental connectivity between the Asia Pacific and the Americas. Sporting a dual DHL-Singapore Airlines (SIA) livery, these five freighters provide a total of 1,224 tons of payload capacity to meet growing customer demand for international express shipping services.November 2023: DHL Express has launched its state-of-the-art, expanded Central Asia Hub (CAH) in Hong Kong, amid fast-growing global trade in recent years. The total investment into the Central Asia Hub is EUR 562 million, making it the largest infrastructural investment by DHL Express in Asia Pacific. The Hub is one of three DHL Express global hubs connecting Asia Pacific with the rest of the world and also supports intra-Asia trade.October 2023: Truck and industrial equipment maker Volvo, auto maker Renault, and shipping giant CMA CGM unveiled a joint venture that would create a company aimed at developing a new series of electric vans. The partnership would provide electric urban transportation for companies in the logistics and transportation sector seeking to decarbonize their fleets.
9. What pricing options are available for accessing the report?
Pricing options include single-user, multi-user, and enterprise licenses priced at USD 3800, USD 4500, and USD 5800 respectively.
10. Is the market size provided in terms of value or volume?
The market size is provided in terms of value, measured in million.
11. Are there any specific market keywords associated with the report?
Yes, the market keyword associated with the report is "APAC Road Freight Industry," which aids in identifying and referencing the specific market segment covered.
12. How do I determine which pricing option suits my needs best?
The pricing options vary based on user requirements and access needs. Individual users may opt for single-user licenses, while businesses requiring broader access may choose multi-user or enterprise licenses for cost-effective access to the report.
13. Are there any additional resources or data provided in the APAC Road Freight Industry report?
While the report offers comprehensive insights, it's advisable to review the specific contents or supplementary materials provided to ascertain if additional resources or data are available.
14. How can I stay updated on further developments or reports in the APAC Road Freight Industry?
To stay informed about further developments, trends, and reports in the APAC Road Freight Industry, consider subscribing to industry newsletters, following relevant companies and organizations, or regularly checking reputable industry news sources and publications.
Methodology
Step 1 - Identification of Relevant Samples Size from Population Database


Step 2 - Approaches for Defining Global Market Size (Value, Volume* & Price*)

Note*: In applicable scenarios
Step 3 - Data Sources
Primary Research
- Web Analytics
- Survey Reports
- Research Institute
- Latest Research Reports
- Opinion Leaders
Secondary Research
- Annual Reports
- White Paper
- Latest Press Release
- Industry Association
- Paid Database
- Investor Presentations

Step 4 - Data Triangulation
Involves using different sources of information in order to increase the validity of a study
These sources are likely to be stakeholders in a program - participants, other researchers, program staff, other community members, and so on.
Then we put all data in single framework & apply various statistical tools to find out the dynamic on the market.
During the analysis stage, feedback from the stakeholder groups would be compared to determine areas of agreement as well as areas of divergence