

Key Insights
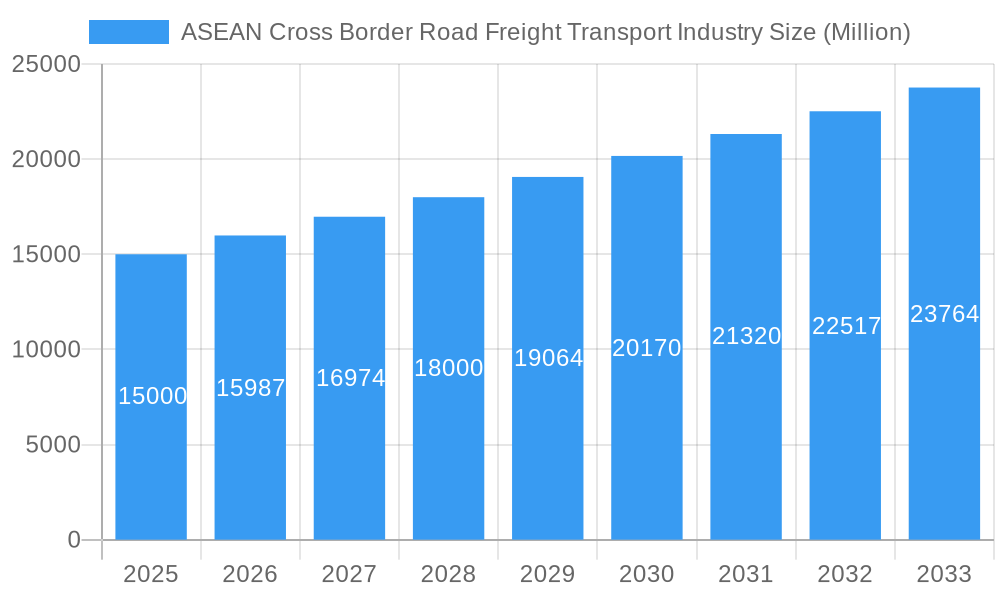
The ASEAN cross-border road freight transport market, valued at approximately $282.7 billion in 2025, is projected for robust expansion. Exhibiting a Compound Annual Growth Rate (CAGR) of 6% from 2025 to 2033, this growth is propelled by several key drivers. The burgeoning e-commerce sector within ASEAN significantly boosts demand for efficient and cost-effective cross-border logistics. Furthermore, increasing intra-ASEAN trade, facilitated by regional economic integration initiatives like the ASEAN Economic Community (AEC), enhances the movement of goods. Improved infrastructure, including enhanced road networks and border crossing facilities, streamlines logistics and reduces transit times, further accelerating market growth. While regulatory variations across ASEAN nations and potential infrastructure bottlenecks present challenges, the overall market outlook remains positive. Dominant players such as DB Schenker and DHL underscore the competitive landscape, highlighting a strong demand for reliable service providers. Accelerated growth is anticipated in rapidly industrializing economies like Vietnam and Indonesia. The segment breakdown reveals substantial contributions from manufacturing, construction, and the growing agricultural sector.
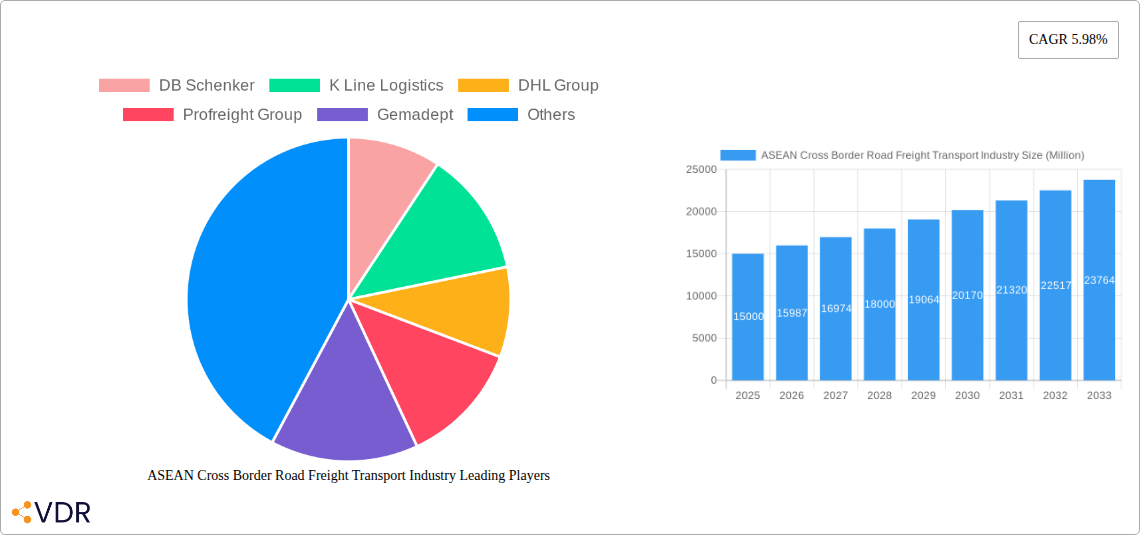
ASEAN Cross Border Road Freight Transport Industry Market Size (In Billion)
Continued expansion in ASEAN's manufacturing and retail sectors will persistently drive demand for cross-border road freight transport. The increasing adoption of just-in-time inventory management necessitates reliable and timely deliveries, fueling the need for sophisticated logistics solutions and enhancing road freight competitiveness. The growth of regional logistics hubs will further catalyze market expansion. While the "Rest of ASEAN" segment currently holds a significant share, individual country market shares are expected to evolve with ongoing economic development. Companies are prioritizing technological solutions and strategic partnerships to secure a competitive edge and meet escalating demands for efficient, transparent logistics. Investment in technologies like real-time tracking and optimized route planning will be crucial for success in this dynamic market.
ASEAN Cross Border Road Freight Transport Industry Company Market Share
ASEAN Cross Border Road Freight Transport Industry Market Report: 2019-2033
This comprehensive report provides an in-depth analysis of the ASEAN cross-border road freight transport industry, covering market dynamics, growth trends, dominant players, and future opportunities. With a focus on the parent market (ASEAN logistics) and child markets (specific end-user industries and countries), this report is an essential resource for industry professionals, investors, and policymakers. The study period spans 2019-2033, with 2025 as the base and estimated year.
ASEAN Cross Border Road Freight Transport Industry Market Dynamics & Structure
The ASEAN cross-border road freight transport market is characterized by moderate concentration, with several large players and a significant number of smaller regional operators. The market size in 2025 is estimated at xx Million units. Technological innovation, driven by digitalization and automation, is transforming the sector, though implementation faces barriers such as infrastructure limitations and digital literacy gaps. Regulatory frameworks vary across ASEAN countries, creating complexities for cross-border operations. Competitive product substitutes, such as rail and sea freight, exert pressure, influencing market share. End-user demographics, particularly the rise of e-commerce, are significantly impacting demand. M&A activity remains moderate, with approximately xx deals recorded between 2019-2024, indicating a consolidating market.
- Market Concentration: Moderately fragmented, with top 5 players holding approximately xx% market share in 2025.
- Technological Innovation: Focus on telematics, route optimization software, and automated trucking is increasing efficiency, although adoption rates are uneven.
- Regulatory Framework: Harmonization of regulations across ASEAN countries is crucial for seamless cross-border operations.
- Competitive Substitutes: Rail and sea freight offer alternatives for certain goods and distances, impacting road freight market share.
- End-User Demographics: Growth in e-commerce is driving increased demand for last-mile delivery solutions.
- M&A Trends: Consolidation is expected to continue, driven by economies of scale and enhanced logistics networks.
ASEAN Cross Border Road Freight Transport Industry Growth Trends & Insights
The ASEAN cross-border road freight transport market experienced significant growth during the historical period (2019-2024). The market size grew from xx Million units in 2019 to xx Million units in 2024, representing a CAGR of xx%. This growth is primarily driven by expanding intra-ASEAN trade, increasing industrial production, and the rise of e-commerce. Technological advancements, such as GPS tracking and improved route optimization, are further boosting efficiency and driving market growth. However, challenges remain, including infrastructure limitations and inconsistent regulatory frameworks across the region. The forecast period (2025-2033) projects sustained growth, though at a potentially slower pace due to factors such as geopolitical uncertainty and global economic conditions. Market penetration in key segments continues to rise, although reaching saturation in certain high-density corridors is expected.
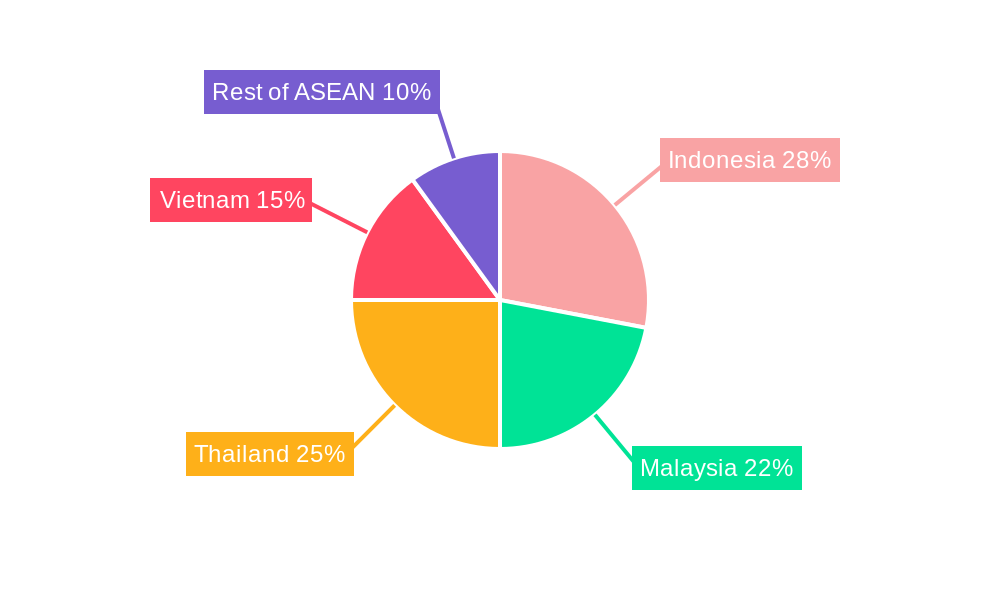
Dominant Regions, Countries, or Segments in ASEAN Cross Border Road Freight Transport Industry
Thailand, Vietnam, and Indonesia are currently leading the ASEAN cross-border road freight transport market. The manufacturing, wholesale and retail trade, and construction sectors are the major end-user industries, driving significant demand. Thailand's robust manufacturing base and developed infrastructure contribute to its dominance. Vietnam benefits from its rapidly expanding manufacturing sector and strategic location. Indonesia's vast archipelago necessitates strong road freight connectivity.
- Thailand: Strong manufacturing base, efficient infrastructure, and supportive government policies. Market share in 2025: xx%.
- Vietnam: Rapid manufacturing expansion, increasing foreign investment, and a growing e-commerce sector. Market share in 2025: xx%.
- Indonesia: Large population, significant domestic consumption, and expanding manufacturing capabilities. Market share in 2025: xx%.
- Malaysia: Strategic location, established logistics networks, and automotive industry growth. Market share in 2025: xx%.
- Manufacturing Sector: This segment accounts for the largest share, driven by the high volume of goods transported within and across borders. Market share in 2025: xx%
- Wholesale and Retail Trade: The surge in e-commerce is fueling growth in this segment. Market share in 2025: xx%
ASEAN Cross Border Road Freight Transport Industry Product Landscape
The ASEAN cross-border road freight transport industry is characterized by a diverse range of services, from basic trucking to specialized logistics solutions. Innovations include the use of telematics for real-time tracking and route optimization, temperature-controlled transportation for sensitive goods, and the increasing integration of technology for enhanced supply chain visibility. Unique selling propositions focus on efficiency, reliability, and transparency. Advances in electric vehicle technology are gradually being incorporated, though widespread adoption is still limited by infrastructure constraints.
Key Drivers, Barriers & Challenges in ASEAN Cross Border Road Freight Transport Industry
Key Drivers: Growing intra-ASEAN trade, increasing industrialization, development of e-commerce, technological advancements, and infrastructure improvements.
Challenges: Inadequate infrastructure in certain areas, inconsistent regulatory frameworks across countries, high fuel prices, driver shortages, and competition from other modes of transport. Specifically, border crossing delays contribute to approximately xx% of total transport time, adding significant cost and impacting service quality.
Emerging Opportunities in ASEAN Cross Border Road Freight Transport Industry
The emergence of last-mile delivery solutions tailored to e-commerce growth presents a major opportunity. The adoption of innovative technologies, such as blockchain for supply chain transparency and AI-powered route optimization, offers significant potential for efficiency gains. Expanding into less-developed areas with untapped market potential also presents opportunities for expansion and growth.
Growth Accelerators in the ASEAN Cross Border Road Freight Transport Industry Industry
Investments in infrastructure development, particularly road networks and border crossing facilities, will be crucial for growth. Technological advancements, including the adoption of electric and autonomous vehicles, will improve efficiency and sustainability. Strategic partnerships between logistics providers and technology companies can drive innovation and efficiency gains.
Key Players Shaping the ASEAN Cross Border Road Freight Transport Industry Market
- DB Schenker
- K Line Logistics
- DHL Group
- Profreight Group
- Gemadept
- MOL Logistics
- Overland Total Logistic
- Konoike Group
- Yatfai Group
- Tiong Nam Logistics
- Kerry Logistics Network Limited
Notable Milestones in ASEAN Cross Border Road Freight Transport Industry Sector
- June 2023: DHL Express deploys 24 electric vans in Jakarta and Bandung, furthering its commitment to sustainable logistics.
- June 2023: Chery Malaysia partners with Tiong Nam Logistics for spare parts warehousing and transportation, expanding Tiong Nam's market reach.
- May 2023: Kerry Express partners with All Speedy to extend its delivery services through 7-Eleven outlets, enhancing last-mile delivery accessibility.
In-Depth ASEAN Cross Border Road Freight Transport Industry Market Outlook
The ASEAN cross-border road freight transport market is poised for continued growth, driven by strong economic expansion, rising e-commerce activity, and technological advancements. Strategic partnerships, investments in infrastructure, and the adoption of sustainable practices will be key to unlocking the market's full potential. Addressing challenges such as infrastructure gaps and regulatory inconsistencies will be essential for sustained growth and competitiveness in the long term.
ASEAN Cross Border Road Freight Transport Industry Segmentation
-
1. End User Industry
- 1.1. Agriculture, Fishing, and Forestry
- 1.2. Construction
- 1.3. Manufacturing
- 1.4. Oil and Gas, Mining and Quarrying
- 1.5. Wholesale and Retail Trade
- 1.6. Others
ASEAN Cross Border Road Freight Transport Industry Segmentation By Geography
-
1. North America
- 1.1. United States
- 1.2. Canada
- 1.3. Mexico
-
2. South America
- 2.1. Brazil
- 2.2. Argentina
- 2.3. Rest of South America
-
3. Europe
- 3.1. United Kingdom
- 3.2. Germany
- 3.3. France
- 3.4. Italy
- 3.5. Spain
- 3.6. Russia
- 3.7. Benelux
- 3.8. Nordics
- 3.9. Rest of Europe
-
4. Middle East & Africa
- 4.1. Turkey
- 4.2. Israel
- 4.3. GCC
- 4.4. North Africa
- 4.5. South Africa
- 4.6. Rest of Middle East & Africa
-
5. Asia Pacific
- 5.1. China
- 5.2. India
- 5.3. Japan
- 5.4. South Korea
- 5.5. ASEAN
- 5.6. Oceania
- 5.7. Rest of Asia Pacific
ASEAN Cross Border Road Freight Transport Industry Regional Market Share
Geographic Coverage of ASEAN Cross Border Road Freight Transport Industry
ASEAN Cross Border Road Freight Transport Industry REPORT HIGHLIGHTS
| Aspects | Details |
|---|---|
| Study Period | 2020-2034 |
| Base Year | 2025 |
| Estimated Year | 2026 |
| Forecast Period | 2026-2034 |
| Historical Period | 2020-2025 |
| Growth Rate | CAGR of 6% from 2020-2034 |
| Segmentation |
|
Table of Contents
- 1. Introduction
- 1.1. Research Scope
- 1.2. Market Segmentation
- 1.3. Research Objective
- 1.4. Definitions and Assumptions
- 2. Executive Summary
- 2.1. Market Snapshot
- 3. Market Dynamics
- 3.1. Market Drivers
- 3.2. Market Restrains
- 3.3. Market Trends
- 3.4. Market Opportunities
- 4. Market Factor Analysis
- 4.1. Porters Five Forces
- 4.1.1. Bargaining Power of Suppliers
- 4.1.2. Bargaining Power of Buyers
- 4.1.3. Threat of New Entrants
- 4.1.4. Threat of Substitutes
- 4.1.5. Competitive Rivalry
- 4.2. PESTEL analysis
- 4.3. BCG Analysis
- 4.3.1. Stars (High Growth, High Market Share)
- 4.3.2. Cash Cows (Low Growth, High Market Share)
- 4.3.3. Question Mark (High Growth, Low Market Share)
- 4.3.4. Dogs (Low Growth, Low Market Share)
- 4.4. Ansoff Matrix Analysis
- 4.5. Supply Chain Analysis
- 4.6. Regulatory Landscape
- 4.7. Current Market Potential and Opportunity Assessment (TAM–SAM–SOM Framework)
- 4.8. VDR Analyst Note
- 4.1. Porters Five Forces
- 5. Market Analysis, Insights and Forecast 2021-2033
- 5.1. Market Analysis, Insights and Forecast - by End User Industry
- 5.1.1. Agriculture, Fishing, and Forestry
- 5.1.2. Construction
- 5.1.3. Manufacturing
- 5.1.4. Oil and Gas, Mining and Quarrying
- 5.1.5. Wholesale and Retail Trade
- 5.1.6. Others
- 5.2. Market Analysis, Insights and Forecast - by Region
- 5.2.1. North America
- 5.2.2. South America
- 5.2.3. Europe
- 5.2.4. Middle East & Africa
- 5.2.5. Asia Pacific
- 5.1. Market Analysis, Insights and Forecast - by End User Industry
- 6. Global ASEAN Cross Border Road Freight Transport Industry Analysis, Insights and Forecast, 2021-2033
- 6.1. Market Analysis, Insights and Forecast - by End User Industry
- 6.1.1. Agriculture, Fishing, and Forestry
- 6.1.2. Construction
- 6.1.3. Manufacturing
- 6.1.4. Oil and Gas, Mining and Quarrying
- 6.1.5. Wholesale and Retail Trade
- 6.1.6. Others
- 6.1. Market Analysis, Insights and Forecast - by End User Industry
- 7. North America ASEAN Cross Border Road Freight Transport Industry Analysis, Insights and Forecast, 2021-2033
- 7.1. Market Analysis, Insights and Forecast - by End User Industry
- 7.1.1. Agriculture, Fishing, and Forestry
- 7.1.2. Construction
- 7.1.3. Manufacturing
- 7.1.4. Oil and Gas, Mining and Quarrying
- 7.1.5. Wholesale and Retail Trade
- 7.1.6. Others
- 7.1. Market Analysis, Insights and Forecast - by End User Industry
- 8. South America ASEAN Cross Border Road Freight Transport Industry Analysis, Insights and Forecast, 2021-2033
- 8.1. Market Analysis, Insights and Forecast - by End User Industry
- 8.1.1. Agriculture, Fishing, and Forestry
- 8.1.2. Construction
- 8.1.3. Manufacturing
- 8.1.4. Oil and Gas, Mining and Quarrying
- 8.1.5. Wholesale and Retail Trade
- 8.1.6. Others
- 8.1. Market Analysis, Insights and Forecast - by End User Industry
- 9. Europe ASEAN Cross Border Road Freight Transport Industry Analysis, Insights and Forecast, 2021-2033
- 9.1. Market Analysis, Insights and Forecast - by End User Industry
- 9.1.1. Agriculture, Fishing, and Forestry
- 9.1.2. Construction
- 9.1.3. Manufacturing
- 9.1.4. Oil and Gas, Mining and Quarrying
- 9.1.5. Wholesale and Retail Trade
- 9.1.6. Others
- 9.1. Market Analysis, Insights and Forecast - by End User Industry
- 10. Middle East & Africa ASEAN Cross Border Road Freight Transport Industry Analysis, Insights and Forecast, 2021-2033
- 10.1. Market Analysis, Insights and Forecast - by End User Industry
- 10.1.1. Agriculture, Fishing, and Forestry
- 10.1.2. Construction
- 10.1.3. Manufacturing
- 10.1.4. Oil and Gas, Mining and Quarrying
- 10.1.5. Wholesale and Retail Trade
- 10.1.6. Others
- 10.1. Market Analysis, Insights and Forecast - by End User Industry
- 11. Asia Pacific ASEAN Cross Border Road Freight Transport Industry Analysis, Insights and Forecast, 2021-2033
- 11.1. Market Analysis, Insights and Forecast - by End User Industry
- 11.1.1. Agriculture, Fishing, and Forestry
- 11.1.2. Construction
- 11.1.3. Manufacturing
- 11.1.4. Oil and Gas, Mining and Quarrying
- 11.1.5. Wholesale and Retail Trade
- 11.1.6. Others
- 11.1. Market Analysis, Insights and Forecast - by End User Industry
- 12. Competitive Analysis
- 12.1. Company Profiles
- 12.1.1 DB Schenker
- 12.1.1.1. Company Overview
- 12.1.1.2. Products
- 12.1.1.3. Company Financials
- 12.1.1.4. SWOT Analysis
- 12.1.2 K Line Logistics
- 12.1.2.1. Company Overview
- 12.1.2.2. Products
- 12.1.2.3. Company Financials
- 12.1.2.4. SWOT Analysis
- 12.1.3 DHL Group
- 12.1.3.1. Company Overview
- 12.1.3.2. Products
- 12.1.3.3. Company Financials
- 12.1.3.4. SWOT Analysis
- 12.1.4 Profreight Group
- 12.1.4.1. Company Overview
- 12.1.4.2. Products
- 12.1.4.3. Company Financials
- 12.1.4.4. SWOT Analysis
- 12.1.5 Gemadept
- 12.1.5.1. Company Overview
- 12.1.5.2. Products
- 12.1.5.3. Company Financials
- 12.1.5.4. SWOT Analysis
- 12.1.6 MOL Logistics
- 12.1.6.1. Company Overview
- 12.1.6.2. Products
- 12.1.6.3. Company Financials
- 12.1.6.4. SWOT Analysis
- 12.1.7 Overland Total Logistic
- 12.1.7.1. Company Overview
- 12.1.7.2. Products
- 12.1.7.3. Company Financials
- 12.1.7.4. SWOT Analysis
- 12.1.8 Konoike Group
- 12.1.8.1. Company Overview
- 12.1.8.2. Products
- 12.1.8.3. Company Financials
- 12.1.8.4. SWOT Analysis
- 12.1.9 Yatfai Grou
- 12.1.9.1. Company Overview
- 12.1.9.2. Products
- 12.1.9.3. Company Financials
- 12.1.9.4. SWOT Analysis
- 12.1.10 Tiong Nam Logistics
- 12.1.10.1. Company Overview
- 12.1.10.2. Products
- 12.1.10.3. Company Financials
- 12.1.10.4. SWOT Analysis
- 12.1.11 Kerry Logistics Network Limited
- 12.1.11.1. Company Overview
- 12.1.11.2. Products
- 12.1.11.3. Company Financials
- 12.1.11.4. SWOT Analysis
- 12.1.1 DB Schenker
- 12.2. Market Entropy
- 12.2.1 Company's Key Areas Served
- 12.2.2 Recent Developments
- 12.3. Company Market Share Analysis 2025
- 12.3.1 Top 5 Companies Market Share Analysis
- 12.3.2 Top 3 Companies Market Share Analysis
- 12.4. List of Potential Customers
- 13. Research Methodology
List of Figures
- Figure 1: Global ASEAN Cross Border Road Freight Transport Industry Revenue Breakdown (billion, %) by Region 2025 & 2033
- Figure 2: North America ASEAN Cross Border Road Freight Transport Industry Revenue (billion), by End User Industry 2025 & 2033
- Figure 3: North America ASEAN Cross Border Road Freight Transport Industry Revenue Share (%), by End User Industry 2025 & 2033
- Figure 4: North America ASEAN Cross Border Road Freight Transport Industry Revenue (billion), by Country 2025 & 2033
- Figure 5: North America ASEAN Cross Border Road Freight Transport Industry Revenue Share (%), by Country 2025 & 2033
- Figure 6: South America ASEAN Cross Border Road Freight Transport Industry Revenue (billion), by End User Industry 2025 & 2033
- Figure 7: South America ASEAN Cross Border Road Freight Transport Industry Revenue Share (%), by End User Industry 2025 & 2033
- Figure 8: South America ASEAN Cross Border Road Freight Transport Industry Revenue (billion), by Country 2025 & 2033
- Figure 9: South America ASEAN Cross Border Road Freight Transport Industry Revenue Share (%), by Country 2025 & 2033
- Figure 10: Europe ASEAN Cross Border Road Freight Transport Industry Revenue (billion), by End User Industry 2025 & 2033
- Figure 11: Europe ASEAN Cross Border Road Freight Transport Industry Revenue Share (%), by End User Industry 2025 & 2033
- Figure 12: Europe ASEAN Cross Border Road Freight Transport Industry Revenue (billion), by Country 2025 & 2033
- Figure 13: Europe ASEAN Cross Border Road Freight Transport Industry Revenue Share (%), by Country 2025 & 2033
- Figure 14: Middle East & Africa ASEAN Cross Border Road Freight Transport Industry Revenue (billion), by End User Industry 2025 & 2033
- Figure 15: Middle East & Africa ASEAN Cross Border Road Freight Transport Industry Revenue Share (%), by End User Industry 2025 & 2033
- Figure 16: Middle East & Africa ASEAN Cross Border Road Freight Transport Industry Revenue (billion), by Country 2025 & 2033
- Figure 17: Middle East & Africa ASEAN Cross Border Road Freight Transport Industry Revenue Share (%), by Country 2025 & 2033
- Figure 18: Asia Pacific ASEAN Cross Border Road Freight Transport Industry Revenue (billion), by End User Industry 2025 & 2033
- Figure 19: Asia Pacific ASEAN Cross Border Road Freight Transport Industry Revenue Share (%), by End User Industry 2025 & 2033
- Figure 20: Asia Pacific ASEAN Cross Border Road Freight Transport Industry Revenue (billion), by Country 2025 & 2033
- Figure 21: Asia Pacific ASEAN Cross Border Road Freight Transport Industry Revenue Share (%), by Country 2025 & 2033
List of Tables
- Table 1: Global ASEAN Cross Border Road Freight Transport Industry Revenue billion Forecast, by End User Industry 2020 & 2033
- Table 2: Global ASEAN Cross Border Road Freight Transport Industry Revenue billion Forecast, by Region 2020 & 2033
- Table 3: Global ASEAN Cross Border Road Freight Transport Industry Revenue billion Forecast, by End User Industry 2020 & 2033
- Table 4: Global ASEAN Cross Border Road Freight Transport Industry Revenue billion Forecast, by Country 2020 & 2033
- Table 5: United States ASEAN Cross Border Road Freight Transport Industry Revenue (billion) Forecast, by Application 2020 & 2033
- Table 6: Canada ASEAN Cross Border Road Freight Transport Industry Revenue (billion) Forecast, by Application 2020 & 2033
- Table 7: Mexico ASEAN Cross Border Road Freight Transport Industry Revenue (billion) Forecast, by Application 2020 & 2033
- Table 8: Global ASEAN Cross Border Road Freight Transport Industry Revenue billion Forecast, by End User Industry 2020 & 2033
- Table 9: Global ASEAN Cross Border Road Freight Transport Industry Revenue billion Forecast, by Country 2020 & 2033
- Table 10: Brazil ASEAN Cross Border Road Freight Transport Industry Revenue (billion) Forecast, by Application 2020 & 2033
- Table 11: Argentina ASEAN Cross Border Road Freight Transport Industry Revenue (billion) Forecast, by Application 2020 & 2033
- Table 12: Rest of South America ASEAN Cross Border Road Freight Transport Industry Revenue (billion) Forecast, by Application 2020 & 2033
- Table 13: Global ASEAN Cross Border Road Freight Transport Industry Revenue billion Forecast, by End User Industry 2020 & 2033
- Table 14: Global ASEAN Cross Border Road Freight Transport Industry Revenue billion Forecast, by Country 2020 & 2033
- Table 15: United Kingdom ASEAN Cross Border Road Freight Transport Industry Revenue (billion) Forecast, by Application 2020 & 2033
- Table 16: Germany ASEAN Cross Border Road Freight Transport Industry Revenue (billion) Forecast, by Application 2020 & 2033
- Table 17: France ASEAN Cross Border Road Freight Transport Industry Revenue (billion) Forecast, by Application 2020 & 2033
- Table 18: Italy ASEAN Cross Border Road Freight Transport Industry Revenue (billion) Forecast, by Application 2020 & 2033
- Table 19: Spain ASEAN Cross Border Road Freight Transport Industry Revenue (billion) Forecast, by Application 2020 & 2033
- Table 20: Russia ASEAN Cross Border Road Freight Transport Industry Revenue (billion) Forecast, by Application 2020 & 2033
- Table 21: Benelux ASEAN Cross Border Road Freight Transport Industry Revenue (billion) Forecast, by Application 2020 & 2033
- Table 22: Nordics ASEAN Cross Border Road Freight Transport Industry Revenue (billion) Forecast, by Application 2020 & 2033
- Table 23: Rest of Europe ASEAN Cross Border Road Freight Transport Industry Revenue (billion) Forecast, by Application 2020 & 2033
- Table 24: Global ASEAN Cross Border Road Freight Transport Industry Revenue billion Forecast, by End User Industry 2020 & 2033
- Table 25: Global ASEAN Cross Border Road Freight Transport Industry Revenue billion Forecast, by Country 2020 & 2033
- Table 26: Turkey ASEAN Cross Border Road Freight Transport Industry Revenue (billion) Forecast, by Application 2020 & 2033
- Table 27: Israel ASEAN Cross Border Road Freight Transport Industry Revenue (billion) Forecast, by Application 2020 & 2033
- Table 28: GCC ASEAN Cross Border Road Freight Transport Industry Revenue (billion) Forecast, by Application 2020 & 2033
- Table 29: North Africa ASEAN Cross Border Road Freight Transport Industry Revenue (billion) Forecast, by Application 2020 & 2033
- Table 30: South Africa ASEAN Cross Border Road Freight Transport Industry Revenue (billion) Forecast, by Application 2020 & 2033
- Table 31: Rest of Middle East & Africa ASEAN Cross Border Road Freight Transport Industry Revenue (billion) Forecast, by Application 2020 & 2033
- Table 32: Global ASEAN Cross Border Road Freight Transport Industry Revenue billion Forecast, by End User Industry 2020 & 2033
- Table 33: Global ASEAN Cross Border Road Freight Transport Industry Revenue billion Forecast, by Country 2020 & 2033
- Table 34: China ASEAN Cross Border Road Freight Transport Industry Revenue (billion) Forecast, by Application 2020 & 2033
- Table 35: India ASEAN Cross Border Road Freight Transport Industry Revenue (billion) Forecast, by Application 2020 & 2033
- Table 36: Japan ASEAN Cross Border Road Freight Transport Industry Revenue (billion) Forecast, by Application 2020 & 2033
- Table 37: South Korea ASEAN Cross Border Road Freight Transport Industry Revenue (billion) Forecast, by Application 2020 & 2033
- Table 38: ASEAN ASEAN Cross Border Road Freight Transport Industry Revenue (billion) Forecast, by Application 2020 & 2033
- Table 39: Oceania ASEAN Cross Border Road Freight Transport Industry Revenue (billion) Forecast, by Application 2020 & 2033
- Table 40: Rest of Asia Pacific ASEAN Cross Border Road Freight Transport Industry Revenue (billion) Forecast, by Application 2020 & 2033
Frequently Asked Questions
1. What is the projected Compound Annual Growth Rate (CAGR) of the ASEAN Cross Border Road Freight Transport Industry?
The projected CAGR is approximately 6%.
2. Which companies are prominent players in the ASEAN Cross Border Road Freight Transport Industry?
Key companies in the market include DB Schenker, K Line Logistics, DHL Group, Profreight Group, Gemadept, MOL Logistics, Overland Total Logistic, Konoike Group, Yatfai Grou, Tiong Nam Logistics, Kerry Logistics Network Limited.
3. What are the main segments of the ASEAN Cross Border Road Freight Transport Industry?
The market segments include End User Industry.
4. Can you provide details about the market size?
The market size is estimated to be USD 282.7 billion as of 2022.
5. What are some drivers contributing to market growth?
Growing trade relations; Increased demand for perishable goods.
6. What are the notable trends driving market growth?
OTHER KEY INDUSTRY TRENDS COVERED IN THE REPORT.
7. Are there any restraints impacting market growth?
Cargo theft; High cost of maintainig.
8. Can you provide examples of recent developments in the market?
June 2023: DHL Express has geared up to electrify its last-mile delivery fleet by deploying 24 electric vans in Jakarta and Bandung. The new electric vehicles will join the existing fleet which includes four electric vans and six electric bikes serving areas in Jakarta and Surabaya.June 2023: Chery Malaysia signed a logistic services agreement with Tiong Nam Logistics Holdings Berhad, which is responsible for spare parts warehousing and transportation logistics services. Tiong Nam Logistics has obtained the rights to handle Chery’s spare parts warehousing and transportation in Malaysia, including heavy-duty vehicle models such as TIGGO 8 PRO and OMODA5.May 2023: Kerry Express (KEX),has announced a partnership with All Speedy Co, a subsidiary of CP All, to extend its services to 7-Eleven branches across the country. This cooperation between Kerry Express and All Speedy is aimed at increasing the availability of their express parcel delivery service by leveraging the extensive nationwide network of 7-Eleven outlets.
9. What pricing options are available for accessing the report?
Pricing options include single-user, multi-user, and enterprise licenses priced at USD 3800, USD 4500, and USD 5800 respectively.
10. Is the market size provided in terms of value or volume?
The market size is provided in terms of value, measured in billion.
11. Are there any specific market keywords associated with the report?
Yes, the market keyword associated with the report is "ASEAN Cross Border Road Freight Transport Industry," which aids in identifying and referencing the specific market segment covered.
12. How do I determine which pricing option suits my needs best?
The pricing options vary based on user requirements and access needs. Individual users may opt for single-user licenses, while businesses requiring broader access may choose multi-user or enterprise licenses for cost-effective access to the report.
13. Are there any additional resources or data provided in the ASEAN Cross Border Road Freight Transport Industry report?
While the report offers comprehensive insights, it's advisable to review the specific contents or supplementary materials provided to ascertain if additional resources or data are available.
14. How can I stay updated on further developments or reports in the ASEAN Cross Border Road Freight Transport Industry?
To stay informed about further developments, trends, and reports in the ASEAN Cross Border Road Freight Transport Industry, consider subscribing to industry newsletters, following relevant companies and organizations, or regularly checking reputable industry news sources and publications.
Methodology
Step 1 - Identification of Relevant Samples Size from Population Database


Step 2 - Approaches for Defining Global Market Size (Value, Volume* & Price*)

Note*: In applicable scenarios
Step 3 - Data Sources
Primary Research
- Web Analytics
- Survey Reports
- Research Institute
- Latest Research Reports
- Opinion Leaders
Secondary Research
- Annual Reports
- White Paper
- Latest Press Release
- Industry Association
- Paid Database
- Investor Presentations

Step 4 - Data Triangulation
Involves using different sources of information in order to increase the validity of a study
These sources are likely to be stakeholders in a program - participants, other researchers, program staff, other community members, and so on.
Then we put all data in single framework & apply various statistical tools to find out the dynamic on the market.
During the analysis stage, feedback from the stakeholder groups would be compared to determine areas of agreement as well as areas of divergence