
Key Insights
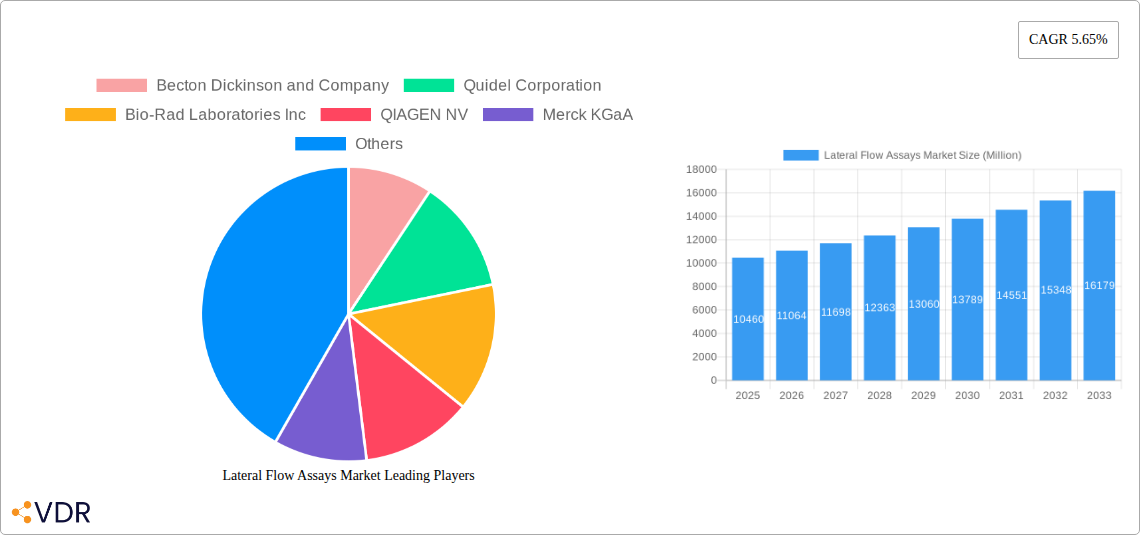
The Lateral Flow Assay (LFA) market, valued at $10.46 billion in 2025, is projected to experience robust growth, driven by increasing demand for rapid diagnostic tests, particularly in point-of-care settings. A Compound Annual Growth Rate (CAGR) of 5.65% from 2025 to 2033 indicates a significant expansion, fueled by several key factors. The rising prevalence of infectious diseases globally necessitates quick and reliable diagnostic tools, making LFAs a crucial component of healthcare systems. Furthermore, advancements in LFA technology, such as the development of more sensitive and specific assays, and the integration of digital readers for improved accuracy and ease of use, are contributing to market growth. The increasing adoption of LFAs in various applications, including clinical testing (e.g., drug abuse testing, infectious disease diagnostics), veterinary diagnostics, and environmental monitoring, further bolsters market expansion. The market segmentation reveals a strong demand for both kits and reagents alongside sophisticated readers, catering to diverse testing needs and budgetary constraints. The dominance of key players like Becton Dickinson, Quidel, and Bio-Rad reflects the established nature of the market and the high barriers to entry for new competitors. However, the competitive landscape remains dynamic, with ongoing innovations and strategic partnerships shaping future market dynamics.
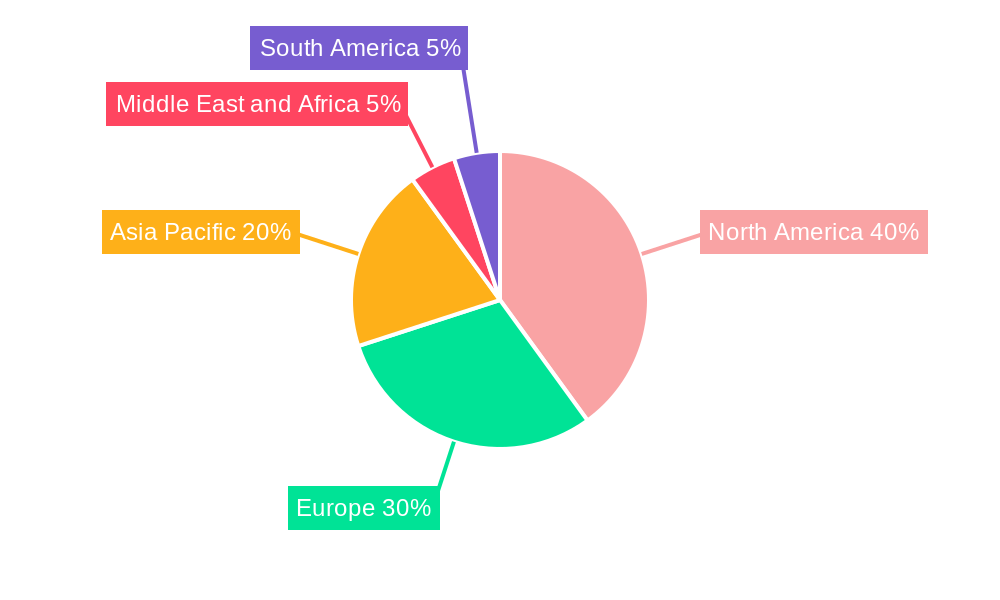
The geographical distribution of the LFA market showcases significant regional variations, with North America currently holding a substantial share. This is driven by factors such as advanced healthcare infrastructure, high adoption rates of rapid diagnostic tests, and a significant presence of major LFA manufacturers. However, regions like Asia Pacific are experiencing rapid growth, fueled by increasing healthcare spending, rising prevalence of infectious diseases, and expanding diagnostic testing infrastructure. Regulatory approvals and government initiatives promoting early disease detection play a significant role in driving market growth across different regions. Future market growth will depend on sustained technological advancements, the successful integration of LFAs into existing healthcare workflows, and the ongoing evolution of regulatory frameworks governing diagnostic testing. The expansion into new applications and improved access to LFAs in underserved regions will be crucial in unlocking the full potential of this rapidly expanding market.
Lateral Flow Assays Market: A Comprehensive Report (2019-2033)
This comprehensive report provides an in-depth analysis of the Lateral Flow Assays market, encompassing its dynamics, growth trends, dominant segments, and key players. With a focus on both the parent Diagnostics market and the child Lateral Flow Assays segment, this report offers invaluable insights for industry professionals, investors, and strategic decision-makers. The study period covers 2019-2033, with 2025 as the base and estimated year. The forecast period spans 2025-2033, and the historical period encompasses 2019-2024. The market size is presented in million units.
Lateral Flow Assays Market Dynamics & Structure
The Lateral Flow Assays market is characterized by a moderately concentrated landscape with key players like Abbott Laboratories, Thermo Fisher Scientific, and Danaher Corporation holding significant market share (xx%). Technological innovation, particularly in multiplex assays and reader technologies, is a key driver. Stringent regulatory frameworks, especially concerning diagnostic accuracy and safety, influence market growth. Competitive substitutes, such as ELISA and PCR tests, pose challenges, necessitating continuous product improvement. The market exhibits diverse end-user demographics, including home care settings, hospitals and clinics, and research institutions. M&A activity has been moderate (xx deals in the past 5 years), primarily focused on expanding product portfolios and geographical reach.
- Market Concentration: Moderately concentrated, with top 5 players holding xx% market share.
- Technological Innovation: Driven by advancements in multiplex assays and reader technologies.
- Regulatory Landscape: Stringent regulations impact market entry and product development.
- Competitive Substitutes: ELISA and PCR tests pose competitive pressure.
- End-User Demographics: Diverse, including home care, hospitals, and research facilities.
- M&A Activity: Moderate activity (xx deals in the last 5 years) focused on expansion.
Lateral Flow Assays Market Growth Trends & Insights
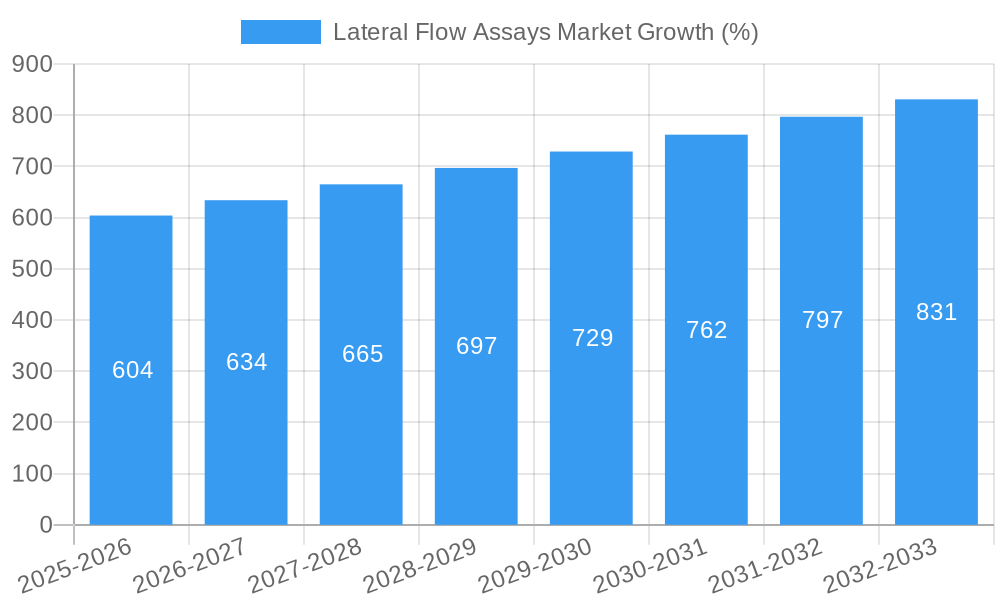
The Lateral Flow Assays market witnessed substantial growth during the historical period (2019-2024), primarily fueled by increasing demand for rapid diagnostic testing across various applications. The market size experienced a CAGR of xx% during this period, reaching xx million units in 2024. This growth trajectory is projected to continue throughout the forecast period (2025-2033), with a projected CAGR of xx%, driven by factors such as rising prevalence of infectious diseases, increasing healthcare spending, and technological advancements leading to improved diagnostic accuracy and ease of use. The market penetration rate is expected to increase from xx% in 2024 to xx% by 2033. Significant technological disruptions, such as the development of sophisticated lateral flow readers and the integration of digital technologies, are expected to shape the market landscape. Shifts in consumer behavior, including a preference for at-home testing solutions, are also driving growth.
Dominant Regions, Countries, or Segments in Lateral Flow Assays Market
North America currently dominates the Lateral Flow Assays market, driven by robust healthcare infrastructure, high adoption rates of advanced diagnostic technologies, and significant research and development investments. Europe and Asia Pacific are also key markets exhibiting strong growth potential. Within the application segment, Clinical Testing holds the largest market share, followed by Other Clinical Testings (Drug Abuse Testing being a major sub-segment), and Other Applications. The Sandwich Assay technique dominates the technique segment. In the product category, Kits and Reagents constitute the major share. Hospitals and Clinics are the primary end-users.
- Key Growth Drivers: Strong healthcare infrastructure (North America), rising prevalence of infectious diseases (globally), increasing healthcare spending.
- Dominant Regions: North America (xx% market share), followed by Europe and Asia Pacific.
- Leading Application: Clinical Testing (xx% market share).
- Leading Technique: Sandwich Assay (xx% market share).
- Leading Product: Kits and Reagents (xx% market share).
- Primary End-User: Hospitals and Clinics (xx% market share).
Lateral Flow Assays Market Product Landscape
The Lateral Flow Assays market showcases continuous product innovation, with a focus on enhancing sensitivity, specificity, and ease of use. Recent advancements include the development of multiplex assays capable of detecting multiple analytes simultaneously and the introduction of portable and user-friendly lateral flow readers. These advancements aim to improve diagnostic efficiency and expand the applications of lateral flow assays. Unique selling propositions often include faster test times, simplified sample preparation, and better sensitivity compared to traditional methods. These technological advancements have broadened the applications of lateral flow assays across various sectors.
Key Drivers, Barriers & Challenges in Lateral Flow Assays Market
Key Drivers:
- Increasing demand for rapid diagnostic tests.
- Technological advancements leading to improved accuracy and ease of use.
- Rising prevalence of infectious diseases.
- Increasing healthcare expenditure.
Challenges:
- Competition from alternative diagnostic technologies (e.g., PCR).
- Regulatory hurdles and varying approval processes across different geographies.
- Supply chain disruptions impacting the availability of raw materials and components.
- Maintaining quality control and standardization across different manufacturers. The impact of these challenges is estimated to result in a xx% reduction in market growth in the next 5 years.
Emerging Opportunities in Lateral Flow Assays Market
Significant growth opportunities exist in emerging markets with increasing healthcare infrastructure investments. The development of point-of-care diagnostics and self-testing kits presents substantial market potential. Furthermore, exploration of novel applications, such as environmental monitoring and food safety testing, offers untapped avenues for growth. The integration of digital technologies, such as smartphone connectivity with lateral flow readers, is expected to further enhance market growth.
Growth Accelerators in the Lateral Flow Assays Market Industry
Long-term growth will be propelled by continued technological breakthroughs in assay design and reader technologies, enabling faster, more accurate, and more versatile diagnostics. Strategic partnerships between assay developers, reader manufacturers, and diagnostic companies will create synergies leading to the broader market adoption of lateral flow assays. Expansion into new geographic markets, particularly in developing countries, will also fuel significant growth in the coming years.
Key Players Shaping the Lateral Flow Assays Market Market
- Becton Dickinson and Company
- Quidel Corporation
- Bio-Rad Laboratories Inc
- QIAGEN NV
- Merck KGaA
- Hologic Inc
- Thermo Fisher Scientific Inc
- Siemens AG
- Abbott Laboratories (Alere Inc)
- Abcam PLC
- Danaher Corporation
- F Hoffmann-La Roche AG
- bioMerieux SA
- PerkinElmer Inc
- Chembio Diagnostic Systems Inc
Notable Milestones in Lateral Flow Assays Market Sector
- December 2021: Eurofins Technologies launched its RapidScan ST5-W lateral flow reader for field and in-process testing.
- January 2021: Abbott received CE Mark for two new uses of its Panbio COVID-19 Ag Rapid Test Device.
In-Depth Lateral Flow Assays Market Market Outlook
The future of the Lateral Flow Assays market is bright, characterized by sustained growth driven by technological innovation, expanding applications, and increasing global healthcare spending. Strategic opportunities lie in developing advanced multiplex assays, integrating digital technologies, and penetrating emerging markets. The market is poised for significant expansion, driven by the ongoing need for rapid, accurate, and affordable diagnostic solutions across diverse sectors.
Lateral Flow Assays Market Segmentation
-
1. Application
- 1.1. Clinical Testing
- 1.2. Drug Abuse Testing
- 1.3. Other Applications
-
2. Technique
- 2.1. Sandwich Assay
- 2.2. Competitive Assay
- 2.3. Multiplex Assay
-
3. Product
- 3.1. Lateral Flow Readers
- 3.2. Kits and Reagents
-
4. End User
- 4.1. Home Care
- 4.2. Hospitals and Clinics
- 4.3. Other End Users
Lateral Flow Assays Market Segmentation By Geography
-
1. North America
- 1.1. United States
- 1.2. Canada
- 1.3. Mexico
-
2. Europe
- 2.1. Germany
- 2.2. United Kingdom
- 2.3. France
- 2.4. Italy
- 2.5. Spain
- 2.6. Rest of Europe
-
3. Asia Pacific
- 3.1. China
- 3.2. Japan
- 3.3. India
- 3.4. Australia
- 3.5. South Korea
- 3.6. Rest of Asia Pacific
-
4. Middle East and Africa
- 4.1. GCC
- 4.2. South Africa
- 4.3. Rest of Middle East and Africa
-
5. South America
- 5.1. Brazil
- 5.2. Argentina
- 5.3. Rest of South America
Lateral Flow Assays Market REPORT HIGHLIGHTS
| Aspects | Details |
|---|---|
| Study Period | 2019-2033 |
| Base Year | 2024 |
| Estimated Year | 2025 |
| Forecast Period | 2025-2033 |
| Historical Period | 2019-2024 |
| Growth Rate | CAGR of 5.65% from 2019-2033 |
| Segmentation |
|
Table of Contents
- 1. Introduction
- 1.1. Research Scope
- 1.2. Market Segmentation
- 1.3. Research Methodology
- 1.4. Definitions and Assumptions
- 2. Executive Summary
- 2.1. Introduction
- 3. Market Dynamics
- 3.1. Introduction
- 3.2. Market Drivers
- 3.2.1 Increased Demand for Point-of-care Testing with Technological Advancements; Rise in Adoption of Home-based Devices
- 3.2.2 along with Global Incidence of Infectious Diseases
- 3.3. Market Restrains
- 3.3.1. Stringent and Tedious Regulatory Framework that Delays the Approval of Products; Risk of False Results and Reluctance Toward these Products among the People in Emerging Nations
- 3.4. Market Trends
- 3.4.1. The Clinical Testing Segment is Expected to Hold the Largest Market Share in the Lateral Flow Assay Market
- 4. Market Factor Analysis
- 4.1. Porters Five Forces
- 4.2. Supply/Value Chain
- 4.3. PESTEL analysis
- 4.4. Market Entropy
- 4.5. Patent/Trademark Analysis
- 5. Global Lateral Flow Assays Market Analysis, Insights and Forecast, 2019-2031
- 5.1. Market Analysis, Insights and Forecast - by Application
- 5.1.1. Clinical Testing
- 5.1.2. Drug Abuse Testing
- 5.1.3. Other Applications
- 5.2. Market Analysis, Insights and Forecast - by Technique
- 5.2.1. Sandwich Assay
- 5.2.2. Competitive Assay
- 5.2.3. Multiplex Assay
- 5.3. Market Analysis, Insights and Forecast - by Product
- 5.3.1. Lateral Flow Readers
- 5.3.2. Kits and Reagents
- 5.4. Market Analysis, Insights and Forecast - by End User
- 5.4.1. Home Care
- 5.4.2. Hospitals and Clinics
- 5.4.3. Other End Users
- 5.5. Market Analysis, Insights and Forecast - by Region
- 5.5.1. North America
- 5.5.2. Europe
- 5.5.3. Asia Pacific
- 5.5.4. Middle East and Africa
- 5.5.5. South America
- 5.1. Market Analysis, Insights and Forecast - by Application
- 6. North America Lateral Flow Assays Market Analysis, Insights and Forecast, 2019-2031
- 6.1. Market Analysis, Insights and Forecast - by Application
- 6.1.1. Clinical Testing
- 6.1.2. Drug Abuse Testing
- 6.1.3. Other Applications
- 6.2. Market Analysis, Insights and Forecast - by Technique
- 6.2.1. Sandwich Assay
- 6.2.2. Competitive Assay
- 6.2.3. Multiplex Assay
- 6.3. Market Analysis, Insights and Forecast - by Product
- 6.3.1. Lateral Flow Readers
- 6.3.2. Kits and Reagents
- 6.4. Market Analysis, Insights and Forecast - by End User
- 6.4.1. Home Care
- 6.4.2. Hospitals and Clinics
- 6.4.3. Other End Users
- 6.1. Market Analysis, Insights and Forecast - by Application
- 7. Europe Lateral Flow Assays Market Analysis, Insights and Forecast, 2019-2031
- 7.1. Market Analysis, Insights and Forecast - by Application
- 7.1.1. Clinical Testing
- 7.1.2. Drug Abuse Testing
- 7.1.3. Other Applications
- 7.2. Market Analysis, Insights and Forecast - by Technique
- 7.2.1. Sandwich Assay
- 7.2.2. Competitive Assay
- 7.2.3. Multiplex Assay
- 7.3. Market Analysis, Insights and Forecast - by Product
- 7.3.1. Lateral Flow Readers
- 7.3.2. Kits and Reagents
- 7.4. Market Analysis, Insights and Forecast - by End User
- 7.4.1. Home Care
- 7.4.2. Hospitals and Clinics
- 7.4.3. Other End Users
- 7.1. Market Analysis, Insights and Forecast - by Application
- 8. Asia Pacific Lateral Flow Assays Market Analysis, Insights and Forecast, 2019-2031
- 8.1. Market Analysis, Insights and Forecast - by Application
- 8.1.1. Clinical Testing
- 8.1.2. Drug Abuse Testing
- 8.1.3. Other Applications
- 8.2. Market Analysis, Insights and Forecast - by Technique
- 8.2.1. Sandwich Assay
- 8.2.2. Competitive Assay
- 8.2.3. Multiplex Assay
- 8.3. Market Analysis, Insights and Forecast - by Product
- 8.3.1. Lateral Flow Readers
- 8.3.2. Kits and Reagents
- 8.4. Market Analysis, Insights and Forecast - by End User
- 8.4.1. Home Care
- 8.4.2. Hospitals and Clinics
- 8.4.3. Other End Users
- 8.1. Market Analysis, Insights and Forecast - by Application
- 9. Middle East and Africa Lateral Flow Assays Market Analysis, Insights and Forecast, 2019-2031
- 9.1. Market Analysis, Insights and Forecast - by Application
- 9.1.1. Clinical Testing
- 9.1.2. Drug Abuse Testing
- 9.1.3. Other Applications
- 9.2. Market Analysis, Insights and Forecast - by Technique
- 9.2.1. Sandwich Assay
- 9.2.2. Competitive Assay
- 9.2.3. Multiplex Assay
- 9.3. Market Analysis, Insights and Forecast - by Product
- 9.3.1. Lateral Flow Readers
- 9.3.2. Kits and Reagents
- 9.4. Market Analysis, Insights and Forecast - by End User
- 9.4.1. Home Care
- 9.4.2. Hospitals and Clinics
- 9.4.3. Other End Users
- 9.1. Market Analysis, Insights and Forecast - by Application
- 10. South America Lateral Flow Assays Market Analysis, Insights and Forecast, 2019-2031
- 10.1. Market Analysis, Insights and Forecast - by Application
- 10.1.1. Clinical Testing
- 10.1.2. Drug Abuse Testing
- 10.1.3. Other Applications
- 10.2. Market Analysis, Insights and Forecast - by Technique
- 10.2.1. Sandwich Assay
- 10.2.2. Competitive Assay
- 10.2.3. Multiplex Assay
- 10.3. Market Analysis, Insights and Forecast - by Product
- 10.3.1. Lateral Flow Readers
- 10.3.2. Kits and Reagents
- 10.4. Market Analysis, Insights and Forecast - by End User
- 10.4.1. Home Care
- 10.4.2. Hospitals and Clinics
- 10.4.3. Other End Users
- 10.1. Market Analysis, Insights and Forecast - by Application
- 11. North America Lateral Flow Assays Market Analysis, Insights and Forecast, 2019-2031
- 11.1. Market Analysis, Insights and Forecast - By Country/Sub-region
- 11.1.1 United States
- 11.1.2 Canada
- 11.1.3 Mexico
- 12. Europe Lateral Flow Assays Market Analysis, Insights and Forecast, 2019-2031
- 12.1. Market Analysis, Insights and Forecast - By Country/Sub-region
- 12.1.1 Germany
- 12.1.2 United Kingdom
- 12.1.3 France
- 12.1.4 Italy
- 12.1.5 Spain
- 12.1.6 Rest of Europe
- 13. Asia Pacific Lateral Flow Assays Market Analysis, Insights and Forecast, 2019-2031
- 13.1. Market Analysis, Insights and Forecast - By Country/Sub-region
- 13.1.1 China
- 13.1.2 Japan
- 13.1.3 India
- 13.1.4 Australia
- 13.1.5 South Korea
- 13.1.6 Rest of Asia Pacific
- 14. Middle East and Africa Lateral Flow Assays Market Analysis, Insights and Forecast, 2019-2031
- 14.1. Market Analysis, Insights and Forecast - By Country/Sub-region
- 14.1.1 GCC
- 14.1.2 South Africa
- 14.1.3 Rest of Middle East and Africa
- 15. South America Lateral Flow Assays Market Analysis, Insights and Forecast, 2019-2031
- 15.1. Market Analysis, Insights and Forecast - By Country/Sub-region
- 15.1.1 Brazil
- 15.1.2 Argentina
- 15.1.3 Rest of South America
- 16. Competitive Analysis
- 16.1. Global Market Share Analysis 2024
- 16.2. Company Profiles
- 16.2.1 Becton Dickinson and Company
- 16.2.1.1. Overview
- 16.2.1.2. Products
- 16.2.1.3. SWOT Analysis
- 16.2.1.4. Recent Developments
- 16.2.1.5. Financials (Based on Availability)
- 16.2.2 Quidel Corporation
- 16.2.2.1. Overview
- 16.2.2.2. Products
- 16.2.2.3. SWOT Analysis
- 16.2.2.4. Recent Developments
- 16.2.2.5. Financials (Based on Availability)
- 16.2.3 Bio-Rad Laboratories Inc
- 16.2.3.1. Overview
- 16.2.3.2. Products
- 16.2.3.3. SWOT Analysis
- 16.2.3.4. Recent Developments
- 16.2.3.5. Financials (Based on Availability)
- 16.2.4 QIAGEN NV
- 16.2.4.1. Overview
- 16.2.4.2. Products
- 16.2.4.3. SWOT Analysis
- 16.2.4.4. Recent Developments
- 16.2.4.5. Financials (Based on Availability)
- 16.2.5 Merck KGaA
- 16.2.5.1. Overview
- 16.2.5.2. Products
- 16.2.5.3. SWOT Analysis
- 16.2.5.4. Recent Developments
- 16.2.5.5. Financials (Based on Availability)
- 16.2.6 Hologic Inc
- 16.2.6.1. Overview
- 16.2.6.2. Products
- 16.2.6.3. SWOT Analysis
- 16.2.6.4. Recent Developments
- 16.2.6.5. Financials (Based on Availability)
- 16.2.7 Thermo Fisher Scientific Inc
- 16.2.7.1. Overview
- 16.2.7.2. Products
- 16.2.7.3. SWOT Analysis
- 16.2.7.4. Recent Developments
- 16.2.7.5. Financials (Based on Availability)
- 16.2.8 Siemens AG
- 16.2.8.1. Overview
- 16.2.8.2. Products
- 16.2.8.3. SWOT Analysis
- 16.2.8.4. Recent Developments
- 16.2.8.5. Financials (Based on Availability)
- 16.2.9 Abbott Laboratories (Alere Inc )
- 16.2.9.1. Overview
- 16.2.9.2. Products
- 16.2.9.3. SWOT Analysis
- 16.2.9.4. Recent Developments
- 16.2.9.5. Financials (Based on Availability)
- 16.2.10 Abcam PLC
- 16.2.10.1. Overview
- 16.2.10.2. Products
- 16.2.10.3. SWOT Analysis
- 16.2.10.4. Recent Developments
- 16.2.10.5. Financials (Based on Availability)
- 16.2.11 Danaher Corporation
- 16.2.11.1. Overview
- 16.2.11.2. Products
- 16.2.11.3. SWOT Analysis
- 16.2.11.4. Recent Developments
- 16.2.11.5. Financials (Based on Availability)
- 16.2.12 F Hoffmann-La Roche AG
- 16.2.12.1. Overview
- 16.2.12.2. Products
- 16.2.12.3. SWOT Analysis
- 16.2.12.4. Recent Developments
- 16.2.12.5. Financials (Based on Availability)
- 16.2.13 bioMerieux SA
- 16.2.13.1. Overview
- 16.2.13.2. Products
- 16.2.13.3. SWOT Analysis
- 16.2.13.4. Recent Developments
- 16.2.13.5. Financials (Based on Availability)
- 16.2.14 PerkinElmer Inc
- 16.2.14.1. Overview
- 16.2.14.2. Products
- 16.2.14.3. SWOT Analysis
- 16.2.14.4. Recent Developments
- 16.2.14.5. Financials (Based on Availability)
- 16.2.15 Chembio Diagnostic Systems Inc
- 16.2.15.1. Overview
- 16.2.15.2. Products
- 16.2.15.3. SWOT Analysis
- 16.2.15.4. Recent Developments
- 16.2.15.5. Financials (Based on Availability)
- 16.2.1 Becton Dickinson and Company
List of Figures
- Figure 1: Global Lateral Flow Assays Market Revenue Breakdown (Million, %) by Region 2024 & 2032
- Figure 2: Global Lateral Flow Assays Market Volume Breakdown (K Unit, %) by Region 2024 & 2032
- Figure 3: North America Lateral Flow Assays Market Revenue (Million), by Country 2024 & 2032
- Figure 4: North America Lateral Flow Assays Market Volume (K Unit), by Country 2024 & 2032
- Figure 5: North America Lateral Flow Assays Market Revenue Share (%), by Country 2024 & 2032
- Figure 6: North America Lateral Flow Assays Market Volume Share (%), by Country 2024 & 2032
- Figure 7: Europe Lateral Flow Assays Market Revenue (Million), by Country 2024 & 2032
- Figure 8: Europe Lateral Flow Assays Market Volume (K Unit), by Country 2024 & 2032
- Figure 9: Europe Lateral Flow Assays Market Revenue Share (%), by Country 2024 & 2032
- Figure 10: Europe Lateral Flow Assays Market Volume Share (%), by Country 2024 & 2032
- Figure 11: Asia Pacific Lateral Flow Assays Market Revenue (Million), by Country 2024 & 2032
- Figure 12: Asia Pacific Lateral Flow Assays Market Volume (K Unit), by Country 2024 & 2032
- Figure 13: Asia Pacific Lateral Flow Assays Market Revenue Share (%), by Country 2024 & 2032
- Figure 14: Asia Pacific Lateral Flow Assays Market Volume Share (%), by Country 2024 & 2032
- Figure 15: Middle East and Africa Lateral Flow Assays Market Revenue (Million), by Country 2024 & 2032
- Figure 16: Middle East and Africa Lateral Flow Assays Market Volume (K Unit), by Country 2024 & 2032
- Figure 17: Middle East and Africa Lateral Flow Assays Market Revenue Share (%), by Country 2024 & 2032
- Figure 18: Middle East and Africa Lateral Flow Assays Market Volume Share (%), by Country 2024 & 2032
- Figure 19: South America Lateral Flow Assays Market Revenue (Million), by Country 2024 & 2032
- Figure 20: South America Lateral Flow Assays Market Volume (K Unit), by Country 2024 & 2032
- Figure 21: South America Lateral Flow Assays Market Revenue Share (%), by Country 2024 & 2032
- Figure 22: South America Lateral Flow Assays Market Volume Share (%), by Country 2024 & 2032
- Figure 23: North America Lateral Flow Assays Market Revenue (Million), by Application 2024 & 2032
- Figure 24: North America Lateral Flow Assays Market Volume (K Unit), by Application 2024 & 2032
- Figure 25: North America Lateral Flow Assays Market Revenue Share (%), by Application 2024 & 2032
- Figure 26: North America Lateral Flow Assays Market Volume Share (%), by Application 2024 & 2032
- Figure 27: North America Lateral Flow Assays Market Revenue (Million), by Technique 2024 & 2032
- Figure 28: North America Lateral Flow Assays Market Volume (K Unit), by Technique 2024 & 2032
- Figure 29: North America Lateral Flow Assays Market Revenue Share (%), by Technique 2024 & 2032
- Figure 30: North America Lateral Flow Assays Market Volume Share (%), by Technique 2024 & 2032
- Figure 31: North America Lateral Flow Assays Market Revenue (Million), by Product 2024 & 2032
- Figure 32: North America Lateral Flow Assays Market Volume (K Unit), by Product 2024 & 2032
- Figure 33: North America Lateral Flow Assays Market Revenue Share (%), by Product 2024 & 2032
- Figure 34: North America Lateral Flow Assays Market Volume Share (%), by Product 2024 & 2032
- Figure 35: North America Lateral Flow Assays Market Revenue (Million), by End User 2024 & 2032
- Figure 36: North America Lateral Flow Assays Market Volume (K Unit), by End User 2024 & 2032
- Figure 37: North America Lateral Flow Assays Market Revenue Share (%), by End User 2024 & 2032
- Figure 38: North America Lateral Flow Assays Market Volume Share (%), by End User 2024 & 2032
- Figure 39: North America Lateral Flow Assays Market Revenue (Million), by Country 2024 & 2032
- Figure 40: North America Lateral Flow Assays Market Volume (K Unit), by Country 2024 & 2032
- Figure 41: North America Lateral Flow Assays Market Revenue Share (%), by Country 2024 & 2032
- Figure 42: North America Lateral Flow Assays Market Volume Share (%), by Country 2024 & 2032
- Figure 43: Europe Lateral Flow Assays Market Revenue (Million), by Application 2024 & 2032
- Figure 44: Europe Lateral Flow Assays Market Volume (K Unit), by Application 2024 & 2032
- Figure 45: Europe Lateral Flow Assays Market Revenue Share (%), by Application 2024 & 2032
- Figure 46: Europe Lateral Flow Assays Market Volume Share (%), by Application 2024 & 2032
- Figure 47: Europe Lateral Flow Assays Market Revenue (Million), by Technique 2024 & 2032
- Figure 48: Europe Lateral Flow Assays Market Volume (K Unit), by Technique 2024 & 2032
- Figure 49: Europe Lateral Flow Assays Market Revenue Share (%), by Technique 2024 & 2032
- Figure 50: Europe Lateral Flow Assays Market Volume Share (%), by Technique 2024 & 2032
- Figure 51: Europe Lateral Flow Assays Market Revenue (Million), by Product 2024 & 2032
- Figure 52: Europe Lateral Flow Assays Market Volume (K Unit), by Product 2024 & 2032
- Figure 53: Europe Lateral Flow Assays Market Revenue Share (%), by Product 2024 & 2032
- Figure 54: Europe Lateral Flow Assays Market Volume Share (%), by Product 2024 & 2032
- Figure 55: Europe Lateral Flow Assays Market Revenue (Million), by End User 2024 & 2032
- Figure 56: Europe Lateral Flow Assays Market Volume (K Unit), by End User 2024 & 2032
- Figure 57: Europe Lateral Flow Assays Market Revenue Share (%), by End User 2024 & 2032
- Figure 58: Europe Lateral Flow Assays Market Volume Share (%), by End User 2024 & 2032
- Figure 59: Europe Lateral Flow Assays Market Revenue (Million), by Country 2024 & 2032
- Figure 60: Europe Lateral Flow Assays Market Volume (K Unit), by Country 2024 & 2032
- Figure 61: Europe Lateral Flow Assays Market Revenue Share (%), by Country 2024 & 2032
- Figure 62: Europe Lateral Flow Assays Market Volume Share (%), by Country 2024 & 2032
- Figure 63: Asia Pacific Lateral Flow Assays Market Revenue (Million), by Application 2024 & 2032
- Figure 64: Asia Pacific Lateral Flow Assays Market Volume (K Unit), by Application 2024 & 2032
- Figure 65: Asia Pacific Lateral Flow Assays Market Revenue Share (%), by Application 2024 & 2032
- Figure 66: Asia Pacific Lateral Flow Assays Market Volume Share (%), by Application 2024 & 2032
- Figure 67: Asia Pacific Lateral Flow Assays Market Revenue (Million), by Technique 2024 & 2032
- Figure 68: Asia Pacific Lateral Flow Assays Market Volume (K Unit), by Technique 2024 & 2032
- Figure 69: Asia Pacific Lateral Flow Assays Market Revenue Share (%), by Technique 2024 & 2032
- Figure 70: Asia Pacific Lateral Flow Assays Market Volume Share (%), by Technique 2024 & 2032
- Figure 71: Asia Pacific Lateral Flow Assays Market Revenue (Million), by Product 2024 & 2032
- Figure 72: Asia Pacific Lateral Flow Assays Market Volume (K Unit), by Product 2024 & 2032
- Figure 73: Asia Pacific Lateral Flow Assays Market Revenue Share (%), by Product 2024 & 2032
- Figure 74: Asia Pacific Lateral Flow Assays Market Volume Share (%), by Product 2024 & 2032
- Figure 75: Asia Pacific Lateral Flow Assays Market Revenue (Million), by End User 2024 & 2032
- Figure 76: Asia Pacific Lateral Flow Assays Market Volume (K Unit), by End User 2024 & 2032
- Figure 77: Asia Pacific Lateral Flow Assays Market Revenue Share (%), by End User 2024 & 2032
- Figure 78: Asia Pacific Lateral Flow Assays Market Volume Share (%), by End User 2024 & 2032
- Figure 79: Asia Pacific Lateral Flow Assays Market Revenue (Million), by Country 2024 & 2032
- Figure 80: Asia Pacific Lateral Flow Assays Market Volume (K Unit), by Country 2024 & 2032
- Figure 81: Asia Pacific Lateral Flow Assays Market Revenue Share (%), by Country 2024 & 2032
- Figure 82: Asia Pacific Lateral Flow Assays Market Volume Share (%), by Country 2024 & 2032
- Figure 83: Middle East and Africa Lateral Flow Assays Market Revenue (Million), by Application 2024 & 2032
- Figure 84: Middle East and Africa Lateral Flow Assays Market Volume (K Unit), by Application 2024 & 2032
- Figure 85: Middle East and Africa Lateral Flow Assays Market Revenue Share (%), by Application 2024 & 2032
- Figure 86: Middle East and Africa Lateral Flow Assays Market Volume Share (%), by Application 2024 & 2032
- Figure 87: Middle East and Africa Lateral Flow Assays Market Revenue (Million), by Technique 2024 & 2032
- Figure 88: Middle East and Africa Lateral Flow Assays Market Volume (K Unit), by Technique 2024 & 2032
- Figure 89: Middle East and Africa Lateral Flow Assays Market Revenue Share (%), by Technique 2024 & 2032
- Figure 90: Middle East and Africa Lateral Flow Assays Market Volume Share (%), by Technique 2024 & 2032
- Figure 91: Middle East and Africa Lateral Flow Assays Market Revenue (Million), by Product 2024 & 2032
- Figure 92: Middle East and Africa Lateral Flow Assays Market Volume (K Unit), by Product 2024 & 2032
- Figure 93: Middle East and Africa Lateral Flow Assays Market Revenue Share (%), by Product 2024 & 2032
- Figure 94: Middle East and Africa Lateral Flow Assays Market Volume Share (%), by Product 2024 & 2032
- Figure 95: Middle East and Africa Lateral Flow Assays Market Revenue (Million), by End User 2024 & 2032
- Figure 96: Middle East and Africa Lateral Flow Assays Market Volume (K Unit), by End User 2024 & 2032
- Figure 97: Middle East and Africa Lateral Flow Assays Market Revenue Share (%), by End User 2024 & 2032
- Figure 98: Middle East and Africa Lateral Flow Assays Market Volume Share (%), by End User 2024 & 2032
- Figure 99: Middle East and Africa Lateral Flow Assays Market Revenue (Million), by Country 2024 & 2032
- Figure 100: Middle East and Africa Lateral Flow Assays Market Volume (K Unit), by Country 2024 & 2032
- Figure 101: Middle East and Africa Lateral Flow Assays Market Revenue Share (%), by Country 2024 & 2032
- Figure 102: Middle East and Africa Lateral Flow Assays Market Volume Share (%), by Country 2024 & 2032
- Figure 103: South America Lateral Flow Assays Market Revenue (Million), by Application 2024 & 2032
- Figure 104: South America Lateral Flow Assays Market Volume (K Unit), by Application 2024 & 2032
- Figure 105: South America Lateral Flow Assays Market Revenue Share (%), by Application 2024 & 2032
- Figure 106: South America Lateral Flow Assays Market Volume Share (%), by Application 2024 & 2032
- Figure 107: South America Lateral Flow Assays Market Revenue (Million), by Technique 2024 & 2032
- Figure 108: South America Lateral Flow Assays Market Volume (K Unit), by Technique 2024 & 2032
- Figure 109: South America Lateral Flow Assays Market Revenue Share (%), by Technique 2024 & 2032
- Figure 110: South America Lateral Flow Assays Market Volume Share (%), by Technique 2024 & 2032
- Figure 111: South America Lateral Flow Assays Market Revenue (Million), by Product 2024 & 2032
- Figure 112: South America Lateral Flow Assays Market Volume (K Unit), by Product 2024 & 2032
- Figure 113: South America Lateral Flow Assays Market Revenue Share (%), by Product 2024 & 2032
- Figure 114: South America Lateral Flow Assays Market Volume Share (%), by Product 2024 & 2032
- Figure 115: South America Lateral Flow Assays Market Revenue (Million), by End User 2024 & 2032
- Figure 116: South America Lateral Flow Assays Market Volume (K Unit), by End User 2024 & 2032
- Figure 117: South America Lateral Flow Assays Market Revenue Share (%), by End User 2024 & 2032
- Figure 118: South America Lateral Flow Assays Market Volume Share (%), by End User 2024 & 2032
- Figure 119: South America Lateral Flow Assays Market Revenue (Million), by Country 2024 & 2032
- Figure 120: South America Lateral Flow Assays Market Volume (K Unit), by Country 2024 & 2032
- Figure 121: South America Lateral Flow Assays Market Revenue Share (%), by Country 2024 & 2032
- Figure 122: South America Lateral Flow Assays Market Volume Share (%), by Country 2024 & 2032
List of Tables
- Table 1: Global Lateral Flow Assays Market Revenue Million Forecast, by Region 2019 & 2032
- Table 2: Global Lateral Flow Assays Market Volume K Unit Forecast, by Region 2019 & 2032
- Table 3: Global Lateral Flow Assays Market Revenue Million Forecast, by Application 2019 & 2032
- Table 4: Global Lateral Flow Assays Market Volume K Unit Forecast, by Application 2019 & 2032
- Table 5: Global Lateral Flow Assays Market Revenue Million Forecast, by Technique 2019 & 2032
- Table 6: Global Lateral Flow Assays Market Volume K Unit Forecast, by Technique 2019 & 2032
- Table 7: Global Lateral Flow Assays Market Revenue Million Forecast, by Product 2019 & 2032
- Table 8: Global Lateral Flow Assays Market Volume K Unit Forecast, by Product 2019 & 2032
- Table 9: Global Lateral Flow Assays Market Revenue Million Forecast, by End User 2019 & 2032
- Table 10: Global Lateral Flow Assays Market Volume K Unit Forecast, by End User 2019 & 2032
- Table 11: Global Lateral Flow Assays Market Revenue Million Forecast, by Region 2019 & 2032
- Table 12: Global Lateral Flow Assays Market Volume K Unit Forecast, by Region 2019 & 2032
- Table 13: Global Lateral Flow Assays Market Revenue Million Forecast, by Country 2019 & 2032
- Table 14: Global Lateral Flow Assays Market Volume K Unit Forecast, by Country 2019 & 2032
- Table 15: United States Lateral Flow Assays Market Revenue (Million) Forecast, by Application 2019 & 2032
- Table 16: United States Lateral Flow Assays Market Volume (K Unit) Forecast, by Application 2019 & 2032
- Table 17: Canada Lateral Flow Assays Market Revenue (Million) Forecast, by Application 2019 & 2032
- Table 18: Canada Lateral Flow Assays Market Volume (K Unit) Forecast, by Application 2019 & 2032
- Table 19: Mexico Lateral Flow Assays Market Revenue (Million) Forecast, by Application 2019 & 2032
- Table 20: Mexico Lateral Flow Assays Market Volume (K Unit) Forecast, by Application 2019 & 2032
- Table 21: Global Lateral Flow Assays Market Revenue Million Forecast, by Country 2019 & 2032
- Table 22: Global Lateral Flow Assays Market Volume K Unit Forecast, by Country 2019 & 2032
- Table 23: Germany Lateral Flow Assays Market Revenue (Million) Forecast, by Application 2019 & 2032
- Table 24: Germany Lateral Flow Assays Market Volume (K Unit) Forecast, by Application 2019 & 2032
- Table 25: United Kingdom Lateral Flow Assays Market Revenue (Million) Forecast, by Application 2019 & 2032
- Table 26: United Kingdom Lateral Flow Assays Market Volume (K Unit) Forecast, by Application 2019 & 2032
- Table 27: France Lateral Flow Assays Market Revenue (Million) Forecast, by Application 2019 & 2032
- Table 28: France Lateral Flow Assays Market Volume (K Unit) Forecast, by Application 2019 & 2032
- Table 29: Italy Lateral Flow Assays Market Revenue (Million) Forecast, by Application 2019 & 2032
- Table 30: Italy Lateral Flow Assays Market Volume (K Unit) Forecast, by Application 2019 & 2032
- Table 31: Spain Lateral Flow Assays Market Revenue (Million) Forecast, by Application 2019 & 2032
- Table 32: Spain Lateral Flow Assays Market Volume (K Unit) Forecast, by Application 2019 & 2032
- Table 33: Rest of Europe Lateral Flow Assays Market Revenue (Million) Forecast, by Application 2019 & 2032
- Table 34: Rest of Europe Lateral Flow Assays Market Volume (K Unit) Forecast, by Application 2019 & 2032
- Table 35: Global Lateral Flow Assays Market Revenue Million Forecast, by Country 2019 & 2032
- Table 36: Global Lateral Flow Assays Market Volume K Unit Forecast, by Country 2019 & 2032
- Table 37: China Lateral Flow Assays Market Revenue (Million) Forecast, by Application 2019 & 2032
- Table 38: China Lateral Flow Assays Market Volume (K Unit) Forecast, by Application 2019 & 2032
- Table 39: Japan Lateral Flow Assays Market Revenue (Million) Forecast, by Application 2019 & 2032
- Table 40: Japan Lateral Flow Assays Market Volume (K Unit) Forecast, by Application 2019 & 2032
- Table 41: India Lateral Flow Assays Market Revenue (Million) Forecast, by Application 2019 & 2032
- Table 42: India Lateral Flow Assays Market Volume (K Unit) Forecast, by Application 2019 & 2032
- Table 43: Australia Lateral Flow Assays Market Revenue (Million) Forecast, by Application 2019 & 2032
- Table 44: Australia Lateral Flow Assays Market Volume (K Unit) Forecast, by Application 2019 & 2032
- Table 45: South Korea Lateral Flow Assays Market Revenue (Million) Forecast, by Application 2019 & 2032
- Table 46: South Korea Lateral Flow Assays Market Volume (K Unit) Forecast, by Application 2019 & 2032
- Table 47: Rest of Asia Pacific Lateral Flow Assays Market Revenue (Million) Forecast, by Application 2019 & 2032
- Table 48: Rest of Asia Pacific Lateral Flow Assays Market Volume (K Unit) Forecast, by Application 2019 & 2032
- Table 49: Global Lateral Flow Assays Market Revenue Million Forecast, by Country 2019 & 2032
- Table 50: Global Lateral Flow Assays Market Volume K Unit Forecast, by Country 2019 & 2032
- Table 51: GCC Lateral Flow Assays Market Revenue (Million) Forecast, by Application 2019 & 2032
- Table 52: GCC Lateral Flow Assays Market Volume (K Unit) Forecast, by Application 2019 & 2032
- Table 53: South Africa Lateral Flow Assays Market Revenue (Million) Forecast, by Application 2019 & 2032
- Table 54: South Africa Lateral Flow Assays Market Volume (K Unit) Forecast, by Application 2019 & 2032
- Table 55: Rest of Middle East and Africa Lateral Flow Assays Market Revenue (Million) Forecast, by Application 2019 & 2032
- Table 56: Rest of Middle East and Africa Lateral Flow Assays Market Volume (K Unit) Forecast, by Application 2019 & 2032
- Table 57: Global Lateral Flow Assays Market Revenue Million Forecast, by Country 2019 & 2032
- Table 58: Global Lateral Flow Assays Market Volume K Unit Forecast, by Country 2019 & 2032
- Table 59: Brazil Lateral Flow Assays Market Revenue (Million) Forecast, by Application 2019 & 2032
- Table 60: Brazil Lateral Flow Assays Market Volume (K Unit) Forecast, by Application 2019 & 2032
- Table 61: Argentina Lateral Flow Assays Market Revenue (Million) Forecast, by Application 2019 & 2032
- Table 62: Argentina Lateral Flow Assays Market Volume (K Unit) Forecast, by Application 2019 & 2032
- Table 63: Rest of South America Lateral Flow Assays Market Revenue (Million) Forecast, by Application 2019 & 2032
- Table 64: Rest of South America Lateral Flow Assays Market Volume (K Unit) Forecast, by Application 2019 & 2032
- Table 65: Global Lateral Flow Assays Market Revenue Million Forecast, by Application 2019 & 2032
- Table 66: Global Lateral Flow Assays Market Volume K Unit Forecast, by Application 2019 & 2032
- Table 67: Global Lateral Flow Assays Market Revenue Million Forecast, by Technique 2019 & 2032
- Table 68: Global Lateral Flow Assays Market Volume K Unit Forecast, by Technique 2019 & 2032
- Table 69: Global Lateral Flow Assays Market Revenue Million Forecast, by Product 2019 & 2032
- Table 70: Global Lateral Flow Assays Market Volume K Unit Forecast, by Product 2019 & 2032
- Table 71: Global Lateral Flow Assays Market Revenue Million Forecast, by End User 2019 & 2032
- Table 72: Global Lateral Flow Assays Market Volume K Unit Forecast, by End User 2019 & 2032
- Table 73: Global Lateral Flow Assays Market Revenue Million Forecast, by Country 2019 & 2032
- Table 74: Global Lateral Flow Assays Market Volume K Unit Forecast, by Country 2019 & 2032
- Table 75: United States Lateral Flow Assays Market Revenue (Million) Forecast, by Application 2019 & 2032
- Table 76: United States Lateral Flow Assays Market Volume (K Unit) Forecast, by Application 2019 & 2032
- Table 77: Canada Lateral Flow Assays Market Revenue (Million) Forecast, by Application 2019 & 2032
- Table 78: Canada Lateral Flow Assays Market Volume (K Unit) Forecast, by Application 2019 & 2032
- Table 79: Mexico Lateral Flow Assays Market Revenue (Million) Forecast, by Application 2019 & 2032
- Table 80: Mexico Lateral Flow Assays Market Volume (K Unit) Forecast, by Application 2019 & 2032
- Table 81: Global Lateral Flow Assays Market Revenue Million Forecast, by Application 2019 & 2032
- Table 82: Global Lateral Flow Assays Market Volume K Unit Forecast, by Application 2019 & 2032
- Table 83: Global Lateral Flow Assays Market Revenue Million Forecast, by Technique 2019 & 2032
- Table 84: Global Lateral Flow Assays Market Volume K Unit Forecast, by Technique 2019 & 2032
- Table 85: Global Lateral Flow Assays Market Revenue Million Forecast, by Product 2019 & 2032
- Table 86: Global Lateral Flow Assays Market Volume K Unit Forecast, by Product 2019 & 2032
- Table 87: Global Lateral Flow Assays Market Revenue Million Forecast, by End User 2019 & 2032
- Table 88: Global Lateral Flow Assays Market Volume K Unit Forecast, by End User 2019 & 2032
- Table 89: Global Lateral Flow Assays Market Revenue Million Forecast, by Country 2019 & 2032
- Table 90: Global Lateral Flow Assays Market Volume K Unit Forecast, by Country 2019 & 2032
- Table 91: Germany Lateral Flow Assays Market Revenue (Million) Forecast, by Application 2019 & 2032
- Table 92: Germany Lateral Flow Assays Market Volume (K Unit) Forecast, by Application 2019 & 2032
- Table 93: United Kingdom Lateral Flow Assays Market Revenue (Million) Forecast, by Application 2019 & 2032
- Table 94: United Kingdom Lateral Flow Assays Market Volume (K Unit) Forecast, by Application 2019 & 2032
- Table 95: France Lateral Flow Assays Market Revenue (Million) Forecast, by Application 2019 & 2032
- Table 96: France Lateral Flow Assays Market Volume (K Unit) Forecast, by Application 2019 & 2032
- Table 97: Italy Lateral Flow Assays Market Revenue (Million) Forecast, by Application 2019 & 2032
- Table 98: Italy Lateral Flow Assays Market Volume (K Unit) Forecast, by Application 2019 & 2032
- Table 99: Spain Lateral Flow Assays Market Revenue (Million) Forecast, by Application 2019 & 2032
- Table 100: Spain Lateral Flow Assays Market Volume (K Unit) Forecast, by Application 2019 & 2032
- Table 101: Rest of Europe Lateral Flow Assays Market Revenue (Million) Forecast, by Application 2019 & 2032
- Table 102: Rest of Europe Lateral Flow Assays Market Volume (K Unit) Forecast, by Application 2019 & 2032
- Table 103: Global Lateral Flow Assays Market Revenue Million Forecast, by Application 2019 & 2032
- Table 104: Global Lateral Flow Assays Market Volume K Unit Forecast, by Application 2019 & 2032
- Table 105: Global Lateral Flow Assays Market Revenue Million Forecast, by Technique 2019 & 2032
- Table 106: Global Lateral Flow Assays Market Volume K Unit Forecast, by Technique 2019 & 2032
- Table 107: Global Lateral Flow Assays Market Revenue Million Forecast, by Product 2019 & 2032
- Table 108: Global Lateral Flow Assays Market Volume K Unit Forecast, by Product 2019 & 2032
- Table 109: Global Lateral Flow Assays Market Revenue Million Forecast, by End User 2019 & 2032
- Table 110: Global Lateral Flow Assays Market Volume K Unit Forecast, by End User 2019 & 2032
- Table 111: Global Lateral Flow Assays Market Revenue Million Forecast, by Country 2019 & 2032
- Table 112: Global Lateral Flow Assays Market Volume K Unit Forecast, by Country 2019 & 2032
- Table 113: China Lateral Flow Assays Market Revenue (Million) Forecast, by Application 2019 & 2032
- Table 114: China Lateral Flow Assays Market Volume (K Unit) Forecast, by Application 2019 & 2032
- Table 115: Japan Lateral Flow Assays Market Revenue (Million) Forecast, by Application 2019 & 2032
- Table 116: Japan Lateral Flow Assays Market Volume (K Unit) Forecast, by Application 2019 & 2032
- Table 117: India Lateral Flow Assays Market Revenue (Million) Forecast, by Application 2019 & 2032
- Table 118: India Lateral Flow Assays Market Volume (K Unit) Forecast, by Application 2019 & 2032
- Table 119: Australia Lateral Flow Assays Market Revenue (Million) Forecast, by Application 2019 & 2032
- Table 120: Australia Lateral Flow Assays Market Volume (K Unit) Forecast, by Application 2019 & 2032
- Table 121: South Korea Lateral Flow Assays Market Revenue (Million) Forecast, by Application 2019 & 2032
- Table 122: South Korea Lateral Flow Assays Market Volume (K Unit) Forecast, by Application 2019 & 2032
- Table 123: Rest of Asia Pacific Lateral Flow Assays Market Revenue (Million) Forecast, by Application 2019 & 2032
- Table 124: Rest of Asia Pacific Lateral Flow Assays Market Volume (K Unit) Forecast, by Application 2019 & 2032
- Table 125: Global Lateral Flow Assays Market Revenue Million Forecast, by Application 2019 & 2032
- Table 126: Global Lateral Flow Assays Market Volume K Unit Forecast, by Application 2019 & 2032
- Table 127: Global Lateral Flow Assays Market Revenue Million Forecast, by Technique 2019 & 2032
- Table 128: Global Lateral Flow Assays Market Volume K Unit Forecast, by Technique 2019 & 2032
- Table 129: Global Lateral Flow Assays Market Revenue Million Forecast, by Product 2019 & 2032
- Table 130: Global Lateral Flow Assays Market Volume K Unit Forecast, by Product 2019 & 2032
- Table 131: Global Lateral Flow Assays Market Revenue Million Forecast, by End User 2019 & 2032
- Table 132: Global Lateral Flow Assays Market Volume K Unit Forecast, by End User 2019 & 2032
- Table 133: Global Lateral Flow Assays Market Revenue Million Forecast, by Country 2019 & 2032
- Table 134: Global Lateral Flow Assays Market Volume K Unit Forecast, by Country 2019 & 2032
- Table 135: GCC Lateral Flow Assays Market Revenue (Million) Forecast, by Application 2019 & 2032
- Table 136: GCC Lateral Flow Assays Market Volume (K Unit) Forecast, by Application 2019 & 2032
- Table 137: South Africa Lateral Flow Assays Market Revenue (Million) Forecast, by Application 2019 & 2032
- Table 138: South Africa Lateral Flow Assays Market Volume (K Unit) Forecast, by Application 2019 & 2032
- Table 139: Rest of Middle East and Africa Lateral Flow Assays Market Revenue (Million) Forecast, by Application 2019 & 2032
- Table 140: Rest of Middle East and Africa Lateral Flow Assays Market Volume (K Unit) Forecast, by Application 2019 & 2032
- Table 141: Global Lateral Flow Assays Market Revenue Million Forecast, by Application 2019 & 2032
- Table 142: Global Lateral Flow Assays Market Volume K Unit Forecast, by Application 2019 & 2032
- Table 143: Global Lateral Flow Assays Market Revenue Million Forecast, by Technique 2019 & 2032
- Table 144: Global Lateral Flow Assays Market Volume K Unit Forecast, by Technique 2019 & 2032
- Table 145: Global Lateral Flow Assays Market Revenue Million Forecast, by Product 2019 & 2032
- Table 146: Global Lateral Flow Assays Market Volume K Unit Forecast, by Product 2019 & 2032
- Table 147: Global Lateral Flow Assays Market Revenue Million Forecast, by End User 2019 & 2032
- Table 148: Global Lateral Flow Assays Market Volume K Unit Forecast, by End User 2019 & 2032
- Table 149: Global Lateral Flow Assays Market Revenue Million Forecast, by Country 2019 & 2032
- Table 150: Global Lateral Flow Assays Market Volume K Unit Forecast, by Country 2019 & 2032
- Table 151: Brazil Lateral Flow Assays Market Revenue (Million) Forecast, by Application 2019 & 2032
- Table 152: Brazil Lateral Flow Assays Market Volume (K Unit) Forecast, by Application 2019 & 2032
- Table 153: Argentina Lateral Flow Assays Market Revenue (Million) Forecast, by Application 2019 & 2032
- Table 154: Argentina Lateral Flow Assays Market Volume (K Unit) Forecast, by Application 2019 & 2032
- Table 155: Rest of South America Lateral Flow Assays Market Revenue (Million) Forecast, by Application 2019 & 2032
- Table 156: Rest of South America Lateral Flow Assays Market Volume (K Unit) Forecast, by Application 2019 & 2032
Frequently Asked Questions
1. What is the projected Compound Annual Growth Rate (CAGR) of the Lateral Flow Assays Market?
The projected CAGR is approximately 5.65%.
2. Which companies are prominent players in the Lateral Flow Assays Market?
Key companies in the market include Becton Dickinson and Company, Quidel Corporation, Bio-Rad Laboratories Inc, QIAGEN NV, Merck KGaA, Hologic Inc, Thermo Fisher Scientific Inc, Siemens AG, Abbott Laboratories (Alere Inc ), Abcam PLC, Danaher Corporation, F Hoffmann-La Roche AG, bioMerieux SA, PerkinElmer Inc, Chembio Diagnostic Systems Inc .
3. What are the main segments of the Lateral Flow Assays Market?
The market segments include Application, Technique, Product, End User.
4. Can you provide details about the market size?
The market size is estimated to be USD 10.46 Million as of 2022.
5. What are some drivers contributing to market growth?
Increased Demand for Point-of-care Testing with Technological Advancements; Rise in Adoption of Home-based Devices. along with Global Incidence of Infectious Diseases.
6. What are the notable trends driving market growth?
The Clinical Testing Segment is Expected to Hold the Largest Market Share in the Lateral Flow Assay Market.
7. Are there any restraints impacting market growth?
Stringent and Tedious Regulatory Framework that Delays the Approval of Products; Risk of False Results and Reluctance Toward these Products among the People in Emerging Nations.
8. Can you provide examples of recent developments in the market?
In December 2021, Eurofins Technologies launched its RapidScan ST5-W lateral flow reader, which is built for field and in-process testing applications requiring qualitative to semi-quantitative test results.
9. What pricing options are available for accessing the report?
Pricing options include single-user, multi-user, and enterprise licenses priced at USD 4750, USD 5250, and USD 8750 respectively.
10. Is the market size provided in terms of value or volume?
The market size is provided in terms of value, measured in Million and volume, measured in K Unit.
11. Are there any specific market keywords associated with the report?
Yes, the market keyword associated with the report is "Lateral Flow Assays Market," which aids in identifying and referencing the specific market segment covered.
12. How do I determine which pricing option suits my needs best?
The pricing options vary based on user requirements and access needs. Individual users may opt for single-user licenses, while businesses requiring broader access may choose multi-user or enterprise licenses for cost-effective access to the report.
13. Are there any additional resources or data provided in the Lateral Flow Assays Market report?
While the report offers comprehensive insights, it's advisable to review the specific contents or supplementary materials provided to ascertain if additional resources or data are available.
14. How can I stay updated on further developments or reports in the Lateral Flow Assays Market?
To stay informed about further developments, trends, and reports in the Lateral Flow Assays Market, consider subscribing to industry newsletters, following relevant companies and organizations, or regularly checking reputable industry news sources and publications.
Methodology
Step 1 - Identification of Relevant Samples Size from Population Database


Step 2 - Approaches for Defining Global Market Size (Value, Volume* & Price*)

Note*: In applicable scenarios
Step 3 - Data Sources
Primary Research
- Web Analytics
- Survey Reports
- Research Institute
- Latest Research Reports
- Opinion Leaders
Secondary Research
- Annual Reports
- White Paper
- Latest Press Release
- Industry Association
- Paid Database
- Investor Presentations

Step 4 - Data Triangulation
Involves using different sources of information in order to increase the validity of a study
These sources are likely to be stakeholders in a program - participants, other researchers, program staff, other community members, and so on.
Then we put all data in single framework & apply various statistical tools to find out the dynamic on the market.
During the analysis stage, feedback from the stakeholder groups would be compared to determine areas of agreement as well as areas of divergence


