
Key Insights
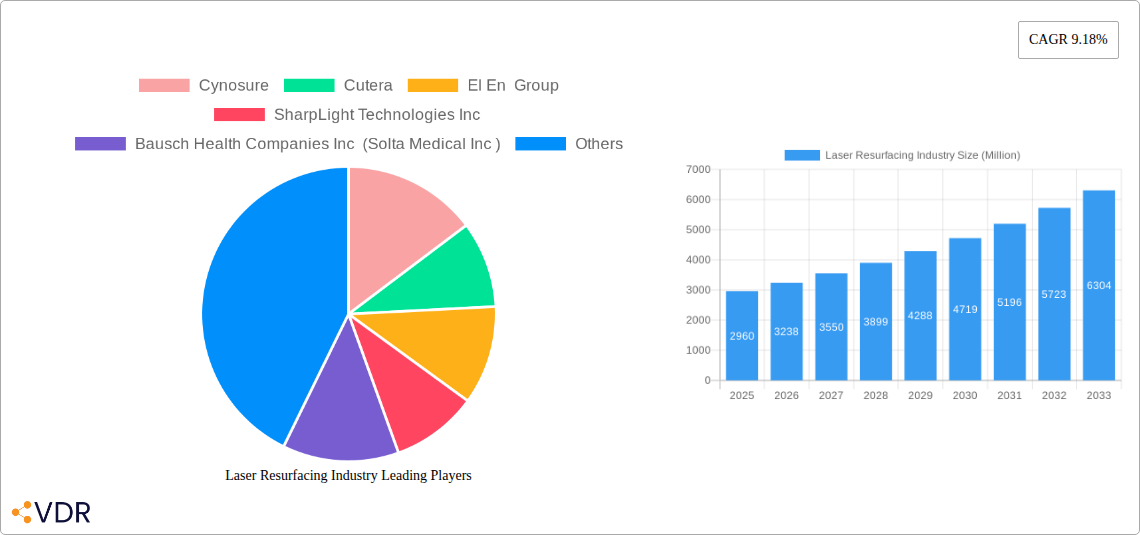
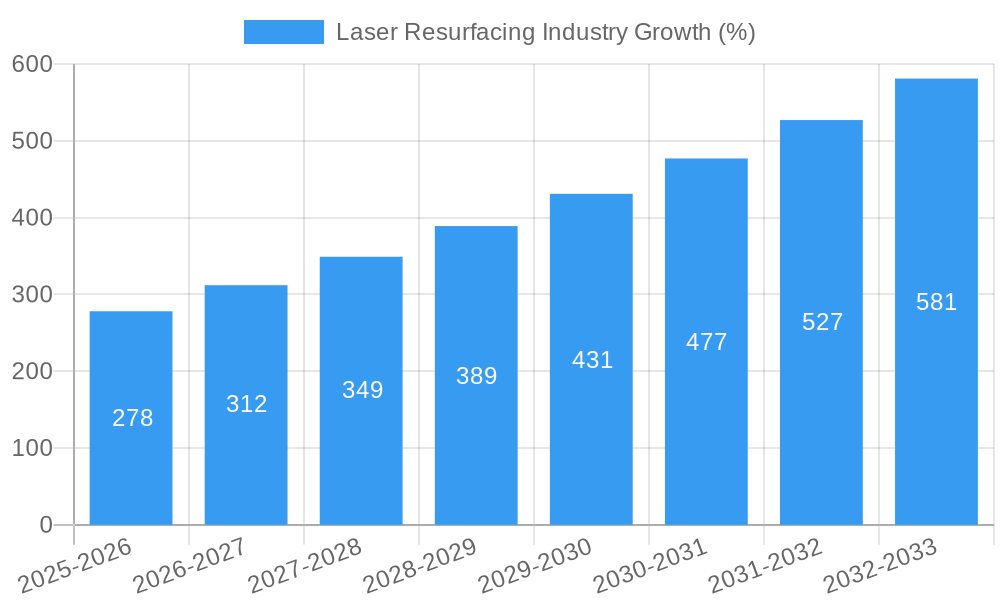
The global laser skin resurfacing market, valued at $2.96 billion in 2025, is projected to experience robust growth, driven by a compound annual growth rate (CAGR) of 9.18% from 2025 to 2033. This expansion is fueled by several key factors. Firstly, the increasing prevalence of skin aging concerns, acne scarring, and other dermatological conditions is boosting demand for effective non-invasive treatments. Laser resurfacing offers a precise and relatively quick solution compared to traditional surgical methods, making it increasingly popular among both medical professionals and consumers. Secondly, technological advancements leading to the development of more sophisticated laser systems with enhanced precision, reduced downtime, and improved efficacy are driving market growth. The introduction of minimally invasive procedures and combination therapies further contributes to the market's expansion. Finally, the rising disposable incomes in developing economies and increasing awareness about aesthetic treatments are expanding the market's reach geographically. Specific application segments such as skin rejuvenation and hair removal are experiencing particularly strong growth, while the end-user segment dominated by clinics and hospitals is showing consistent expansion driven by professional adoption of these technologies.
However, market growth is not without challenges. High treatment costs can limit accessibility for a substantial portion of the population, particularly in regions with limited healthcare infrastructure. Furthermore, potential side effects associated with laser treatments, such as scarring or hyperpigmentation, present a restraint. Regulatory hurdles and the need for skilled professionals to operate the equipment also impact market expansion. Despite these challenges, the overall outlook remains positive, with continued innovation and the growing focus on minimally invasive aesthetic procedures expected to fuel market growth significantly throughout the forecast period. Competition among established players like Cynosure, Cutera, and others is likely to intensify as they invest in research and development to enhance their offerings and expand their market share.
Laser Resurfacing Industry Market Report: 2019-2033
This comprehensive report provides an in-depth analysis of the Laser Resurfacing Industry, encompassing market dynamics, growth trends, competitive landscape, and future outlook. The study period covers 2019-2033, with 2025 as the base year and a forecast period of 2025-2033. The report offers valuable insights for industry professionals, investors, and stakeholders seeking to understand and capitalize on opportunities within this dynamic sector. The market is segmented by Type (Ablative Laser, Erbium Laser, Non-Ablative Laser), Application (Skin resurfacing/Skin rejuvenation, Hair Removal, Acne and scars, Tattoo removal, Treatment of vascular lesions, Other Applications), and End-User (Spas and Beauty Centres, Clinics and Hospitals). Key players analyzed include Cynosure, Cutera, El En Group, SharpLight Technologies Inc, Bausch Health Companies Inc (Solta Medical Inc), Lumenis, IRIDEX Corp, Alma Lasers, Candela Medical, Jeisys Corporation, Aerolase Corp, and Sciton Inc. The global market size is estimated at xx Million in 2025.
Laser Resurfacing Industry Market Dynamics & Structure
The Laser Resurfacing market is characterized by moderate concentration, with several key players holding significant market share. Technological innovation, particularly in laser technology and treatment protocols, is a major driver. Regulatory frameworks, varying across regions, impact market access and product approvals. Competitive substitutes include other aesthetic procedures and treatments. The end-user demographic is expanding, driven by increasing disposable incomes and awareness of aesthetic treatments. M&A activity has been moderate, with xx deals recorded in the past five years, primarily focused on consolidating market share and expanding product portfolios.
- Market Concentration: Moderately concentrated, with top 5 players holding approximately xx% market share in 2025.
- Technological Innovation: Key drivers include advancements in laser technology (e.g., wavelength specificity, pulse duration), minimally invasive procedures, and personalized treatments.
- Regulatory Landscape: Varying approvals and regulations across geographies create both opportunities and challenges for market entry and expansion.
- Competitive Substitutes: Chemical peels, microdermabrasion, and fillers pose competition.
- End-User Demographics: Growing middle class and increased consumer awareness are key demographic drivers.
- M&A Activity: xx M&A deals recorded between 2020-2025, primarily driven by consolidation efforts.
Laser Resurfacing Industry Growth Trends & Insights
The Laser Resurfacing market experienced robust growth during the historical period (2019-2024), with a CAGR of xx%. This growth is expected to continue during the forecast period (2025-2033), albeit at a slightly moderated pace, with a projected CAGR of xx%. Market penetration is increasing, particularly in emerging markets, driven by factors such as rising disposable incomes, increasing awareness of aesthetic treatments, and technological advancements resulting in improved treatment outcomes and reduced downtime. The market is also witnessing a shift towards minimally invasive procedures, fueled by patient preference for less invasive options with faster recovery times. Technological disruptions, like the development of novel laser technologies and AI-powered treatment planning, further contribute to growth.
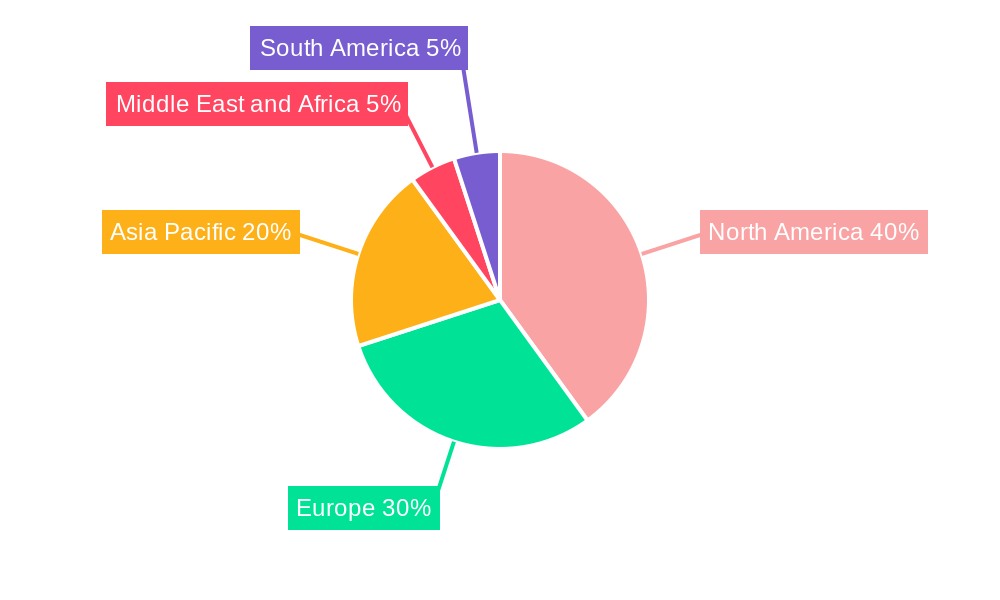
Dominant Regions, Countries, or Segments in Laser Resurfacing Industry
North America currently dominates the Laser Resurfacing market, holding the largest market share in 2025 (approximately xx%), driven by high adoption rates, advanced healthcare infrastructure, and significant investments in aesthetic procedures. Europe follows as the second-largest market, exhibiting steady growth driven by increasing demand for non-invasive cosmetic treatments and rising disposable incomes. Within application segments, skin resurfacing and rejuvenation represent the largest segment, followed by hair removal. Clinics and hospitals constitute the largest end-user segment due to their advanced technology and experienced professionals.
- Key Drivers in North America: High disposable incomes, advanced healthcare infrastructure, and strong regulatory frameworks.
- Key Drivers in Europe: Growing awareness of aesthetic treatments and rising disposable incomes across several European countries.
- Leading Application Segment: Skin resurfacing/rejuvenation, driven by high demand and effective treatment outcomes.
- Leading End-User Segment: Clinics and hospitals, due to their advanced technology and trained professionals.
Laser Resurfacing Industry Product Landscape
The market offers a wide array of laser resurfacing systems, each with unique selling propositions. These range from ablative lasers, offering aggressive skin resurfacing, to non-ablative lasers, providing gentler treatments with minimal downtime. Technological advancements focus on improving wavelength specificity, pulse duration, and cooling mechanisms to optimize treatment efficacy and patient comfort. Recent innovations include handheld devices and AI-powered treatment planning systems, enhancing the accessibility and personalization of treatments.
Key Drivers, Barriers & Challenges in Laser Resurfacing Industry
Key Drivers:
- Rising disposable incomes and increased consumer awareness.
- Technological advancements leading to improved treatment efficacy and reduced downtime.
- Growing demand for minimally invasive procedures.
Key Challenges and Restraints:
- High initial investment costs for equipment.
- Stringent regulatory requirements for approvals and market access.
- Competition from alternative aesthetic procedures and treatments.
- Supply chain disruptions and component shortages, potentially leading to xx% increase in production costs (estimated).
Emerging Opportunities in Laser Resurfacing Industry
Untapped markets in emerging economies present significant opportunities. The development of personalized and AI-driven treatment protocols offers potential for improved outcomes and patient satisfaction. Furthermore, innovative applications of laser resurfacing, such as treating specific skin conditions and expanding into new therapeutic areas, are driving growth. Increasing consumer preference for non-invasive procedures with minimal downtime provides further opportunities.
Growth Accelerators in the Laser Resurfacing Industry
Technological breakthroughs, such as the development of advanced laser technologies and AI-driven systems, will accelerate market growth. Strategic partnerships between manufacturers and healthcare providers will expand market access and improve treatment accessibility. Market expansion strategies, focusing on untapped markets in developing economies, will further fuel growth. These combined factors are expected to drive significant market expansion during the forecast period.
Key Players Shaping the Laser Resurfacing Industry Market
- Cynosure
- Cutera
- El En Group
- SharpLight Technologies Inc
- Bausch Health Companies Inc (Solta Medical Inc)
- Lumenis
- IRIDEX Corp
- Alma Lasers
- Candela Medical
- Jeisys Corporation
- Aerolase Corp
- Sciton Inc
Notable Milestones in Laser Resurfacing Industry Sector
- March 2021: Solta Medical announced the U.S. launch of the Clear + Brilliant Touch Laser.
- March 2022: The US FDA approved AviClear, a laser treatment for acne.
- October 2022: Sensus Healthcare launched its portable Silk by Sensus hair removal laser system.
In-Depth Laser Resurfacing Industry Market Outlook
The Laser Resurfacing market is poised for sustained growth, driven by technological advancements, expanding applications, and increasing consumer demand. Strategic partnerships, investments in R&D, and market expansion into emerging economies will shape the future landscape. The continued development of minimally invasive, effective, and safe treatments will be key to capturing significant market share and driving long-term growth potential. The market is expected to reach xx Million by 2033, indicating substantial opportunities for key players and new entrants.
Laser Resurfacing Industry Segmentation
-
1. Type
-
1.1. Ablative Laser
- 1.1.1. Carbon Dioxide Laser (CO2)
- 1.1.2. Erbium Laser
-
1.2. Non-Ablative Laser
- 1.2.1. Pulsed-Dye Laser (PDL)
- 1.2.2. Nd:Yag Laser
- 1.2.3. Alexandrite Laser
-
1.1. Ablative Laser
-
2. Application
- 2.1. Skin resurfacing/Skin rejuvenation
- 2.2. Hair Removal
- 2.3. Acne and scars
- 2.4. Tattoo removal
- 2.5. Treatment of vascular lesions
- 2.6. Other Applications
-
3. End-User
- 3.1. Spas and Beauty Centres
- 3.2. Clinics and Hospitals
Laser Resurfacing Industry Segmentation By Geography
-
1. North America
- 1.1. United States
- 1.2. Canada
- 1.3. Mexico
-
2. Europe
- 2.1. Germany
- 2.2. United Kingdom
- 2.3. France
- 2.4. Italy
- 2.5. Spain
- 2.6. Rest of Europe
-
3. Asia Pacific
- 3.1. China
- 3.2. Japan
- 3.3. India
- 3.4. Australia
- 3.5. South Korea
- 3.6. Rest of Asia Pacific
-
4. Middle East and Africa
- 4.1. GCC
- 4.2. South Africa
- 4.3. Rest of Middle East and Africa
-
5. South America
- 5.1. Brazil
- 5.2. Argentina
- 5.3. Rest of South America
Laser Resurfacing Industry REPORT HIGHLIGHTS
| Aspects | Details |
|---|---|
| Study Period | 2019-2033 |
| Base Year | 2024 |
| Estimated Year | 2025 |
| Forecast Period | 2025-2033 |
| Historical Period | 2019-2024 |
| Growth Rate | CAGR of 9.18% from 2019-2033 |
| Segmentation |
|
Table of Contents
- 1. Introduction
- 1.1. Research Scope
- 1.2. Market Segmentation
- 1.3. Research Methodology
- 1.4. Definitions and Assumptions
- 2. Executive Summary
- 2.1. Introduction
- 3. Market Dynamics
- 3.1. Introduction
- 3.2. Market Drivers
- 3.2.1. Increasing Demand for Non-Invasive Aesthetic Procedures; Growing Technological Advancements; Changing Lifestyle and Growing Disposable Income
- 3.3. Market Restrains
- 3.3.1. Social Stigma Associated With Cosmetic Treatments; High Cost of the Procedures
- 3.4. Market Trends
- 3.4.1. Hair Removal Segment Holds Significant Market Share and is Expected to Continue the Same Trend Over the Forecast Period
- 4. Market Factor Analysis
- 4.1. Porters Five Forces
- 4.2. Supply/Value Chain
- 4.3. PESTEL analysis
- 4.4. Market Entropy
- 4.5. Patent/Trademark Analysis
- 5. Global Laser Resurfacing Industry Analysis, Insights and Forecast, 2019-2031
- 5.1. Market Analysis, Insights and Forecast - by Type
- 5.1.1. Ablative Laser
- 5.1.1.1. Carbon Dioxide Laser (CO2)
- 5.1.1.2. Erbium Laser
- 5.1.2. Non-Ablative Laser
- 5.1.2.1. Pulsed-Dye Laser (PDL)
- 5.1.2.2. Nd:Yag Laser
- 5.1.2.3. Alexandrite Laser
- 5.1.1. Ablative Laser
- 5.2. Market Analysis, Insights and Forecast - by Application
- 5.2.1. Skin resurfacing/Skin rejuvenation
- 5.2.2. Hair Removal
- 5.2.3. Acne and scars
- 5.2.4. Tattoo removal
- 5.2.5. Treatment of vascular lesions
- 5.2.6. Other Applications
- 5.3. Market Analysis, Insights and Forecast - by End-User
- 5.3.1. Spas and Beauty Centres
- 5.3.2. Clinics and Hospitals
- 5.4. Market Analysis, Insights and Forecast - by Region
- 5.4.1. North America
- 5.4.2. Europe
- 5.4.3. Asia Pacific
- 5.4.4. Middle East and Africa
- 5.4.5. South America
- 5.1. Market Analysis, Insights and Forecast - by Type
- 6. North America Laser Resurfacing Industry Analysis, Insights and Forecast, 2019-2031
- 6.1. Market Analysis, Insights and Forecast - by Type
- 6.1.1. Ablative Laser
- 6.1.1.1. Carbon Dioxide Laser (CO2)
- 6.1.1.2. Erbium Laser
- 6.1.2. Non-Ablative Laser
- 6.1.2.1. Pulsed-Dye Laser (PDL)
- 6.1.2.2. Nd:Yag Laser
- 6.1.2.3. Alexandrite Laser
- 6.1.1. Ablative Laser
- 6.2. Market Analysis, Insights and Forecast - by Application
- 6.2.1. Skin resurfacing/Skin rejuvenation
- 6.2.2. Hair Removal
- 6.2.3. Acne and scars
- 6.2.4. Tattoo removal
- 6.2.5. Treatment of vascular lesions
- 6.2.6. Other Applications
- 6.3. Market Analysis, Insights and Forecast - by End-User
- 6.3.1. Spas and Beauty Centres
- 6.3.2. Clinics and Hospitals
- 6.1. Market Analysis, Insights and Forecast - by Type
- 7. Europe Laser Resurfacing Industry Analysis, Insights and Forecast, 2019-2031
- 7.1. Market Analysis, Insights and Forecast - by Type
- 7.1.1. Ablative Laser
- 7.1.1.1. Carbon Dioxide Laser (CO2)
- 7.1.1.2. Erbium Laser
- 7.1.2. Non-Ablative Laser
- 7.1.2.1. Pulsed-Dye Laser (PDL)
- 7.1.2.2. Nd:Yag Laser
- 7.1.2.3. Alexandrite Laser
- 7.1.1. Ablative Laser
- 7.2. Market Analysis, Insights and Forecast - by Application
- 7.2.1. Skin resurfacing/Skin rejuvenation
- 7.2.2. Hair Removal
- 7.2.3. Acne and scars
- 7.2.4. Tattoo removal
- 7.2.5. Treatment of vascular lesions
- 7.2.6. Other Applications
- 7.3. Market Analysis, Insights and Forecast - by End-User
- 7.3.1. Spas and Beauty Centres
- 7.3.2. Clinics and Hospitals
- 7.1. Market Analysis, Insights and Forecast - by Type
- 8. Asia Pacific Laser Resurfacing Industry Analysis, Insights and Forecast, 2019-2031
- 8.1. Market Analysis, Insights and Forecast - by Type
- 8.1.1. Ablative Laser
- 8.1.1.1. Carbon Dioxide Laser (CO2)
- 8.1.1.2. Erbium Laser
- 8.1.2. Non-Ablative Laser
- 8.1.2.1. Pulsed-Dye Laser (PDL)
- 8.1.2.2. Nd:Yag Laser
- 8.1.2.3. Alexandrite Laser
- 8.1.1. Ablative Laser
- 8.2. Market Analysis, Insights and Forecast - by Application
- 8.2.1. Skin resurfacing/Skin rejuvenation
- 8.2.2. Hair Removal
- 8.2.3. Acne and scars
- 8.2.4. Tattoo removal
- 8.2.5. Treatment of vascular lesions
- 8.2.6. Other Applications
- 8.3. Market Analysis, Insights and Forecast - by End-User
- 8.3.1. Spas and Beauty Centres
- 8.3.2. Clinics and Hospitals
- 8.1. Market Analysis, Insights and Forecast - by Type
- 9. Middle East and Africa Laser Resurfacing Industry Analysis, Insights and Forecast, 2019-2031
- 9.1. Market Analysis, Insights and Forecast - by Type
- 9.1.1. Ablative Laser
- 9.1.1.1. Carbon Dioxide Laser (CO2)
- 9.1.1.2. Erbium Laser
- 9.1.2. Non-Ablative Laser
- 9.1.2.1. Pulsed-Dye Laser (PDL)
- 9.1.2.2. Nd:Yag Laser
- 9.1.2.3. Alexandrite Laser
- 9.1.1. Ablative Laser
- 9.2. Market Analysis, Insights and Forecast - by Application
- 9.2.1. Skin resurfacing/Skin rejuvenation
- 9.2.2. Hair Removal
- 9.2.3. Acne and scars
- 9.2.4. Tattoo removal
- 9.2.5. Treatment of vascular lesions
- 9.2.6. Other Applications
- 9.3. Market Analysis, Insights and Forecast - by End-User
- 9.3.1. Spas and Beauty Centres
- 9.3.2. Clinics and Hospitals
- 9.1. Market Analysis, Insights and Forecast - by Type
- 10. South America Laser Resurfacing Industry Analysis, Insights and Forecast, 2019-2031
- 10.1. Market Analysis, Insights and Forecast - by Type
- 10.1.1. Ablative Laser
- 10.1.1.1. Carbon Dioxide Laser (CO2)
- 10.1.1.2. Erbium Laser
- 10.1.2. Non-Ablative Laser
- 10.1.2.1. Pulsed-Dye Laser (PDL)
- 10.1.2.2. Nd:Yag Laser
- 10.1.2.3. Alexandrite Laser
- 10.1.1. Ablative Laser
- 10.2. Market Analysis, Insights and Forecast - by Application
- 10.2.1. Skin resurfacing/Skin rejuvenation
- 10.2.2. Hair Removal
- 10.2.3. Acne and scars
- 10.2.4. Tattoo removal
- 10.2.5. Treatment of vascular lesions
- 10.2.6. Other Applications
- 10.3. Market Analysis, Insights and Forecast - by End-User
- 10.3.1. Spas and Beauty Centres
- 10.3.2. Clinics and Hospitals
- 10.1. Market Analysis, Insights and Forecast - by Type
- 11. North America Laser Resurfacing Industry Analysis, Insights and Forecast, 2019-2031
- 11.1. Market Analysis, Insights and Forecast - By Country/Sub-region
- 11.1.1 United States
- 11.1.2 Canada
- 11.1.3 Mexico
- 12. Europe Laser Resurfacing Industry Analysis, Insights and Forecast, 2019-2031
- 12.1. Market Analysis, Insights and Forecast - By Country/Sub-region
- 12.1.1 Germany
- 12.1.2 United Kingdom
- 12.1.3 France
- 12.1.4 Italy
- 12.1.5 Spain
- 12.1.6 Rest of Europe
- 13. Asia Pacific Laser Resurfacing Industry Analysis, Insights and Forecast, 2019-2031
- 13.1. Market Analysis, Insights and Forecast - By Country/Sub-region
- 13.1.1 China
- 13.1.2 Japan
- 13.1.3 India
- 13.1.4 Australia
- 13.1.5 South Korea
- 13.1.6 Rest of Asia Pacific
- 14. Middle East and Africa Laser Resurfacing Industry Analysis, Insights and Forecast, 2019-2031
- 14.1. Market Analysis, Insights and Forecast - By Country/Sub-region
- 14.1.1 GCC
- 14.1.2 South Africa
- 14.1.3 Rest of Middle East and Africa
- 15. South America Laser Resurfacing Industry Analysis, Insights and Forecast, 2019-2031
- 15.1. Market Analysis, Insights and Forecast - By Country/Sub-region
- 15.1.1 Brazil
- 15.1.2 Argentina
- 15.1.3 Rest of South America
- 16. Competitive Analysis
- 16.1. Global Market Share Analysis 2024
- 16.2. Company Profiles
- 16.2.1 Cynosure
- 16.2.1.1. Overview
- 16.2.1.2. Products
- 16.2.1.3. SWOT Analysis
- 16.2.1.4. Recent Developments
- 16.2.1.5. Financials (Based on Availability)
- 16.2.2 Cutera
- 16.2.2.1. Overview
- 16.2.2.2. Products
- 16.2.2.3. SWOT Analysis
- 16.2.2.4. Recent Developments
- 16.2.2.5. Financials (Based on Availability)
- 16.2.3 El En Group
- 16.2.3.1. Overview
- 16.2.3.2. Products
- 16.2.3.3. SWOT Analysis
- 16.2.3.4. Recent Developments
- 16.2.3.5. Financials (Based on Availability)
- 16.2.4 SharpLight Technologies Inc
- 16.2.4.1. Overview
- 16.2.4.2. Products
- 16.2.4.3. SWOT Analysis
- 16.2.4.4. Recent Developments
- 16.2.4.5. Financials (Based on Availability)
- 16.2.5 Bausch Health Companies Inc (Solta Medical Inc )
- 16.2.5.1. Overview
- 16.2.5.2. Products
- 16.2.5.3. SWOT Analysis
- 16.2.5.4. Recent Developments
- 16.2.5.5. Financials (Based on Availability)
- 16.2.6 Lumenis
- 16.2.6.1. Overview
- 16.2.6.2. Products
- 16.2.6.3. SWOT Analysis
- 16.2.6.4. Recent Developments
- 16.2.6.5. Financials (Based on Availability)
- 16.2.7 IRIDEX Corp
- 16.2.7.1. Overview
- 16.2.7.2. Products
- 16.2.7.3. SWOT Analysis
- 16.2.7.4. Recent Developments
- 16.2.7.5. Financials (Based on Availability)
- 16.2.8 Alma Lasers
- 16.2.8.1. Overview
- 16.2.8.2. Products
- 16.2.8.3. SWOT Analysis
- 16.2.8.4. Recent Developments
- 16.2.8.5. Financials (Based on Availability)
- 16.2.9 Candela Medical
- 16.2.9.1. Overview
- 16.2.9.2. Products
- 16.2.9.3. SWOT Analysis
- 16.2.9.4. Recent Developments
- 16.2.9.5. Financials (Based on Availability)
- 16.2.10 Jeisys Corporation
- 16.2.10.1. Overview
- 16.2.10.2. Products
- 16.2.10.3. SWOT Analysis
- 16.2.10.4. Recent Developments
- 16.2.10.5. Financials (Based on Availability)
- 16.2.11 Aerolase Corp
- 16.2.11.1. Overview
- 16.2.11.2. Products
- 16.2.11.3. SWOT Analysis
- 16.2.11.4. Recent Developments
- 16.2.11.5. Financials (Based on Availability)
- 16.2.12 Sciton Inc
- 16.2.12.1. Overview
- 16.2.12.2. Products
- 16.2.12.3. SWOT Analysis
- 16.2.12.4. Recent Developments
- 16.2.12.5. Financials (Based on Availability)
- 16.2.1 Cynosure
List of Figures
- Figure 1: Global Laser Resurfacing Industry Revenue Breakdown (Million, %) by Region 2024 & 2032
- Figure 2: Global Laser Resurfacing Industry Volume Breakdown (K Unit, %) by Region 2024 & 2032
- Figure 3: North America Laser Resurfacing Industry Revenue (Million), by Country 2024 & 2032
- Figure 4: North America Laser Resurfacing Industry Volume (K Unit), by Country 2024 & 2032
- Figure 5: North America Laser Resurfacing Industry Revenue Share (%), by Country 2024 & 2032
- Figure 6: North America Laser Resurfacing Industry Volume Share (%), by Country 2024 & 2032
- Figure 7: Europe Laser Resurfacing Industry Revenue (Million), by Country 2024 & 2032
- Figure 8: Europe Laser Resurfacing Industry Volume (K Unit), by Country 2024 & 2032
- Figure 9: Europe Laser Resurfacing Industry Revenue Share (%), by Country 2024 & 2032
- Figure 10: Europe Laser Resurfacing Industry Volume Share (%), by Country 2024 & 2032
- Figure 11: Asia Pacific Laser Resurfacing Industry Revenue (Million), by Country 2024 & 2032
- Figure 12: Asia Pacific Laser Resurfacing Industry Volume (K Unit), by Country 2024 & 2032
- Figure 13: Asia Pacific Laser Resurfacing Industry Revenue Share (%), by Country 2024 & 2032
- Figure 14: Asia Pacific Laser Resurfacing Industry Volume Share (%), by Country 2024 & 2032
- Figure 15: Middle East and Africa Laser Resurfacing Industry Revenue (Million), by Country 2024 & 2032
- Figure 16: Middle East and Africa Laser Resurfacing Industry Volume (K Unit), by Country 2024 & 2032
- Figure 17: Middle East and Africa Laser Resurfacing Industry Revenue Share (%), by Country 2024 & 2032
- Figure 18: Middle East and Africa Laser Resurfacing Industry Volume Share (%), by Country 2024 & 2032
- Figure 19: South America Laser Resurfacing Industry Revenue (Million), by Country 2024 & 2032
- Figure 20: South America Laser Resurfacing Industry Volume (K Unit), by Country 2024 & 2032
- Figure 21: South America Laser Resurfacing Industry Revenue Share (%), by Country 2024 & 2032
- Figure 22: South America Laser Resurfacing Industry Volume Share (%), by Country 2024 & 2032
- Figure 23: North America Laser Resurfacing Industry Revenue (Million), by Type 2024 & 2032
- Figure 24: North America Laser Resurfacing Industry Volume (K Unit), by Type 2024 & 2032
- Figure 25: North America Laser Resurfacing Industry Revenue Share (%), by Type 2024 & 2032
- Figure 26: North America Laser Resurfacing Industry Volume Share (%), by Type 2024 & 2032
- Figure 27: North America Laser Resurfacing Industry Revenue (Million), by Application 2024 & 2032
- Figure 28: North America Laser Resurfacing Industry Volume (K Unit), by Application 2024 & 2032
- Figure 29: North America Laser Resurfacing Industry Revenue Share (%), by Application 2024 & 2032
- Figure 30: North America Laser Resurfacing Industry Volume Share (%), by Application 2024 & 2032
- Figure 31: North America Laser Resurfacing Industry Revenue (Million), by End-User 2024 & 2032
- Figure 32: North America Laser Resurfacing Industry Volume (K Unit), by End-User 2024 & 2032
- Figure 33: North America Laser Resurfacing Industry Revenue Share (%), by End-User 2024 & 2032
- Figure 34: North America Laser Resurfacing Industry Volume Share (%), by End-User 2024 & 2032
- Figure 35: North America Laser Resurfacing Industry Revenue (Million), by Country 2024 & 2032
- Figure 36: North America Laser Resurfacing Industry Volume (K Unit), by Country 2024 & 2032
- Figure 37: North America Laser Resurfacing Industry Revenue Share (%), by Country 2024 & 2032
- Figure 38: North America Laser Resurfacing Industry Volume Share (%), by Country 2024 & 2032
- Figure 39: Europe Laser Resurfacing Industry Revenue (Million), by Type 2024 & 2032
- Figure 40: Europe Laser Resurfacing Industry Volume (K Unit), by Type 2024 & 2032
- Figure 41: Europe Laser Resurfacing Industry Revenue Share (%), by Type 2024 & 2032
- Figure 42: Europe Laser Resurfacing Industry Volume Share (%), by Type 2024 & 2032
- Figure 43: Europe Laser Resurfacing Industry Revenue (Million), by Application 2024 & 2032
- Figure 44: Europe Laser Resurfacing Industry Volume (K Unit), by Application 2024 & 2032
- Figure 45: Europe Laser Resurfacing Industry Revenue Share (%), by Application 2024 & 2032
- Figure 46: Europe Laser Resurfacing Industry Volume Share (%), by Application 2024 & 2032
- Figure 47: Europe Laser Resurfacing Industry Revenue (Million), by End-User 2024 & 2032
- Figure 48: Europe Laser Resurfacing Industry Volume (K Unit), by End-User 2024 & 2032
- Figure 49: Europe Laser Resurfacing Industry Revenue Share (%), by End-User 2024 & 2032
- Figure 50: Europe Laser Resurfacing Industry Volume Share (%), by End-User 2024 & 2032
- Figure 51: Europe Laser Resurfacing Industry Revenue (Million), by Country 2024 & 2032
- Figure 52: Europe Laser Resurfacing Industry Volume (K Unit), by Country 2024 & 2032
- Figure 53: Europe Laser Resurfacing Industry Revenue Share (%), by Country 2024 & 2032
- Figure 54: Europe Laser Resurfacing Industry Volume Share (%), by Country 2024 & 2032
- Figure 55: Asia Pacific Laser Resurfacing Industry Revenue (Million), by Type 2024 & 2032
- Figure 56: Asia Pacific Laser Resurfacing Industry Volume (K Unit), by Type 2024 & 2032
- Figure 57: Asia Pacific Laser Resurfacing Industry Revenue Share (%), by Type 2024 & 2032
- Figure 58: Asia Pacific Laser Resurfacing Industry Volume Share (%), by Type 2024 & 2032
- Figure 59: Asia Pacific Laser Resurfacing Industry Revenue (Million), by Application 2024 & 2032
- Figure 60: Asia Pacific Laser Resurfacing Industry Volume (K Unit), by Application 2024 & 2032
- Figure 61: Asia Pacific Laser Resurfacing Industry Revenue Share (%), by Application 2024 & 2032
- Figure 62: Asia Pacific Laser Resurfacing Industry Volume Share (%), by Application 2024 & 2032
- Figure 63: Asia Pacific Laser Resurfacing Industry Revenue (Million), by End-User 2024 & 2032
- Figure 64: Asia Pacific Laser Resurfacing Industry Volume (K Unit), by End-User 2024 & 2032
- Figure 65: Asia Pacific Laser Resurfacing Industry Revenue Share (%), by End-User 2024 & 2032
- Figure 66: Asia Pacific Laser Resurfacing Industry Volume Share (%), by End-User 2024 & 2032
- Figure 67: Asia Pacific Laser Resurfacing Industry Revenue (Million), by Country 2024 & 2032
- Figure 68: Asia Pacific Laser Resurfacing Industry Volume (K Unit), by Country 2024 & 2032
- Figure 69: Asia Pacific Laser Resurfacing Industry Revenue Share (%), by Country 2024 & 2032
- Figure 70: Asia Pacific Laser Resurfacing Industry Volume Share (%), by Country 2024 & 2032
- Figure 71: Middle East and Africa Laser Resurfacing Industry Revenue (Million), by Type 2024 & 2032
- Figure 72: Middle East and Africa Laser Resurfacing Industry Volume (K Unit), by Type 2024 & 2032
- Figure 73: Middle East and Africa Laser Resurfacing Industry Revenue Share (%), by Type 2024 & 2032
- Figure 74: Middle East and Africa Laser Resurfacing Industry Volume Share (%), by Type 2024 & 2032
- Figure 75: Middle East and Africa Laser Resurfacing Industry Revenue (Million), by Application 2024 & 2032
- Figure 76: Middle East and Africa Laser Resurfacing Industry Volume (K Unit), by Application 2024 & 2032
- Figure 77: Middle East and Africa Laser Resurfacing Industry Revenue Share (%), by Application 2024 & 2032
- Figure 78: Middle East and Africa Laser Resurfacing Industry Volume Share (%), by Application 2024 & 2032
- Figure 79: Middle East and Africa Laser Resurfacing Industry Revenue (Million), by End-User 2024 & 2032
- Figure 80: Middle East and Africa Laser Resurfacing Industry Volume (K Unit), by End-User 2024 & 2032
- Figure 81: Middle East and Africa Laser Resurfacing Industry Revenue Share (%), by End-User 2024 & 2032
- Figure 82: Middle East and Africa Laser Resurfacing Industry Volume Share (%), by End-User 2024 & 2032
- Figure 83: Middle East and Africa Laser Resurfacing Industry Revenue (Million), by Country 2024 & 2032
- Figure 84: Middle East and Africa Laser Resurfacing Industry Volume (K Unit), by Country 2024 & 2032
- Figure 85: Middle East and Africa Laser Resurfacing Industry Revenue Share (%), by Country 2024 & 2032
- Figure 86: Middle East and Africa Laser Resurfacing Industry Volume Share (%), by Country 2024 & 2032
- Figure 87: South America Laser Resurfacing Industry Revenue (Million), by Type 2024 & 2032
- Figure 88: South America Laser Resurfacing Industry Volume (K Unit), by Type 2024 & 2032
- Figure 89: South America Laser Resurfacing Industry Revenue Share (%), by Type 2024 & 2032
- Figure 90: South America Laser Resurfacing Industry Volume Share (%), by Type 2024 & 2032
- Figure 91: South America Laser Resurfacing Industry Revenue (Million), by Application 2024 & 2032
- Figure 92: South America Laser Resurfacing Industry Volume (K Unit), by Application 2024 & 2032
- Figure 93: South America Laser Resurfacing Industry Revenue Share (%), by Application 2024 & 2032
- Figure 94: South America Laser Resurfacing Industry Volume Share (%), by Application 2024 & 2032
- Figure 95: South America Laser Resurfacing Industry Revenue (Million), by End-User 2024 & 2032
- Figure 96: South America Laser Resurfacing Industry Volume (K Unit), by End-User 2024 & 2032
- Figure 97: South America Laser Resurfacing Industry Revenue Share (%), by End-User 2024 & 2032
- Figure 98: South America Laser Resurfacing Industry Volume Share (%), by End-User 2024 & 2032
- Figure 99: South America Laser Resurfacing Industry Revenue (Million), by Country 2024 & 2032
- Figure 100: South America Laser Resurfacing Industry Volume (K Unit), by Country 2024 & 2032
- Figure 101: South America Laser Resurfacing Industry Revenue Share (%), by Country 2024 & 2032
- Figure 102: South America Laser Resurfacing Industry Volume Share (%), by Country 2024 & 2032
List of Tables
- Table 1: Global Laser Resurfacing Industry Revenue Million Forecast, by Region 2019 & 2032
- Table 2: Global Laser Resurfacing Industry Volume K Unit Forecast, by Region 2019 & 2032
- Table 3: Global Laser Resurfacing Industry Revenue Million Forecast, by Type 2019 & 2032
- Table 4: Global Laser Resurfacing Industry Volume K Unit Forecast, by Type 2019 & 2032
- Table 5: Global Laser Resurfacing Industry Revenue Million Forecast, by Application 2019 & 2032
- Table 6: Global Laser Resurfacing Industry Volume K Unit Forecast, by Application 2019 & 2032
- Table 7: Global Laser Resurfacing Industry Revenue Million Forecast, by End-User 2019 & 2032
- Table 8: Global Laser Resurfacing Industry Volume K Unit Forecast, by End-User 2019 & 2032
- Table 9: Global Laser Resurfacing Industry Revenue Million Forecast, by Region 2019 & 2032
- Table 10: Global Laser Resurfacing Industry Volume K Unit Forecast, by Region 2019 & 2032
- Table 11: Global Laser Resurfacing Industry Revenue Million Forecast, by Country 2019 & 2032
- Table 12: Global Laser Resurfacing Industry Volume K Unit Forecast, by Country 2019 & 2032
- Table 13: United States Laser Resurfacing Industry Revenue (Million) Forecast, by Application 2019 & 2032
- Table 14: United States Laser Resurfacing Industry Volume (K Unit) Forecast, by Application 2019 & 2032
- Table 15: Canada Laser Resurfacing Industry Revenue (Million) Forecast, by Application 2019 & 2032
- Table 16: Canada Laser Resurfacing Industry Volume (K Unit) Forecast, by Application 2019 & 2032
- Table 17: Mexico Laser Resurfacing Industry Revenue (Million) Forecast, by Application 2019 & 2032
- Table 18: Mexico Laser Resurfacing Industry Volume (K Unit) Forecast, by Application 2019 & 2032
- Table 19: Global Laser Resurfacing Industry Revenue Million Forecast, by Country 2019 & 2032
- Table 20: Global Laser Resurfacing Industry Volume K Unit Forecast, by Country 2019 & 2032
- Table 21: Germany Laser Resurfacing Industry Revenue (Million) Forecast, by Application 2019 & 2032
- Table 22: Germany Laser Resurfacing Industry Volume (K Unit) Forecast, by Application 2019 & 2032
- Table 23: United Kingdom Laser Resurfacing Industry Revenue (Million) Forecast, by Application 2019 & 2032
- Table 24: United Kingdom Laser Resurfacing Industry Volume (K Unit) Forecast, by Application 2019 & 2032
- Table 25: France Laser Resurfacing Industry Revenue (Million) Forecast, by Application 2019 & 2032
- Table 26: France Laser Resurfacing Industry Volume (K Unit) Forecast, by Application 2019 & 2032
- Table 27: Italy Laser Resurfacing Industry Revenue (Million) Forecast, by Application 2019 & 2032
- Table 28: Italy Laser Resurfacing Industry Volume (K Unit) Forecast, by Application 2019 & 2032
- Table 29: Spain Laser Resurfacing Industry Revenue (Million) Forecast, by Application 2019 & 2032
- Table 30: Spain Laser Resurfacing Industry Volume (K Unit) Forecast, by Application 2019 & 2032
- Table 31: Rest of Europe Laser Resurfacing Industry Revenue (Million) Forecast, by Application 2019 & 2032
- Table 32: Rest of Europe Laser Resurfacing Industry Volume (K Unit) Forecast, by Application 2019 & 2032
- Table 33: Global Laser Resurfacing Industry Revenue Million Forecast, by Country 2019 & 2032
- Table 34: Global Laser Resurfacing Industry Volume K Unit Forecast, by Country 2019 & 2032
- Table 35: China Laser Resurfacing Industry Revenue (Million) Forecast, by Application 2019 & 2032
- Table 36: China Laser Resurfacing Industry Volume (K Unit) Forecast, by Application 2019 & 2032
- Table 37: Japan Laser Resurfacing Industry Revenue (Million) Forecast, by Application 2019 & 2032
- Table 38: Japan Laser Resurfacing Industry Volume (K Unit) Forecast, by Application 2019 & 2032
- Table 39: India Laser Resurfacing Industry Revenue (Million) Forecast, by Application 2019 & 2032
- Table 40: India Laser Resurfacing Industry Volume (K Unit) Forecast, by Application 2019 & 2032
- Table 41: Australia Laser Resurfacing Industry Revenue (Million) Forecast, by Application 2019 & 2032
- Table 42: Australia Laser Resurfacing Industry Volume (K Unit) Forecast, by Application 2019 & 2032
- Table 43: South Korea Laser Resurfacing Industry Revenue (Million) Forecast, by Application 2019 & 2032
- Table 44: South Korea Laser Resurfacing Industry Volume (K Unit) Forecast, by Application 2019 & 2032
- Table 45: Rest of Asia Pacific Laser Resurfacing Industry Revenue (Million) Forecast, by Application 2019 & 2032
- Table 46: Rest of Asia Pacific Laser Resurfacing Industry Volume (K Unit) Forecast, by Application 2019 & 2032
- Table 47: Global Laser Resurfacing Industry Revenue Million Forecast, by Country 2019 & 2032
- Table 48: Global Laser Resurfacing Industry Volume K Unit Forecast, by Country 2019 & 2032
- Table 49: GCC Laser Resurfacing Industry Revenue (Million) Forecast, by Application 2019 & 2032
- Table 50: GCC Laser Resurfacing Industry Volume (K Unit) Forecast, by Application 2019 & 2032
- Table 51: South Africa Laser Resurfacing Industry Revenue (Million) Forecast, by Application 2019 & 2032
- Table 52: South Africa Laser Resurfacing Industry Volume (K Unit) Forecast, by Application 2019 & 2032
- Table 53: Rest of Middle East and Africa Laser Resurfacing Industry Revenue (Million) Forecast, by Application 2019 & 2032
- Table 54: Rest of Middle East and Africa Laser Resurfacing Industry Volume (K Unit) Forecast, by Application 2019 & 2032
- Table 55: Global Laser Resurfacing Industry Revenue Million Forecast, by Country 2019 & 2032
- Table 56: Global Laser Resurfacing Industry Volume K Unit Forecast, by Country 2019 & 2032
- Table 57: Brazil Laser Resurfacing Industry Revenue (Million) Forecast, by Application 2019 & 2032
- Table 58: Brazil Laser Resurfacing Industry Volume (K Unit) Forecast, by Application 2019 & 2032
- Table 59: Argentina Laser Resurfacing Industry Revenue (Million) Forecast, by Application 2019 & 2032
- Table 60: Argentina Laser Resurfacing Industry Volume (K Unit) Forecast, by Application 2019 & 2032
- Table 61: Rest of South America Laser Resurfacing Industry Revenue (Million) Forecast, by Application 2019 & 2032
- Table 62: Rest of South America Laser Resurfacing Industry Volume (K Unit) Forecast, by Application 2019 & 2032
- Table 63: Global Laser Resurfacing Industry Revenue Million Forecast, by Type 2019 & 2032
- Table 64: Global Laser Resurfacing Industry Volume K Unit Forecast, by Type 2019 & 2032
- Table 65: Global Laser Resurfacing Industry Revenue Million Forecast, by Application 2019 & 2032
- Table 66: Global Laser Resurfacing Industry Volume K Unit Forecast, by Application 2019 & 2032
- Table 67: Global Laser Resurfacing Industry Revenue Million Forecast, by End-User 2019 & 2032
- Table 68: Global Laser Resurfacing Industry Volume K Unit Forecast, by End-User 2019 & 2032
- Table 69: Global Laser Resurfacing Industry Revenue Million Forecast, by Country 2019 & 2032
- Table 70: Global Laser Resurfacing Industry Volume K Unit Forecast, by Country 2019 & 2032
- Table 71: United States Laser Resurfacing Industry Revenue (Million) Forecast, by Application 2019 & 2032
- Table 72: United States Laser Resurfacing Industry Volume (K Unit) Forecast, by Application 2019 & 2032
- Table 73: Canada Laser Resurfacing Industry Revenue (Million) Forecast, by Application 2019 & 2032
- Table 74: Canada Laser Resurfacing Industry Volume (K Unit) Forecast, by Application 2019 & 2032
- Table 75: Mexico Laser Resurfacing Industry Revenue (Million) Forecast, by Application 2019 & 2032
- Table 76: Mexico Laser Resurfacing Industry Volume (K Unit) Forecast, by Application 2019 & 2032
- Table 77: Global Laser Resurfacing Industry Revenue Million Forecast, by Type 2019 & 2032
- Table 78: Global Laser Resurfacing Industry Volume K Unit Forecast, by Type 2019 & 2032
- Table 79: Global Laser Resurfacing Industry Revenue Million Forecast, by Application 2019 & 2032
- Table 80: Global Laser Resurfacing Industry Volume K Unit Forecast, by Application 2019 & 2032
- Table 81: Global Laser Resurfacing Industry Revenue Million Forecast, by End-User 2019 & 2032
- Table 82: Global Laser Resurfacing Industry Volume K Unit Forecast, by End-User 2019 & 2032
- Table 83: Global Laser Resurfacing Industry Revenue Million Forecast, by Country 2019 & 2032
- Table 84: Global Laser Resurfacing Industry Volume K Unit Forecast, by Country 2019 & 2032
- Table 85: Germany Laser Resurfacing Industry Revenue (Million) Forecast, by Application 2019 & 2032
- Table 86: Germany Laser Resurfacing Industry Volume (K Unit) Forecast, by Application 2019 & 2032
- Table 87: United Kingdom Laser Resurfacing Industry Revenue (Million) Forecast, by Application 2019 & 2032
- Table 88: United Kingdom Laser Resurfacing Industry Volume (K Unit) Forecast, by Application 2019 & 2032
- Table 89: France Laser Resurfacing Industry Revenue (Million) Forecast, by Application 2019 & 2032
- Table 90: France Laser Resurfacing Industry Volume (K Unit) Forecast, by Application 2019 & 2032
- Table 91: Italy Laser Resurfacing Industry Revenue (Million) Forecast, by Application 2019 & 2032
- Table 92: Italy Laser Resurfacing Industry Volume (K Unit) Forecast, by Application 2019 & 2032
- Table 93: Spain Laser Resurfacing Industry Revenue (Million) Forecast, by Application 2019 & 2032
- Table 94: Spain Laser Resurfacing Industry Volume (K Unit) Forecast, by Application 2019 & 2032
- Table 95: Rest of Europe Laser Resurfacing Industry Revenue (Million) Forecast, by Application 2019 & 2032
- Table 96: Rest of Europe Laser Resurfacing Industry Volume (K Unit) Forecast, by Application 2019 & 2032
- Table 97: Global Laser Resurfacing Industry Revenue Million Forecast, by Type 2019 & 2032
- Table 98: Global Laser Resurfacing Industry Volume K Unit Forecast, by Type 2019 & 2032
- Table 99: Global Laser Resurfacing Industry Revenue Million Forecast, by Application 2019 & 2032
- Table 100: Global Laser Resurfacing Industry Volume K Unit Forecast, by Application 2019 & 2032
- Table 101: Global Laser Resurfacing Industry Revenue Million Forecast, by End-User 2019 & 2032
- Table 102: Global Laser Resurfacing Industry Volume K Unit Forecast, by End-User 2019 & 2032
- Table 103: Global Laser Resurfacing Industry Revenue Million Forecast, by Country 2019 & 2032
- Table 104: Global Laser Resurfacing Industry Volume K Unit Forecast, by Country 2019 & 2032
- Table 105: China Laser Resurfacing Industry Revenue (Million) Forecast, by Application 2019 & 2032
- Table 106: China Laser Resurfacing Industry Volume (K Unit) Forecast, by Application 2019 & 2032
- Table 107: Japan Laser Resurfacing Industry Revenue (Million) Forecast, by Application 2019 & 2032
- Table 108: Japan Laser Resurfacing Industry Volume (K Unit) Forecast, by Application 2019 & 2032
- Table 109: India Laser Resurfacing Industry Revenue (Million) Forecast, by Application 2019 & 2032
- Table 110: India Laser Resurfacing Industry Volume (K Unit) Forecast, by Application 2019 & 2032
- Table 111: Australia Laser Resurfacing Industry Revenue (Million) Forecast, by Application 2019 & 2032
- Table 112: Australia Laser Resurfacing Industry Volume (K Unit) Forecast, by Application 2019 & 2032
- Table 113: South Korea Laser Resurfacing Industry Revenue (Million) Forecast, by Application 2019 & 2032
- Table 114: South Korea Laser Resurfacing Industry Volume (K Unit) Forecast, by Application 2019 & 2032
- Table 115: Rest of Asia Pacific Laser Resurfacing Industry Revenue (Million) Forecast, by Application 2019 & 2032
- Table 116: Rest of Asia Pacific Laser Resurfacing Industry Volume (K Unit) Forecast, by Application 2019 & 2032
- Table 117: Global Laser Resurfacing Industry Revenue Million Forecast, by Type 2019 & 2032
- Table 118: Global Laser Resurfacing Industry Volume K Unit Forecast, by Type 2019 & 2032
- Table 119: Global Laser Resurfacing Industry Revenue Million Forecast, by Application 2019 & 2032
- Table 120: Global Laser Resurfacing Industry Volume K Unit Forecast, by Application 2019 & 2032
- Table 121: Global Laser Resurfacing Industry Revenue Million Forecast, by End-User 2019 & 2032
- Table 122: Global Laser Resurfacing Industry Volume K Unit Forecast, by End-User 2019 & 2032
- Table 123: Global Laser Resurfacing Industry Revenue Million Forecast, by Country 2019 & 2032
- Table 124: Global Laser Resurfacing Industry Volume K Unit Forecast, by Country 2019 & 2032
- Table 125: GCC Laser Resurfacing Industry Revenue (Million) Forecast, by Application 2019 & 2032
- Table 126: GCC Laser Resurfacing Industry Volume (K Unit) Forecast, by Application 2019 & 2032
- Table 127: South Africa Laser Resurfacing Industry Revenue (Million) Forecast, by Application 2019 & 2032
- Table 128: South Africa Laser Resurfacing Industry Volume (K Unit) Forecast, by Application 2019 & 2032
- Table 129: Rest of Middle East and Africa Laser Resurfacing Industry Revenue (Million) Forecast, by Application 2019 & 2032
- Table 130: Rest of Middle East and Africa Laser Resurfacing Industry Volume (K Unit) Forecast, by Application 2019 & 2032
- Table 131: Global Laser Resurfacing Industry Revenue Million Forecast, by Type 2019 & 2032
- Table 132: Global Laser Resurfacing Industry Volume K Unit Forecast, by Type 2019 & 2032
- Table 133: Global Laser Resurfacing Industry Revenue Million Forecast, by Application 2019 & 2032
- Table 134: Global Laser Resurfacing Industry Volume K Unit Forecast, by Application 2019 & 2032
- Table 135: Global Laser Resurfacing Industry Revenue Million Forecast, by End-User 2019 & 2032
- Table 136: Global Laser Resurfacing Industry Volume K Unit Forecast, by End-User 2019 & 2032
- Table 137: Global Laser Resurfacing Industry Revenue Million Forecast, by Country 2019 & 2032
- Table 138: Global Laser Resurfacing Industry Volume K Unit Forecast, by Country 2019 & 2032
- Table 139: Brazil Laser Resurfacing Industry Revenue (Million) Forecast, by Application 2019 & 2032
- Table 140: Brazil Laser Resurfacing Industry Volume (K Unit) Forecast, by Application 2019 & 2032
- Table 141: Argentina Laser Resurfacing Industry Revenue (Million) Forecast, by Application 2019 & 2032
- Table 142: Argentina Laser Resurfacing Industry Volume (K Unit) Forecast, by Application 2019 & 2032
- Table 143: Rest of South America Laser Resurfacing Industry Revenue (Million) Forecast, by Application 2019 & 2032
- Table 144: Rest of South America Laser Resurfacing Industry Volume (K Unit) Forecast, by Application 2019 & 2032
Frequently Asked Questions
1. What is the projected Compound Annual Growth Rate (CAGR) of the Laser Resurfacing Industry?
The projected CAGR is approximately 9.18%.
2. Which companies are prominent players in the Laser Resurfacing Industry?
Key companies in the market include Cynosure, Cutera, El En Group, SharpLight Technologies Inc , Bausch Health Companies Inc (Solta Medical Inc ), Lumenis, IRIDEX Corp, Alma Lasers, Candela Medical, Jeisys Corporation, Aerolase Corp, Sciton Inc.
3. What are the main segments of the Laser Resurfacing Industry?
The market segments include Type, Application, End-User.
4. Can you provide details about the market size?
The market size is estimated to be USD 2.96 Million as of 2022.
5. What are some drivers contributing to market growth?
Increasing Demand for Non-Invasive Aesthetic Procedures; Growing Technological Advancements; Changing Lifestyle and Growing Disposable Income.
6. What are the notable trends driving market growth?
Hair Removal Segment Holds Significant Market Share and is Expected to Continue the Same Trend Over the Forecast Period.
7. Are there any restraints impacting market growth?
Social Stigma Associated With Cosmetic Treatments; High Cost of the Procedures.
8. Can you provide examples of recent developments in the market?
October 2022- Sensus Healthcare, Inc., a medical device company specializing in highly effective, non-invasive, minimally-invasive, and cost-effective treatments for oncological and non-oncological conditions, announced the launch of its portable Silk by Sensus hair removal laser system with blended wavelengths.
9. What pricing options are available for accessing the report?
Pricing options include single-user, multi-user, and enterprise licenses priced at USD 4750, USD 5250, and USD 8750 respectively.
10. Is the market size provided in terms of value or volume?
The market size is provided in terms of value, measured in Million and volume, measured in K Unit.
11. Are there any specific market keywords associated with the report?
Yes, the market keyword associated with the report is "Laser Resurfacing Industry," which aids in identifying and referencing the specific market segment covered.
12. How do I determine which pricing option suits my needs best?
The pricing options vary based on user requirements and access needs. Individual users may opt for single-user licenses, while businesses requiring broader access may choose multi-user or enterprise licenses for cost-effective access to the report.
13. Are there any additional resources or data provided in the Laser Resurfacing Industry report?
While the report offers comprehensive insights, it's advisable to review the specific contents or supplementary materials provided to ascertain if additional resources or data are available.
14. How can I stay updated on further developments or reports in the Laser Resurfacing Industry?
To stay informed about further developments, trends, and reports in the Laser Resurfacing Industry, consider subscribing to industry newsletters, following relevant companies and organizations, or regularly checking reputable industry news sources and publications.
Methodology
Step 1 - Identification of Relevant Samples Size from Population Database


Step 2 - Approaches for Defining Global Market Size (Value, Volume* & Price*)

Note*: In applicable scenarios
Step 3 - Data Sources
Primary Research
- Web Analytics
- Survey Reports
- Research Institute
- Latest Research Reports
- Opinion Leaders
Secondary Research
- Annual Reports
- White Paper
- Latest Press Release
- Industry Association
- Paid Database
- Investor Presentations

Step 4 - Data Triangulation
Involves using different sources of information in order to increase the validity of a study
These sources are likely to be stakeholders in a program - participants, other researchers, program staff, other community members, and so on.
Then we put all data in single framework & apply various statistical tools to find out the dynamic on the market.
During the analysis stage, feedback from the stakeholder groups would be compared to determine areas of agreement as well as areas of divergence


