
Key Insights
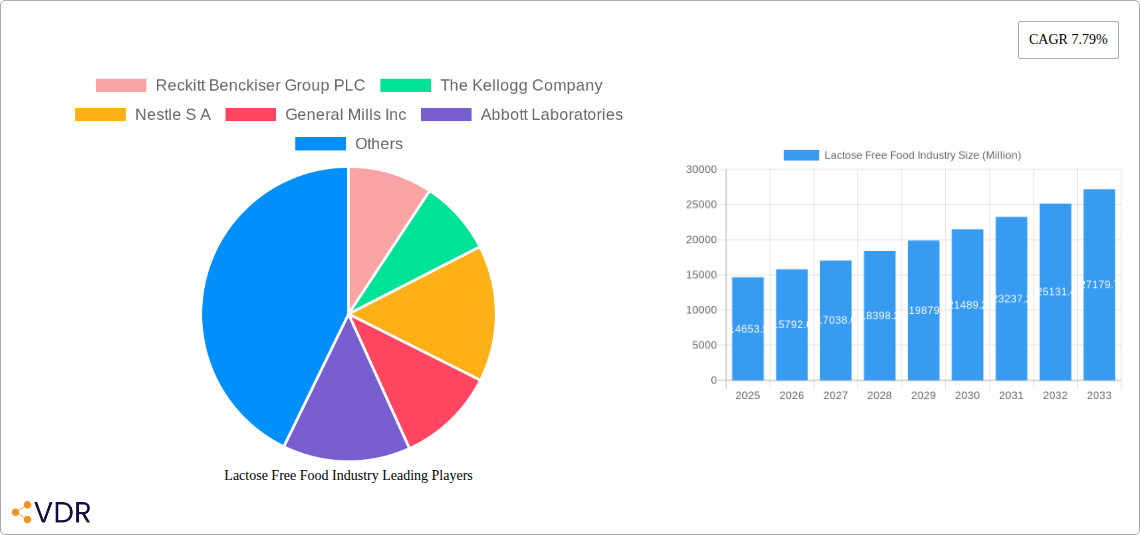
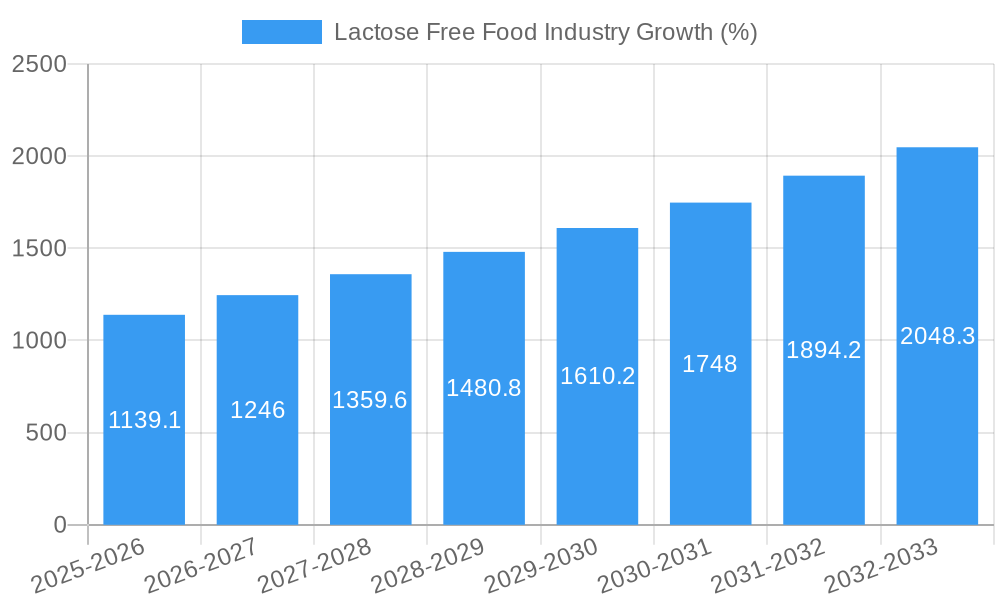
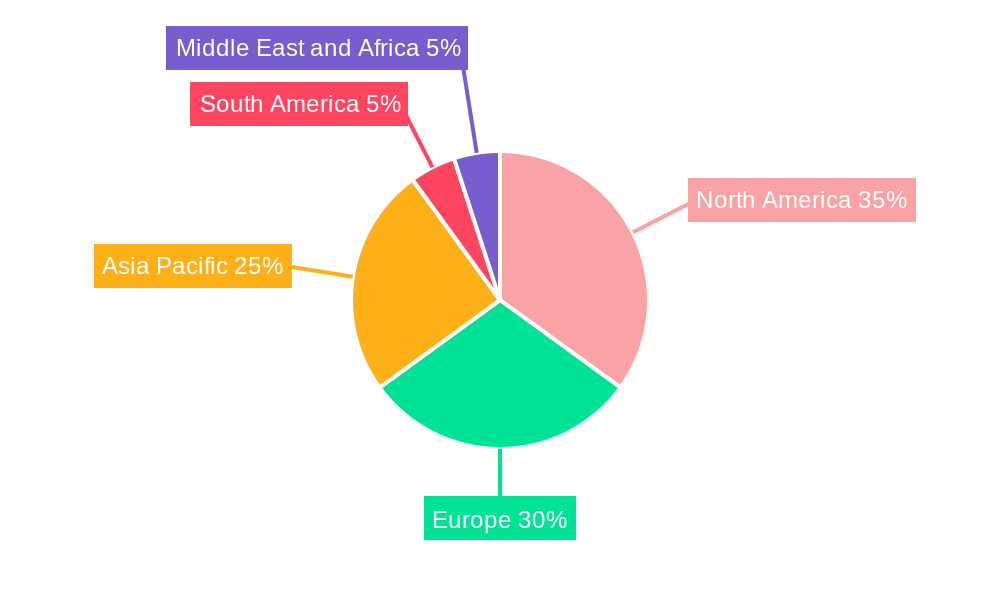
The lactose-free food market, valued at $14,653.5 million in 2025, is experiencing robust growth, projected to expand at a compound annual growth rate (CAGR) of 7.79% from 2025 to 2033. This surge is driven by the rising prevalence of lactose intolerance globally, increased consumer awareness of digestive health, and the growing popularity of plant-based alternatives. Key product segments include dairy and dairy alternatives (e.g., lactose-free milk, yogurt, cheese), bakery products, and confectionery products. The increasing availability of lactose-free options in diverse distribution channels—supermarkets, convenience stores, and online retailers—further fuels market expansion. Major players like Nestle, Danone, and Abbott Laboratories are strategically investing in research and development, expanding product portfolios, and strengthening their market presence through acquisitions and partnerships to cater to the burgeoning demand. The market's segmentation also reflects a growing emphasis on specific labeling, particularly for gluten-free and lactose-free products, demonstrating a focus on catering to consumers with specific dietary needs and preferences. Regional analysis shows strong growth across North America and Europe, driven by high consumer awareness and established distribution networks. However, Asia Pacific holds significant potential for future growth, driven by increasing disposable incomes and rising awareness of lactose intolerance in developing economies.
The competitive landscape is characterized by both established food giants and emerging specialized brands. Larger companies leverage their established distribution networks and brand recognition to capture significant market share, while smaller specialized brands focus on innovative product development and niche market segments. The market is poised for further consolidation as larger companies acquire smaller players to expand their product offerings and broaden their reach. Future growth will likely be influenced by factors such as technological advancements in lactose-free product development, shifting consumer preferences toward healthier and functional foods, and evolving regulatory landscapes concerning food labeling and health claims. Continued innovation in taste and texture of lactose-free products will be crucial to maintaining consumer satisfaction and driving further market expansion.
Lactose-Free Food Industry Market Report: 2019-2033
This comprehensive report provides a detailed analysis of the lactose-free food industry, encompassing market dynamics, growth trends, regional segmentation, product landscape, and key players. With a study period spanning 2019-2033, a base year of 2025, and a forecast period of 2025-2033, this report offers invaluable insights for industry professionals, investors, and stakeholders seeking to navigate this rapidly evolving market. The report's meticulous research covers key segments like bakery products, dairy alternatives, and meat alternatives, alongside distribution channels including supermarkets and online retail. The market size is projected in Million units.
Lactose Free Food Industry Market Dynamics & Structure
The lactose-free food market is characterized by moderate concentration, with several large multinational players alongside smaller specialized companies. Technological innovations, primarily in dairy alternatives and plant-based proteins, are key drivers. Stringent regulatory frameworks concerning labeling and food safety influence market practices. Competitive substitutes, including traditional dairy products, exert pressure on pricing and market share. The growing lactose intolerant population, particularly in developed nations, significantly drives demand. M&A activity has been moderate, with strategic acquisitions aimed at expanding product portfolios and geographical reach.
- Market Concentration: Moderately concentrated, with a top 5 market share of approximately xx%.
- Technological Innovation: Focus on improved taste and texture of plant-based alternatives.
- Regulatory Framework: Stringent labeling requirements (e.g., allergen declarations) impacting product development and marketing.
- Competitive Substitutes: Traditional dairy products remain a strong competitor.
- End-User Demographics: Growing prevalence of lactose intolerance and increasing consumer preference for healthier food options.
- M&A Trends: xx M&A deals were recorded between 2019 and 2024, primarily focused on expanding product lines and market presence.
Lactose Free Food Industry Growth Trends & Insights
The lactose-free food industry experienced robust growth during the historical period (2019-2024), driven by the increasing awareness of lactose intolerance and the rising popularity of plant-based diets. The market size reached xx Million units in 2024, demonstrating a CAGR of xx% during this period. Technological advancements leading to improved taste, texture, and nutritional profiles of lactose-free products have significantly influenced adoption rates. Consumer behavior shifts towards healthier and more sustainable food choices further propelled market expansion. We project a continued strong growth trajectory during the forecast period (2025-2033), with an expected CAGR of xx%, reaching xx Million units by 2033. Market penetration in key regions is projected to increase from xx% in 2024 to xx% in 2033. Disruptions from novel plant-based protein sources and emerging technologies are expected to further shape this growth.
Dominant Regions, Countries, or Segments in Lactose Free Food Industry
North America and Europe currently dominate the lactose-free food market, driven by high lactose intolerance prevalence and strong consumer awareness. Within product types, Dairy and Dairy Alternatives holds the largest market share, closely followed by Bakery Products. Supermarkets/Hypermarkets remain the primary distribution channel. Key growth drivers include:
- North America: High consumer awareness of lactose intolerance and a strong preference for convenient, healthy food options.
- Europe: Significant lactose intolerance prevalence, coupled with stringent food labeling regulations and robust retail infrastructure.
- Dairy and Dairy Alternatives: This segment benefits from continuous product innovation and caters to a broad consumer base.
- Supermarkets/Hypermarkets: These channels provide broad reach and significant shelf space for lactose-free products.
- Economic Policies: Government initiatives promoting healthy eating and sustainable agriculture support market growth.
- Infrastructure: Well-developed cold chain logistics facilitate the distribution of perishable lactose-free products.
Lactose Free Food Industry Product Landscape
The lactose-free food product landscape is characterized by innovation in dairy alternatives, focusing on replicating the taste and texture of traditional dairy products. Technological advancements in plant-based protein extraction and processing techniques contribute to improved product quality. Unique selling propositions often revolve around taste, texture, nutritional value, and sustainability. Recent innovations include enhanced formulations for various applications, including baking, cooking, and direct consumption.
Key Drivers, Barriers & Challenges in Lactose Free Food Industry
Key Drivers:
- Increasing prevalence of lactose intolerance.
- Growing consumer demand for plant-based and vegan options.
- Technological advancements leading to better-tasting and more versatile lactose-free products.
- Favorable government regulations promoting healthy eating.
Challenges:
- High production costs for some lactose-free alternatives.
- Maintaining consistent product quality and taste.
- Intense competition from traditional dairy products.
- Potential supply chain disruptions impacting availability.
Emerging Opportunities in Lactose Free Food Industry
- Expansion into emerging markets with growing consumer awareness of lactose intolerance.
- Development of novel lactose-free products with enhanced nutritional value and functional benefits (e.g., probiotic-rich products).
- Strategic collaborations between food manufacturers and technology providers.
- Customization of products tailored to specific dietary needs and preferences.
Growth Accelerators in the Lactose Free Food Industry Industry
Continued technological breakthroughs in plant-based protein sources, coupled with strategic partnerships among food manufacturers and ingredient suppliers, will propel long-term growth. Expansion into untapped global markets and capitalizing on evolving consumer preferences for clean-label and sustainable products are crucial for sustainable market expansion.
Key Players Shaping the Lactose Free Food Industry Market
- Reckitt Benckiser Group PLC
- The Kellogg Company
- Nestle S A
- General Mills Inc
- Abbott Laboratories
- Danone SA
- Dr Schar AG / SPA
- Blue Diamond Growers
- Oatly Group AB
- Beyond Meat
Notable Milestones in Lactose Free Food Industry Sector
- May 2022: Danone launched Nextmilk, a dairy-free beverage under the Silk Canada brand.
- October 2022: Beyond Meat partnered with Allana Group to launch plant-based meat products in India.
- February 2023: Life Health Foods Pvt. Ltd. launched So Good Oat unsweetened beverage.
In-Depth Lactose Free Food Industry Market Outlook
The lactose-free food industry is poised for significant growth over the next decade, driven by several factors. Continued innovation in plant-based alternatives will expand product availability and consumer choice. Strategic partnerships and market expansion into developing economies offer further growth potential. The focus on sustainability and health will attract increasing investments and drive adoption rates. The market's future will be shaped by the convergence of technological advancements, consumer trends, and evolving regulatory landscapes.
Lactose Free Food Industry Segmentation
-
1. Product Type
- 1.1. Bakery Products
- 1.2. Confectionery Prodcuts
- 1.3. Dairy and Dairy Alternatives
- 1.4. Meat and Seafood
- 1.5. Sauces, Condiments and Dressings
- 1.6. Other Product Types
-
2. Labeling Type
- 2.1. Gluten-Free Food
- 2.2. Lactose-Free Food
- 2.3. Other Labeling Types
-
3. Distribution Channel
- 3.1. Supermarkets/Hypermarkets
- 3.2. Convenience/Grocery Stores
- 3.3. Online Retail Stores
- 3.4. Other Distribution Channels
Lactose Free Food Industry Segmentation By Geography
-
1. North America
- 1.1. United States
- 1.2. Canada
- 1.3. Mexico
- 1.4. Rest of North America
-
2. Europe
- 2.1. Spain
- 2.2. United Kingdom
- 2.3. Germany
- 2.4. France
- 2.5. Italy
- 2.6. Russia
- 2.7. Rest of Europe
-
3. Asia Pacific
- 3.1. China
- 3.2. Japan
- 3.3. India
- 3.4. Australia
- 3.5. Rest of Asia Pacific
-
4. South America
- 4.1. Brazil
- 4.2. Argentina
- 4.3. Rest of South America
-
5. Middle East and Africa
- 5.1. South Africa
- 5.2. United Arab Emirates
- 5.3. Rest of Middle East and Africa
Lactose Free Food Industry REPORT HIGHLIGHTS
| Aspects | Details |
|---|---|
| Study Period | 2019-2033 |
| Base Year | 2024 |
| Estimated Year | 2025 |
| Forecast Period | 2025-2033 |
| Historical Period | 2019-2024 |
| Growth Rate | CAGR of 7.79% from 2019-2033 |
| Segmentation |
|
Table of Contents
- 1. Introduction
- 1.1. Research Scope
- 1.2. Market Segmentation
- 1.3. Research Methodology
- 1.4. Definitions and Assumptions
- 2. Executive Summary
- 2.1. Introduction
- 3. Market Dynamics
- 3.1. Introduction
- 3.2. Market Drivers
- 3.2.1. Increasing Demand for Clean Label Ingredients; Growing Health Consciousness of Consumers
- 3.3. Market Restrains
- 3.3.1. Higher Manufacturing Cost
- 3.4. Market Trends
- 3.4.1. Surge in Demand of Clean Label and Free From Ingredients
- 4. Market Factor Analysis
- 4.1. Porters Five Forces
- 4.2. Supply/Value Chain
- 4.3. PESTEL analysis
- 4.4. Market Entropy
- 4.5. Patent/Trademark Analysis
- 5. Global Lactose Free Food Industry Analysis, Insights and Forecast, 2019-2031
- 5.1. Market Analysis, Insights and Forecast - by Product Type
- 5.1.1. Bakery Products
- 5.1.2. Confectionery Prodcuts
- 5.1.3. Dairy and Dairy Alternatives
- 5.1.4. Meat and Seafood
- 5.1.5. Sauces, Condiments and Dressings
- 5.1.6. Other Product Types
- 5.2. Market Analysis, Insights and Forecast - by Labeling Type
- 5.2.1. Gluten-Free Food
- 5.2.2. Lactose-Free Food
- 5.2.3. Other Labeling Types
- 5.3. Market Analysis, Insights and Forecast - by Distribution Channel
- 5.3.1. Supermarkets/Hypermarkets
- 5.3.2. Convenience/Grocery Stores
- 5.3.3. Online Retail Stores
- 5.3.4. Other Distribution Channels
- 5.4. Market Analysis, Insights and Forecast - by Region
- 5.4.1. North America
- 5.4.2. Europe
- 5.4.3. Asia Pacific
- 5.4.4. South America
- 5.4.5. Middle East and Africa
- 5.1. Market Analysis, Insights and Forecast - by Product Type
- 6. North America Lactose Free Food Industry Analysis, Insights and Forecast, 2019-2031
- 6.1. Market Analysis, Insights and Forecast - by Product Type
- 6.1.1. Bakery Products
- 6.1.2. Confectionery Prodcuts
- 6.1.3. Dairy and Dairy Alternatives
- 6.1.4. Meat and Seafood
- 6.1.5. Sauces, Condiments and Dressings
- 6.1.6. Other Product Types
- 6.2. Market Analysis, Insights and Forecast - by Labeling Type
- 6.2.1. Gluten-Free Food
- 6.2.2. Lactose-Free Food
- 6.2.3. Other Labeling Types
- 6.3. Market Analysis, Insights and Forecast - by Distribution Channel
- 6.3.1. Supermarkets/Hypermarkets
- 6.3.2. Convenience/Grocery Stores
- 6.3.3. Online Retail Stores
- 6.3.4. Other Distribution Channels
- 6.1. Market Analysis, Insights and Forecast - by Product Type
- 7. Europe Lactose Free Food Industry Analysis, Insights and Forecast, 2019-2031
- 7.1. Market Analysis, Insights and Forecast - by Product Type
- 7.1.1. Bakery Products
- 7.1.2. Confectionery Prodcuts
- 7.1.3. Dairy and Dairy Alternatives
- 7.1.4. Meat and Seafood
- 7.1.5. Sauces, Condiments and Dressings
- 7.1.6. Other Product Types
- 7.2. Market Analysis, Insights and Forecast - by Labeling Type
- 7.2.1. Gluten-Free Food
- 7.2.2. Lactose-Free Food
- 7.2.3. Other Labeling Types
- 7.3. Market Analysis, Insights and Forecast - by Distribution Channel
- 7.3.1. Supermarkets/Hypermarkets
- 7.3.2. Convenience/Grocery Stores
- 7.3.3. Online Retail Stores
- 7.3.4. Other Distribution Channels
- 7.1. Market Analysis, Insights and Forecast - by Product Type
- 8. Asia Pacific Lactose Free Food Industry Analysis, Insights and Forecast, 2019-2031
- 8.1. Market Analysis, Insights and Forecast - by Product Type
- 8.1.1. Bakery Products
- 8.1.2. Confectionery Prodcuts
- 8.1.3. Dairy and Dairy Alternatives
- 8.1.4. Meat and Seafood
- 8.1.5. Sauces, Condiments and Dressings
- 8.1.6. Other Product Types
- 8.2. Market Analysis, Insights and Forecast - by Labeling Type
- 8.2.1. Gluten-Free Food
- 8.2.2. Lactose-Free Food
- 8.2.3. Other Labeling Types
- 8.3. Market Analysis, Insights and Forecast - by Distribution Channel
- 8.3.1. Supermarkets/Hypermarkets
- 8.3.2. Convenience/Grocery Stores
- 8.3.3. Online Retail Stores
- 8.3.4. Other Distribution Channels
- 8.1. Market Analysis, Insights and Forecast - by Product Type
- 9. South America Lactose Free Food Industry Analysis, Insights and Forecast, 2019-2031
- 9.1. Market Analysis, Insights and Forecast - by Product Type
- 9.1.1. Bakery Products
- 9.1.2. Confectionery Prodcuts
- 9.1.3. Dairy and Dairy Alternatives
- 9.1.4. Meat and Seafood
- 9.1.5. Sauces, Condiments and Dressings
- 9.1.6. Other Product Types
- 9.2. Market Analysis, Insights and Forecast - by Labeling Type
- 9.2.1. Gluten-Free Food
- 9.2.2. Lactose-Free Food
- 9.2.3. Other Labeling Types
- 9.3. Market Analysis, Insights and Forecast - by Distribution Channel
- 9.3.1. Supermarkets/Hypermarkets
- 9.3.2. Convenience/Grocery Stores
- 9.3.3. Online Retail Stores
- 9.3.4. Other Distribution Channels
- 9.1. Market Analysis, Insights and Forecast - by Product Type
- 10. Middle East and Africa Lactose Free Food Industry Analysis, Insights and Forecast, 2019-2031
- 10.1. Market Analysis, Insights and Forecast - by Product Type
- 10.1.1. Bakery Products
- 10.1.2. Confectionery Prodcuts
- 10.1.3. Dairy and Dairy Alternatives
- 10.1.4. Meat and Seafood
- 10.1.5. Sauces, Condiments and Dressings
- 10.1.6. Other Product Types
- 10.2. Market Analysis, Insights and Forecast - by Labeling Type
- 10.2.1. Gluten-Free Food
- 10.2.2. Lactose-Free Food
- 10.2.3. Other Labeling Types
- 10.3. Market Analysis, Insights and Forecast - by Distribution Channel
- 10.3.1. Supermarkets/Hypermarkets
- 10.3.2. Convenience/Grocery Stores
- 10.3.3. Online Retail Stores
- 10.3.4. Other Distribution Channels
- 10.1. Market Analysis, Insights and Forecast - by Product Type
- 11. North America Lactose Free Food Industry Analysis, Insights and Forecast, 2019-2031
- 11.1. Market Analysis, Insights and Forecast - By Country/Sub-region
- 11.1.1 United States
- 11.1.2 Canada
- 11.1.3 Mexico
- 11.1.4 Rest of North America
- 12. Europe Lactose Free Food Industry Analysis, Insights and Forecast, 2019-2031
- 12.1. Market Analysis, Insights and Forecast - By Country/Sub-region
- 12.1.1 Spain
- 12.1.2 United Kingdom
- 12.1.3 Germany
- 12.1.4 France
- 12.1.5 Italy
- 12.1.6 Russia
- 12.1.7 Rest of Europe
- 13. Asia Pacific Lactose Free Food Industry Analysis, Insights and Forecast, 2019-2031
- 13.1. Market Analysis, Insights and Forecast - By Country/Sub-region
- 13.1.1 China
- 13.1.2 Japan
- 13.1.3 India
- 13.1.4 Australia
- 13.1.5 Rest of Asia Pacific
- 14. South America Lactose Free Food Industry Analysis, Insights and Forecast, 2019-2031
- 14.1. Market Analysis, Insights and Forecast - By Country/Sub-region
- 14.1.1 Brazil
- 14.1.2 Argentina
- 14.1.3 Rest of South America
- 15. Middle East and Africa Lactose Free Food Industry Analysis, Insights and Forecast, 2019-2031
- 15.1. Market Analysis, Insights and Forecast - By Country/Sub-region
- 15.1.1 South Africa
- 15.1.2 United Arab Emirates
- 15.1.3 Rest of Middle East and Africa
- 16. Competitive Analysis
- 16.1. Global Market Share Analysis 2024
- 16.2. Company Profiles
- 16.2.1 Reckitt Benckiser Group PLC
- 16.2.1.1. Overview
- 16.2.1.2. Products
- 16.2.1.3. SWOT Analysis
- 16.2.1.4. Recent Developments
- 16.2.1.5. Financials (Based on Availability)
- 16.2.2 The Kellogg Company
- 16.2.2.1. Overview
- 16.2.2.2. Products
- 16.2.2.3. SWOT Analysis
- 16.2.2.4. Recent Developments
- 16.2.2.5. Financials (Based on Availability)
- 16.2.3 Nestle S A
- 16.2.3.1. Overview
- 16.2.3.2. Products
- 16.2.3.3. SWOT Analysis
- 16.2.3.4. Recent Developments
- 16.2.3.5. Financials (Based on Availability)
- 16.2.4 General Mills Inc
- 16.2.4.1. Overview
- 16.2.4.2. Products
- 16.2.4.3. SWOT Analysis
- 16.2.4.4. Recent Developments
- 16.2.4.5. Financials (Based on Availability)
- 16.2.5 Abbott Laboratories
- 16.2.5.1. Overview
- 16.2.5.2. Products
- 16.2.5.3. SWOT Analysis
- 16.2.5.4. Recent Developments
- 16.2.5.5. Financials (Based on Availability)
- 16.2.6 Danone SA
- 16.2.6.1. Overview
- 16.2.6.2. Products
- 16.2.6.3. SWOT Analysis
- 16.2.6.4. Recent Developments
- 16.2.6.5. Financials (Based on Availability)
- 16.2.7 Dr Schar AG / SPA*List Not Exhaustive
- 16.2.7.1. Overview
- 16.2.7.2. Products
- 16.2.7.3. SWOT Analysis
- 16.2.7.4. Recent Developments
- 16.2.7.5. Financials (Based on Availability)
- 16.2.8 Blue Diamond Growers
- 16.2.8.1. Overview
- 16.2.8.2. Products
- 16.2.8.3. SWOT Analysis
- 16.2.8.4. Recent Developments
- 16.2.8.5. Financials (Based on Availability)
- 16.2.9 Oatly Group AB
- 16.2.9.1. Overview
- 16.2.9.2. Products
- 16.2.9.3. SWOT Analysis
- 16.2.9.4. Recent Developments
- 16.2.9.5. Financials (Based on Availability)
- 16.2.10 Beyond Meat
- 16.2.10.1. Overview
- 16.2.10.2. Products
- 16.2.10.3. SWOT Analysis
- 16.2.10.4. Recent Developments
- 16.2.10.5. Financials (Based on Availability)
- 16.2.1 Reckitt Benckiser Group PLC
List of Figures
- Figure 1: Global Lactose Free Food Industry Revenue Breakdown (Million, %) by Region 2024 & 2032
- Figure 2: Global Lactose Free Food Industry Volume Breakdown (K Tons, %) by Region 2024 & 2032
- Figure 3: North America Lactose Free Food Industry Revenue (Million), by Country 2024 & 2032
- Figure 4: North America Lactose Free Food Industry Volume (K Tons), by Country 2024 & 2032
- Figure 5: North America Lactose Free Food Industry Revenue Share (%), by Country 2024 & 2032
- Figure 6: North America Lactose Free Food Industry Volume Share (%), by Country 2024 & 2032
- Figure 7: Europe Lactose Free Food Industry Revenue (Million), by Country 2024 & 2032
- Figure 8: Europe Lactose Free Food Industry Volume (K Tons), by Country 2024 & 2032
- Figure 9: Europe Lactose Free Food Industry Revenue Share (%), by Country 2024 & 2032
- Figure 10: Europe Lactose Free Food Industry Volume Share (%), by Country 2024 & 2032
- Figure 11: Asia Pacific Lactose Free Food Industry Revenue (Million), by Country 2024 & 2032
- Figure 12: Asia Pacific Lactose Free Food Industry Volume (K Tons), by Country 2024 & 2032
- Figure 13: Asia Pacific Lactose Free Food Industry Revenue Share (%), by Country 2024 & 2032
- Figure 14: Asia Pacific Lactose Free Food Industry Volume Share (%), by Country 2024 & 2032
- Figure 15: South America Lactose Free Food Industry Revenue (Million), by Country 2024 & 2032
- Figure 16: South America Lactose Free Food Industry Volume (K Tons), by Country 2024 & 2032
- Figure 17: South America Lactose Free Food Industry Revenue Share (%), by Country 2024 & 2032
- Figure 18: South America Lactose Free Food Industry Volume Share (%), by Country 2024 & 2032
- Figure 19: Middle East and Africa Lactose Free Food Industry Revenue (Million), by Country 2024 & 2032
- Figure 20: Middle East and Africa Lactose Free Food Industry Volume (K Tons), by Country 2024 & 2032
- Figure 21: Middle East and Africa Lactose Free Food Industry Revenue Share (%), by Country 2024 & 2032
- Figure 22: Middle East and Africa Lactose Free Food Industry Volume Share (%), by Country 2024 & 2032
- Figure 23: North America Lactose Free Food Industry Revenue (Million), by Product Type 2024 & 2032
- Figure 24: North America Lactose Free Food Industry Volume (K Tons), by Product Type 2024 & 2032
- Figure 25: North America Lactose Free Food Industry Revenue Share (%), by Product Type 2024 & 2032
- Figure 26: North America Lactose Free Food Industry Volume Share (%), by Product Type 2024 & 2032
- Figure 27: North America Lactose Free Food Industry Revenue (Million), by Labeling Type 2024 & 2032
- Figure 28: North America Lactose Free Food Industry Volume (K Tons), by Labeling Type 2024 & 2032
- Figure 29: North America Lactose Free Food Industry Revenue Share (%), by Labeling Type 2024 & 2032
- Figure 30: North America Lactose Free Food Industry Volume Share (%), by Labeling Type 2024 & 2032
- Figure 31: North America Lactose Free Food Industry Revenue (Million), by Distribution Channel 2024 & 2032
- Figure 32: North America Lactose Free Food Industry Volume (K Tons), by Distribution Channel 2024 & 2032
- Figure 33: North America Lactose Free Food Industry Revenue Share (%), by Distribution Channel 2024 & 2032
- Figure 34: North America Lactose Free Food Industry Volume Share (%), by Distribution Channel 2024 & 2032
- Figure 35: North America Lactose Free Food Industry Revenue (Million), by Country 2024 & 2032
- Figure 36: North America Lactose Free Food Industry Volume (K Tons), by Country 2024 & 2032
- Figure 37: North America Lactose Free Food Industry Revenue Share (%), by Country 2024 & 2032
- Figure 38: North America Lactose Free Food Industry Volume Share (%), by Country 2024 & 2032
- Figure 39: Europe Lactose Free Food Industry Revenue (Million), by Product Type 2024 & 2032
- Figure 40: Europe Lactose Free Food Industry Volume (K Tons), by Product Type 2024 & 2032
- Figure 41: Europe Lactose Free Food Industry Revenue Share (%), by Product Type 2024 & 2032
- Figure 42: Europe Lactose Free Food Industry Volume Share (%), by Product Type 2024 & 2032
- Figure 43: Europe Lactose Free Food Industry Revenue (Million), by Labeling Type 2024 & 2032
- Figure 44: Europe Lactose Free Food Industry Volume (K Tons), by Labeling Type 2024 & 2032
- Figure 45: Europe Lactose Free Food Industry Revenue Share (%), by Labeling Type 2024 & 2032
- Figure 46: Europe Lactose Free Food Industry Volume Share (%), by Labeling Type 2024 & 2032
- Figure 47: Europe Lactose Free Food Industry Revenue (Million), by Distribution Channel 2024 & 2032
- Figure 48: Europe Lactose Free Food Industry Volume (K Tons), by Distribution Channel 2024 & 2032
- Figure 49: Europe Lactose Free Food Industry Revenue Share (%), by Distribution Channel 2024 & 2032
- Figure 50: Europe Lactose Free Food Industry Volume Share (%), by Distribution Channel 2024 & 2032
- Figure 51: Europe Lactose Free Food Industry Revenue (Million), by Country 2024 & 2032
- Figure 52: Europe Lactose Free Food Industry Volume (K Tons), by Country 2024 & 2032
- Figure 53: Europe Lactose Free Food Industry Revenue Share (%), by Country 2024 & 2032
- Figure 54: Europe Lactose Free Food Industry Volume Share (%), by Country 2024 & 2032
- Figure 55: Asia Pacific Lactose Free Food Industry Revenue (Million), by Product Type 2024 & 2032
- Figure 56: Asia Pacific Lactose Free Food Industry Volume (K Tons), by Product Type 2024 & 2032
- Figure 57: Asia Pacific Lactose Free Food Industry Revenue Share (%), by Product Type 2024 & 2032
- Figure 58: Asia Pacific Lactose Free Food Industry Volume Share (%), by Product Type 2024 & 2032
- Figure 59: Asia Pacific Lactose Free Food Industry Revenue (Million), by Labeling Type 2024 & 2032
- Figure 60: Asia Pacific Lactose Free Food Industry Volume (K Tons), by Labeling Type 2024 & 2032
- Figure 61: Asia Pacific Lactose Free Food Industry Revenue Share (%), by Labeling Type 2024 & 2032
- Figure 62: Asia Pacific Lactose Free Food Industry Volume Share (%), by Labeling Type 2024 & 2032
- Figure 63: Asia Pacific Lactose Free Food Industry Revenue (Million), by Distribution Channel 2024 & 2032
- Figure 64: Asia Pacific Lactose Free Food Industry Volume (K Tons), by Distribution Channel 2024 & 2032
- Figure 65: Asia Pacific Lactose Free Food Industry Revenue Share (%), by Distribution Channel 2024 & 2032
- Figure 66: Asia Pacific Lactose Free Food Industry Volume Share (%), by Distribution Channel 2024 & 2032
- Figure 67: Asia Pacific Lactose Free Food Industry Revenue (Million), by Country 2024 & 2032
- Figure 68: Asia Pacific Lactose Free Food Industry Volume (K Tons), by Country 2024 & 2032
- Figure 69: Asia Pacific Lactose Free Food Industry Revenue Share (%), by Country 2024 & 2032
- Figure 70: Asia Pacific Lactose Free Food Industry Volume Share (%), by Country 2024 & 2032
- Figure 71: South America Lactose Free Food Industry Revenue (Million), by Product Type 2024 & 2032
- Figure 72: South America Lactose Free Food Industry Volume (K Tons), by Product Type 2024 & 2032
- Figure 73: South America Lactose Free Food Industry Revenue Share (%), by Product Type 2024 & 2032
- Figure 74: South America Lactose Free Food Industry Volume Share (%), by Product Type 2024 & 2032
- Figure 75: South America Lactose Free Food Industry Revenue (Million), by Labeling Type 2024 & 2032
- Figure 76: South America Lactose Free Food Industry Volume (K Tons), by Labeling Type 2024 & 2032
- Figure 77: South America Lactose Free Food Industry Revenue Share (%), by Labeling Type 2024 & 2032
- Figure 78: South America Lactose Free Food Industry Volume Share (%), by Labeling Type 2024 & 2032
- Figure 79: South America Lactose Free Food Industry Revenue (Million), by Distribution Channel 2024 & 2032
- Figure 80: South America Lactose Free Food Industry Volume (K Tons), by Distribution Channel 2024 & 2032
- Figure 81: South America Lactose Free Food Industry Revenue Share (%), by Distribution Channel 2024 & 2032
- Figure 82: South America Lactose Free Food Industry Volume Share (%), by Distribution Channel 2024 & 2032
- Figure 83: South America Lactose Free Food Industry Revenue (Million), by Country 2024 & 2032
- Figure 84: South America Lactose Free Food Industry Volume (K Tons), by Country 2024 & 2032
- Figure 85: South America Lactose Free Food Industry Revenue Share (%), by Country 2024 & 2032
- Figure 86: South America Lactose Free Food Industry Volume Share (%), by Country 2024 & 2032
- Figure 87: Middle East and Africa Lactose Free Food Industry Revenue (Million), by Product Type 2024 & 2032
- Figure 88: Middle East and Africa Lactose Free Food Industry Volume (K Tons), by Product Type 2024 & 2032
- Figure 89: Middle East and Africa Lactose Free Food Industry Revenue Share (%), by Product Type 2024 & 2032
- Figure 90: Middle East and Africa Lactose Free Food Industry Volume Share (%), by Product Type 2024 & 2032
- Figure 91: Middle East and Africa Lactose Free Food Industry Revenue (Million), by Labeling Type 2024 & 2032
- Figure 92: Middle East and Africa Lactose Free Food Industry Volume (K Tons), by Labeling Type 2024 & 2032
- Figure 93: Middle East and Africa Lactose Free Food Industry Revenue Share (%), by Labeling Type 2024 & 2032
- Figure 94: Middle East and Africa Lactose Free Food Industry Volume Share (%), by Labeling Type 2024 & 2032
- Figure 95: Middle East and Africa Lactose Free Food Industry Revenue (Million), by Distribution Channel 2024 & 2032
- Figure 96: Middle East and Africa Lactose Free Food Industry Volume (K Tons), by Distribution Channel 2024 & 2032
- Figure 97: Middle East and Africa Lactose Free Food Industry Revenue Share (%), by Distribution Channel 2024 & 2032
- Figure 98: Middle East and Africa Lactose Free Food Industry Volume Share (%), by Distribution Channel 2024 & 2032
- Figure 99: Middle East and Africa Lactose Free Food Industry Revenue (Million), by Country 2024 & 2032
- Figure 100: Middle East and Africa Lactose Free Food Industry Volume (K Tons), by Country 2024 & 2032
- Figure 101: Middle East and Africa Lactose Free Food Industry Revenue Share (%), by Country 2024 & 2032
- Figure 102: Middle East and Africa Lactose Free Food Industry Volume Share (%), by Country 2024 & 2032
List of Tables
- Table 1: Global Lactose Free Food Industry Revenue Million Forecast, by Region 2019 & 2032
- Table 2: Global Lactose Free Food Industry Volume K Tons Forecast, by Region 2019 & 2032
- Table 3: Global Lactose Free Food Industry Revenue Million Forecast, by Product Type 2019 & 2032
- Table 4: Global Lactose Free Food Industry Volume K Tons Forecast, by Product Type 2019 & 2032
- Table 5: Global Lactose Free Food Industry Revenue Million Forecast, by Labeling Type 2019 & 2032
- Table 6: Global Lactose Free Food Industry Volume K Tons Forecast, by Labeling Type 2019 & 2032
- Table 7: Global Lactose Free Food Industry Revenue Million Forecast, by Distribution Channel 2019 & 2032
- Table 8: Global Lactose Free Food Industry Volume K Tons Forecast, by Distribution Channel 2019 & 2032
- Table 9: Global Lactose Free Food Industry Revenue Million Forecast, by Region 2019 & 2032
- Table 10: Global Lactose Free Food Industry Volume K Tons Forecast, by Region 2019 & 2032
- Table 11: Global Lactose Free Food Industry Revenue Million Forecast, by Country 2019 & 2032
- Table 12: Global Lactose Free Food Industry Volume K Tons Forecast, by Country 2019 & 2032
- Table 13: United States Lactose Free Food Industry Revenue (Million) Forecast, by Application 2019 & 2032
- Table 14: United States Lactose Free Food Industry Volume (K Tons) Forecast, by Application 2019 & 2032
- Table 15: Canada Lactose Free Food Industry Revenue (Million) Forecast, by Application 2019 & 2032
- Table 16: Canada Lactose Free Food Industry Volume (K Tons) Forecast, by Application 2019 & 2032
- Table 17: Mexico Lactose Free Food Industry Revenue (Million) Forecast, by Application 2019 & 2032
- Table 18: Mexico Lactose Free Food Industry Volume (K Tons) Forecast, by Application 2019 & 2032
- Table 19: Rest of North America Lactose Free Food Industry Revenue (Million) Forecast, by Application 2019 & 2032
- Table 20: Rest of North America Lactose Free Food Industry Volume (K Tons) Forecast, by Application 2019 & 2032
- Table 21: Global Lactose Free Food Industry Revenue Million Forecast, by Country 2019 & 2032
- Table 22: Global Lactose Free Food Industry Volume K Tons Forecast, by Country 2019 & 2032
- Table 23: Spain Lactose Free Food Industry Revenue (Million) Forecast, by Application 2019 & 2032
- Table 24: Spain Lactose Free Food Industry Volume (K Tons) Forecast, by Application 2019 & 2032
- Table 25: United Kingdom Lactose Free Food Industry Revenue (Million) Forecast, by Application 2019 & 2032
- Table 26: United Kingdom Lactose Free Food Industry Volume (K Tons) Forecast, by Application 2019 & 2032
- Table 27: Germany Lactose Free Food Industry Revenue (Million) Forecast, by Application 2019 & 2032
- Table 28: Germany Lactose Free Food Industry Volume (K Tons) Forecast, by Application 2019 & 2032
- Table 29: France Lactose Free Food Industry Revenue (Million) Forecast, by Application 2019 & 2032
- Table 30: France Lactose Free Food Industry Volume (K Tons) Forecast, by Application 2019 & 2032
- Table 31: Italy Lactose Free Food Industry Revenue (Million) Forecast, by Application 2019 & 2032
- Table 32: Italy Lactose Free Food Industry Volume (K Tons) Forecast, by Application 2019 & 2032
- Table 33: Russia Lactose Free Food Industry Revenue (Million) Forecast, by Application 2019 & 2032
- Table 34: Russia Lactose Free Food Industry Volume (K Tons) Forecast, by Application 2019 & 2032
- Table 35: Rest of Europe Lactose Free Food Industry Revenue (Million) Forecast, by Application 2019 & 2032
- Table 36: Rest of Europe Lactose Free Food Industry Volume (K Tons) Forecast, by Application 2019 & 2032
- Table 37: Global Lactose Free Food Industry Revenue Million Forecast, by Country 2019 & 2032
- Table 38: Global Lactose Free Food Industry Volume K Tons Forecast, by Country 2019 & 2032
- Table 39: China Lactose Free Food Industry Revenue (Million) Forecast, by Application 2019 & 2032
- Table 40: China Lactose Free Food Industry Volume (K Tons) Forecast, by Application 2019 & 2032
- Table 41: Japan Lactose Free Food Industry Revenue (Million) Forecast, by Application 2019 & 2032
- Table 42: Japan Lactose Free Food Industry Volume (K Tons) Forecast, by Application 2019 & 2032
- Table 43: India Lactose Free Food Industry Revenue (Million) Forecast, by Application 2019 & 2032
- Table 44: India Lactose Free Food Industry Volume (K Tons) Forecast, by Application 2019 & 2032
- Table 45: Australia Lactose Free Food Industry Revenue (Million) Forecast, by Application 2019 & 2032
- Table 46: Australia Lactose Free Food Industry Volume (K Tons) Forecast, by Application 2019 & 2032
- Table 47: Rest of Asia Pacific Lactose Free Food Industry Revenue (Million) Forecast, by Application 2019 & 2032
- Table 48: Rest of Asia Pacific Lactose Free Food Industry Volume (K Tons) Forecast, by Application 2019 & 2032
- Table 49: Global Lactose Free Food Industry Revenue Million Forecast, by Country 2019 & 2032
- Table 50: Global Lactose Free Food Industry Volume K Tons Forecast, by Country 2019 & 2032
- Table 51: Brazil Lactose Free Food Industry Revenue (Million) Forecast, by Application 2019 & 2032
- Table 52: Brazil Lactose Free Food Industry Volume (K Tons) Forecast, by Application 2019 & 2032
- Table 53: Argentina Lactose Free Food Industry Revenue (Million) Forecast, by Application 2019 & 2032
- Table 54: Argentina Lactose Free Food Industry Volume (K Tons) Forecast, by Application 2019 & 2032
- Table 55: Rest of South America Lactose Free Food Industry Revenue (Million) Forecast, by Application 2019 & 2032
- Table 56: Rest of South America Lactose Free Food Industry Volume (K Tons) Forecast, by Application 2019 & 2032
- Table 57: Global Lactose Free Food Industry Revenue Million Forecast, by Country 2019 & 2032
- Table 58: Global Lactose Free Food Industry Volume K Tons Forecast, by Country 2019 & 2032
- Table 59: South Africa Lactose Free Food Industry Revenue (Million) Forecast, by Application 2019 & 2032
- Table 60: South Africa Lactose Free Food Industry Volume (K Tons) Forecast, by Application 2019 & 2032
- Table 61: United Arab Emirates Lactose Free Food Industry Revenue (Million) Forecast, by Application 2019 & 2032
- Table 62: United Arab Emirates Lactose Free Food Industry Volume (K Tons) Forecast, by Application 2019 & 2032
- Table 63: Rest of Middle East and Africa Lactose Free Food Industry Revenue (Million) Forecast, by Application 2019 & 2032
- Table 64: Rest of Middle East and Africa Lactose Free Food Industry Volume (K Tons) Forecast, by Application 2019 & 2032
- Table 65: Global Lactose Free Food Industry Revenue Million Forecast, by Product Type 2019 & 2032
- Table 66: Global Lactose Free Food Industry Volume K Tons Forecast, by Product Type 2019 & 2032
- Table 67: Global Lactose Free Food Industry Revenue Million Forecast, by Labeling Type 2019 & 2032
- Table 68: Global Lactose Free Food Industry Volume K Tons Forecast, by Labeling Type 2019 & 2032
- Table 69: Global Lactose Free Food Industry Revenue Million Forecast, by Distribution Channel 2019 & 2032
- Table 70: Global Lactose Free Food Industry Volume K Tons Forecast, by Distribution Channel 2019 & 2032
- Table 71: Global Lactose Free Food Industry Revenue Million Forecast, by Country 2019 & 2032
- Table 72: Global Lactose Free Food Industry Volume K Tons Forecast, by Country 2019 & 2032
- Table 73: United States Lactose Free Food Industry Revenue (Million) Forecast, by Application 2019 & 2032
- Table 74: United States Lactose Free Food Industry Volume (K Tons) Forecast, by Application 2019 & 2032
- Table 75: Canada Lactose Free Food Industry Revenue (Million) Forecast, by Application 2019 & 2032
- Table 76: Canada Lactose Free Food Industry Volume (K Tons) Forecast, by Application 2019 & 2032
- Table 77: Mexico Lactose Free Food Industry Revenue (Million) Forecast, by Application 2019 & 2032
- Table 78: Mexico Lactose Free Food Industry Volume (K Tons) Forecast, by Application 2019 & 2032
- Table 79: Rest of North America Lactose Free Food Industry Revenue (Million) Forecast, by Application 2019 & 2032
- Table 80: Rest of North America Lactose Free Food Industry Volume (K Tons) Forecast, by Application 2019 & 2032
- Table 81: Global Lactose Free Food Industry Revenue Million Forecast, by Product Type 2019 & 2032
- Table 82: Global Lactose Free Food Industry Volume K Tons Forecast, by Product Type 2019 & 2032
- Table 83: Global Lactose Free Food Industry Revenue Million Forecast, by Labeling Type 2019 & 2032
- Table 84: Global Lactose Free Food Industry Volume K Tons Forecast, by Labeling Type 2019 & 2032
- Table 85: Global Lactose Free Food Industry Revenue Million Forecast, by Distribution Channel 2019 & 2032
- Table 86: Global Lactose Free Food Industry Volume K Tons Forecast, by Distribution Channel 2019 & 2032
- Table 87: Global Lactose Free Food Industry Revenue Million Forecast, by Country 2019 & 2032
- Table 88: Global Lactose Free Food Industry Volume K Tons Forecast, by Country 2019 & 2032
- Table 89: Spain Lactose Free Food Industry Revenue (Million) Forecast, by Application 2019 & 2032
- Table 90: Spain Lactose Free Food Industry Volume (K Tons) Forecast, by Application 2019 & 2032
- Table 91: United Kingdom Lactose Free Food Industry Revenue (Million) Forecast, by Application 2019 & 2032
- Table 92: United Kingdom Lactose Free Food Industry Volume (K Tons) Forecast, by Application 2019 & 2032
- Table 93: Germany Lactose Free Food Industry Revenue (Million) Forecast, by Application 2019 & 2032
- Table 94: Germany Lactose Free Food Industry Volume (K Tons) Forecast, by Application 2019 & 2032
- Table 95: France Lactose Free Food Industry Revenue (Million) Forecast, by Application 2019 & 2032
- Table 96: France Lactose Free Food Industry Volume (K Tons) Forecast, by Application 2019 & 2032
- Table 97: Italy Lactose Free Food Industry Revenue (Million) Forecast, by Application 2019 & 2032
- Table 98: Italy Lactose Free Food Industry Volume (K Tons) Forecast, by Application 2019 & 2032
- Table 99: Russia Lactose Free Food Industry Revenue (Million) Forecast, by Application 2019 & 2032
- Table 100: Russia Lactose Free Food Industry Volume (K Tons) Forecast, by Application 2019 & 2032
- Table 101: Rest of Europe Lactose Free Food Industry Revenue (Million) Forecast, by Application 2019 & 2032
- Table 102: Rest of Europe Lactose Free Food Industry Volume (K Tons) Forecast, by Application 2019 & 2032
- Table 103: Global Lactose Free Food Industry Revenue Million Forecast, by Product Type 2019 & 2032
- Table 104: Global Lactose Free Food Industry Volume K Tons Forecast, by Product Type 2019 & 2032
- Table 105: Global Lactose Free Food Industry Revenue Million Forecast, by Labeling Type 2019 & 2032
- Table 106: Global Lactose Free Food Industry Volume K Tons Forecast, by Labeling Type 2019 & 2032
- Table 107: Global Lactose Free Food Industry Revenue Million Forecast, by Distribution Channel 2019 & 2032
- Table 108: Global Lactose Free Food Industry Volume K Tons Forecast, by Distribution Channel 2019 & 2032
- Table 109: Global Lactose Free Food Industry Revenue Million Forecast, by Country 2019 & 2032
- Table 110: Global Lactose Free Food Industry Volume K Tons Forecast, by Country 2019 & 2032
- Table 111: China Lactose Free Food Industry Revenue (Million) Forecast, by Application 2019 & 2032
- Table 112: China Lactose Free Food Industry Volume (K Tons) Forecast, by Application 2019 & 2032
- Table 113: Japan Lactose Free Food Industry Revenue (Million) Forecast, by Application 2019 & 2032
- Table 114: Japan Lactose Free Food Industry Volume (K Tons) Forecast, by Application 2019 & 2032
- Table 115: India Lactose Free Food Industry Revenue (Million) Forecast, by Application 2019 & 2032
- Table 116: India Lactose Free Food Industry Volume (K Tons) Forecast, by Application 2019 & 2032
- Table 117: Australia Lactose Free Food Industry Revenue (Million) Forecast, by Application 2019 & 2032
- Table 118: Australia Lactose Free Food Industry Volume (K Tons) Forecast, by Application 2019 & 2032
- Table 119: Rest of Asia Pacific Lactose Free Food Industry Revenue (Million) Forecast, by Application 2019 & 2032
- Table 120: Rest of Asia Pacific Lactose Free Food Industry Volume (K Tons) Forecast, by Application 2019 & 2032
- Table 121: Global Lactose Free Food Industry Revenue Million Forecast, by Product Type 2019 & 2032
- Table 122: Global Lactose Free Food Industry Volume K Tons Forecast, by Product Type 2019 & 2032
- Table 123: Global Lactose Free Food Industry Revenue Million Forecast, by Labeling Type 2019 & 2032
- Table 124: Global Lactose Free Food Industry Volume K Tons Forecast, by Labeling Type 2019 & 2032
- Table 125: Global Lactose Free Food Industry Revenue Million Forecast, by Distribution Channel 2019 & 2032
- Table 126: Global Lactose Free Food Industry Volume K Tons Forecast, by Distribution Channel 2019 & 2032
- Table 127: Global Lactose Free Food Industry Revenue Million Forecast, by Country 2019 & 2032
- Table 128: Global Lactose Free Food Industry Volume K Tons Forecast, by Country 2019 & 2032
- Table 129: Brazil Lactose Free Food Industry Revenue (Million) Forecast, by Application 2019 & 2032
- Table 130: Brazil Lactose Free Food Industry Volume (K Tons) Forecast, by Application 2019 & 2032
- Table 131: Argentina Lactose Free Food Industry Revenue (Million) Forecast, by Application 2019 & 2032
- Table 132: Argentina Lactose Free Food Industry Volume (K Tons) Forecast, by Application 2019 & 2032
- Table 133: Rest of South America Lactose Free Food Industry Revenue (Million) Forecast, by Application 2019 & 2032
- Table 134: Rest of South America Lactose Free Food Industry Volume (K Tons) Forecast, by Application 2019 & 2032
- Table 135: Global Lactose Free Food Industry Revenue Million Forecast, by Product Type 2019 & 2032
- Table 136: Global Lactose Free Food Industry Volume K Tons Forecast, by Product Type 2019 & 2032
- Table 137: Global Lactose Free Food Industry Revenue Million Forecast, by Labeling Type 2019 & 2032
- Table 138: Global Lactose Free Food Industry Volume K Tons Forecast, by Labeling Type 2019 & 2032
- Table 139: Global Lactose Free Food Industry Revenue Million Forecast, by Distribution Channel 2019 & 2032
- Table 140: Global Lactose Free Food Industry Volume K Tons Forecast, by Distribution Channel 2019 & 2032
- Table 141: Global Lactose Free Food Industry Revenue Million Forecast, by Country 2019 & 2032
- Table 142: Global Lactose Free Food Industry Volume K Tons Forecast, by Country 2019 & 2032
- Table 143: South Africa Lactose Free Food Industry Revenue (Million) Forecast, by Application 2019 & 2032
- Table 144: South Africa Lactose Free Food Industry Volume (K Tons) Forecast, by Application 2019 & 2032
- Table 145: United Arab Emirates Lactose Free Food Industry Revenue (Million) Forecast, by Application 2019 & 2032
- Table 146: United Arab Emirates Lactose Free Food Industry Volume (K Tons) Forecast, by Application 2019 & 2032
- Table 147: Rest of Middle East and Africa Lactose Free Food Industry Revenue (Million) Forecast, by Application 2019 & 2032
- Table 148: Rest of Middle East and Africa Lactose Free Food Industry Volume (K Tons) Forecast, by Application 2019 & 2032
Frequently Asked Questions
1. What is the projected Compound Annual Growth Rate (CAGR) of the Lactose Free Food Industry?
The projected CAGR is approximately 7.79%.
2. Which companies are prominent players in the Lactose Free Food Industry?
Key companies in the market include Reckitt Benckiser Group PLC, The Kellogg Company, Nestle S A, General Mills Inc, Abbott Laboratories, Danone SA, Dr Schar AG / SPA*List Not Exhaustive, Blue Diamond Growers, Oatly Group AB, Beyond Meat.
3. What are the main segments of the Lactose Free Food Industry?
The market segments include Product Type, Labeling Type, Distribution Channel.
4. Can you provide details about the market size?
The market size is estimated to be USD 14,653.5 Million as of 2022.
5. What are some drivers contributing to market growth?
Increasing Demand for Clean Label Ingredients; Growing Health Consciousness of Consumers.
6. What are the notable trends driving market growth?
Surge in Demand of Clean Label and Free From Ingredients.
7. Are there any restraints impacting market growth?
Higher Manufacturing Cost.
8. Can you provide examples of recent developments in the market?
February 2023: Life Health Foods Pvt. Ltd. launched a new vegan drink, So Good Oat unsweetened beverage. The product is plant-based, dairy-free milk that can be used in tea, coffee, baking, and smoothies.
9. What pricing options are available for accessing the report?
Pricing options include single-user, multi-user, and enterprise licenses priced at USD 4750, USD 5250, and USD 8750 respectively.
10. Is the market size provided in terms of value or volume?
The market size is provided in terms of value, measured in Million and volume, measured in K Tons.
11. Are there any specific market keywords associated with the report?
Yes, the market keyword associated with the report is "Lactose Free Food Industry," which aids in identifying and referencing the specific market segment covered.
12. How do I determine which pricing option suits my needs best?
The pricing options vary based on user requirements and access needs. Individual users may opt for single-user licenses, while businesses requiring broader access may choose multi-user or enterprise licenses for cost-effective access to the report.
13. Are there any additional resources or data provided in the Lactose Free Food Industry report?
While the report offers comprehensive insights, it's advisable to review the specific contents or supplementary materials provided to ascertain if additional resources or data are available.
14. How can I stay updated on further developments or reports in the Lactose Free Food Industry?
To stay informed about further developments, trends, and reports in the Lactose Free Food Industry, consider subscribing to industry newsletters, following relevant companies and organizations, or regularly checking reputable industry news sources and publications.
Methodology
Step 1 - Identification of Relevant Samples Size from Population Database


Step 2 - Approaches for Defining Global Market Size (Value, Volume* & Price*)

Note*: In applicable scenarios
Step 3 - Data Sources
Primary Research
- Web Analytics
- Survey Reports
- Research Institute
- Latest Research Reports
- Opinion Leaders
Secondary Research
- Annual Reports
- White Paper
- Latest Press Release
- Industry Association
- Paid Database
- Investor Presentations

Step 4 - Data Triangulation
Involves using different sources of information in order to increase the validity of a study
These sources are likely to be stakeholders in a program - participants, other researchers, program staff, other community members, and so on.
Then we put all data in single framework & apply various statistical tools to find out the dynamic on the market.
During the analysis stage, feedback from the stakeholder groups would be compared to determine areas of agreement as well as areas of divergence


