
Key Insights
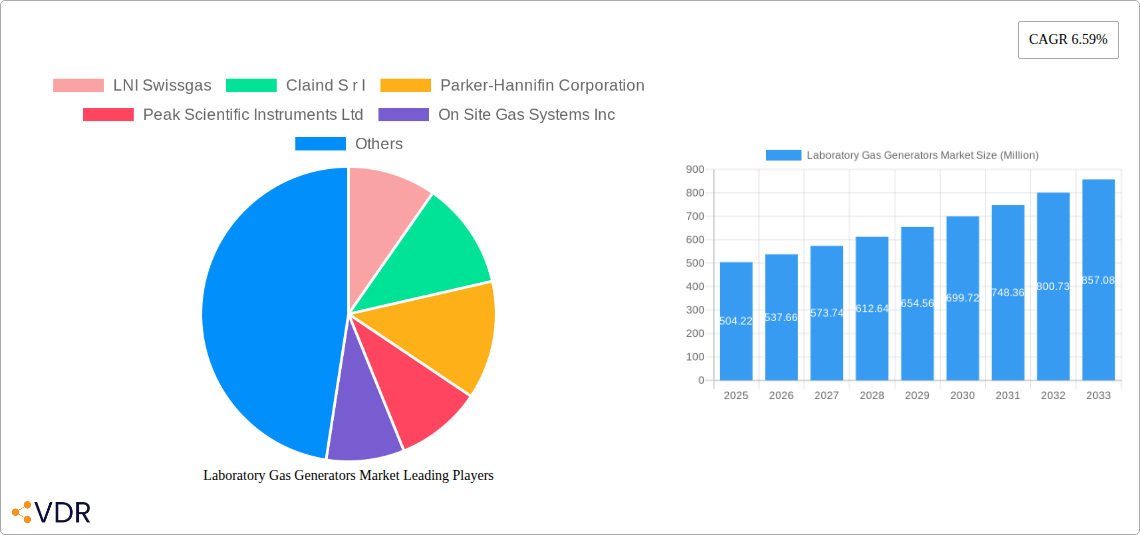
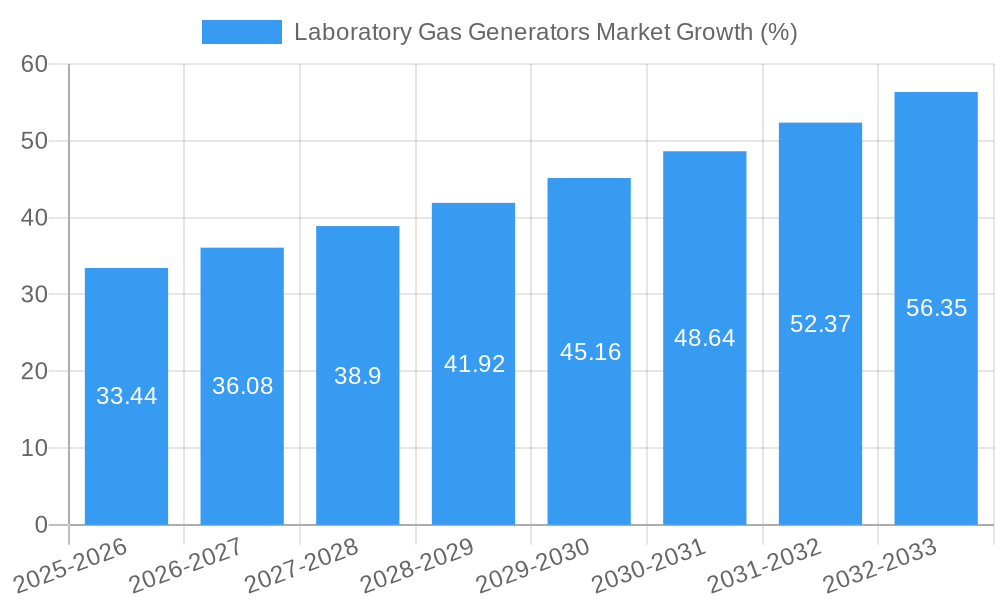
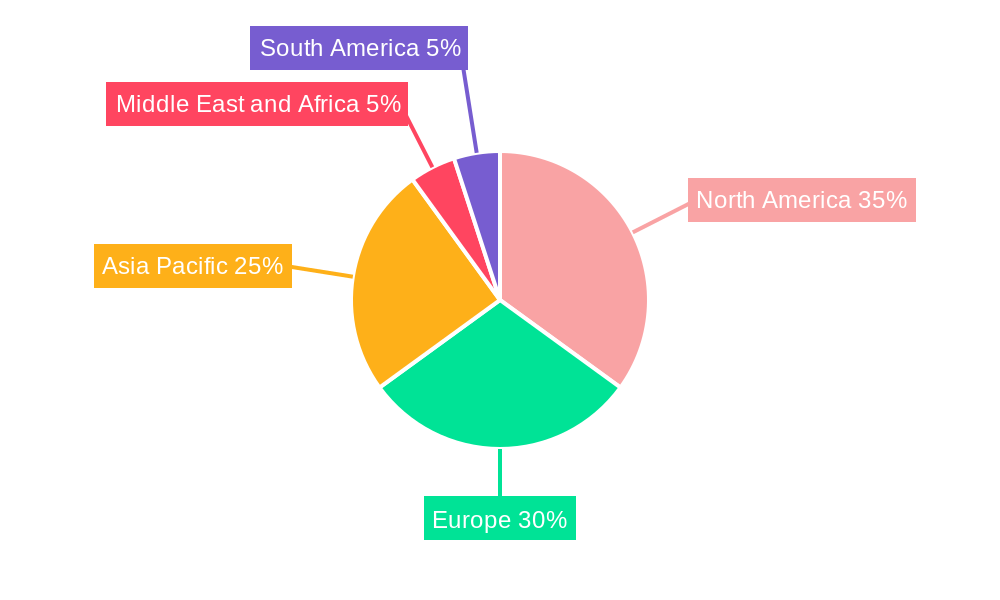
The global Laboratory Gas Generators market, valued at $504.22 million in 2025, is projected to experience robust growth, driven by increasing demand from research institutions, pharmaceutical companies, and biotechnology firms. A Compound Annual Growth Rate (CAGR) of 6.59% from 2025 to 2033 indicates a significant expansion, fueled by several key factors. The rising adoption of advanced analytical techniques and the growing emphasis on automation in laboratories are primary drivers. Furthermore, the increasing prevalence of chronic diseases and the consequent need for sophisticated diagnostic tools are boosting the demand for high-purity gases produced by these generators. The market segmentation reveals strong growth across various gas types, with nitrogen, hydrogen, and zero-air generators dominating, reflecting the diverse needs of different laboratory applications. End-user segments like pharmaceutical and biotech companies exhibit particularly strong growth potential due to their reliance on precise gas control in various processes, including chromatography and mass spectrometry. Geographic analysis shows that North America and Europe currently hold significant market share, though rapidly developing economies in the Asia-Pacific region are poised to become significant growth engines in the coming years. The competitive landscape is characterized by a mix of established players and emerging innovative companies. Competition is focused on offering advanced features like improved gas purity, increased efficiency, and cost-effectiveness.
The market's future growth will be influenced by several factors. Technological advancements leading to smaller, more energy-efficient, and user-friendly generators will be crucial. Stringent regulatory frameworks concerning environmental protection and safety standards will also shape market dynamics. The increasing focus on point-of-use gas generation, minimizing the need for expensive and risky gas cylinder handling, will further propel market expansion. While the initial investment costs might be a restraint for some smaller laboratories, the long-term cost savings associated with on-site generation are increasingly outweighing this concern. The consistent technological improvements in generator performance, along with evolving industry standards, promise continued market growth and significant opportunities for market players.
Laboratory Gas Generators Market: A Comprehensive Report (2019-2033)
This in-depth report provides a comprehensive analysis of the Laboratory Gas Generators Market, encompassing market dynamics, growth trends, regional segmentation, product landscape, key players, and future outlook. The report covers the period from 2019 to 2033, with a focus on the forecast period 2025-2033 and a base year of 2025. The parent market is the broader scientific instrument market, while the child market focuses specifically on gas generation solutions for laboratory applications. The global market size is estimated at xx Million units in 2025.
Laboratory Gas Generators Market Dynamics & Structure
The Laboratory Gas Generators Market is characterized by a moderately concentrated landscape with several key players competing for market share. Technological innovation, particularly in areas such as membrane separation and pressure swing adsorption, is a key driver of market growth. Stringent regulatory frameworks related to gas purity and safety standards significantly influence market dynamics. Competitive product substitutes, such as bottled gas supplies, pose a challenge, but on-site gas generation offers advantages in cost-effectiveness and convenience. End-user demographics are heavily skewed towards research-intensive sectors, with pharmaceutical and biotech companies leading the demand. M&A activity within the industry has been moderate, with a reported xx number of deals in the past five years, resulting in a xx% change in market concentration.
- Market Concentration: Moderately concentrated, with top 5 players holding xx% market share (2024).
- Technological Innovation: Membrane separation and pressure swing adsorption are key drivers.
- Regulatory Frameworks: Stringent safety and purity standards.
- Competitive Substitutes: Bottled gas supplies.
- End-User Demographics: Pharmaceutical, biotech, and chemical sectors dominate.
- M&A Trends: xx number of deals in the past five years (2019-2024).
Laboratory Gas Generators Market Growth Trends & Insights
The Laboratory Gas Generators Market has experienced steady growth over the historical period (2019-2024), with a CAGR of xx%. This growth is primarily attributed to increasing demand from research and development activities in various industries. The adoption rate of on-site gas generation solutions is increasing, driven by factors such as cost savings, improved gas purity, and enhanced convenience. Technological disruptions, such as advancements in membrane technology, are further accelerating market growth. Consumer behavior shifts, such as a preference for sustainable and cost-effective solutions, are also positively influencing market demand. The market is expected to maintain its growth trajectory during the forecast period (2025-2033), with a projected CAGR of xx%, reaching an estimated xx Million units by 2033. Market penetration in developing economies remains relatively low, presenting significant growth potential.
Dominant Regions, Countries, or Segments in Laboratory Gas Generators Market
North America currently holds the largest market share, followed by Europe. The dominance of these regions is attributable to the high concentration of research institutions and pharmaceutical companies. Within the product segments, Nitrogen Gas Generators account for the largest market share (xx%), followed by Hydrogen Gas Generators (xx%). Among end-users, Pharmaceutical and Biotechnological Companies represent the dominant segment (xx%), driven by the stringent quality control requirements within this sector. Key drivers for growth include:
- North America: High R&D investment, robust pharmaceutical industry.
- Europe: Strong presence of research institutions and biotech companies.
- Asia Pacific: Rapid economic growth and increasing R&D spending.
- Nitrogen Gas Generators: Wide applicability across various laboratory applications.
- Pharmaceutical & Biotech: Stringent purity requirements and high demand for gas generators.
Laboratory Gas Generators Market Product Landscape
The Laboratory Gas Generators market offers a diverse range of products, including nitrogen, hydrogen, zero air, and TOC gas generators. Recent innovations focus on enhanced purity, improved reliability, and reduced operational costs. Many generators now incorporate advanced features such as automated monitoring, remote diagnostics, and compact designs for improved workspace efficiency. Key selling propositions include ease of use, low maintenance, and environmentally friendly operation compared to bottled gas. These generators meet various laboratory needs with different purity levels, flow rates, and applications.
Key Drivers, Barriers & Challenges in Laboratory Gas Generators Market
Key Drivers:
- Increasing R&D activities across various industries.
- Growing demand for high-purity gases.
- Advantages of on-site generation over bottled gas supply (cost savings, convenience).
- Technological advancements leading to improved efficiency and reliability.
Challenges & Restraints:
- High initial investment cost for some advanced gas generators.
- Potential maintenance and operational costs.
- Competition from established bottled gas suppliers.
- Stringent regulatory compliance requirements.
- Supply chain disruptions affecting component availability ( xx% impact on production in 2022)
Emerging Opportunities in Laboratory Gas Generators Market
- Expansion into emerging markets with growing research infrastructure.
- Development of specialized gas generators for niche applications (e.g., single-use generators).
- Growing adoption of digital technologies for remote monitoring and predictive maintenance.
- Focus on sustainable and environmentally friendly gas generation solutions.
Growth Accelerators in the Laboratory Gas Generators Market Industry
Strategic partnerships between gas generator manufacturers and laboratory equipment suppliers are expected to drive growth. Continued technological advancements, particularly in membrane technology and pressure swing adsorption, will enhance the efficiency and cost-effectiveness of gas generators. Expanding into new markets, particularly in developing economies with growing R&D activities, will also contribute to market expansion. Moreover, a focus on providing comprehensive service and support packages will enhance customer satisfaction and loyalty.
Key Players Shaping the Laboratory Gas Generators Market Market
- LNI Swissgas
- Claind S r l
- Parker-Hannifin Corporation
- Peak Scientific Instruments Ltd
- On Site Gas Systems Inc
- Oxymat A/S
- Isolcell S p A
- ErreDue spa
- Linde Plc (Praxair Technology Inc)
- F-Dgsi
- Valco Instruments Company Inc (VICI DBS SRL)
- Labtech S R L
- Nel ASA
Notable Milestones in Laboratory Gas Generators Market Sector
- June 2022: LNI launched its new product, the HG MINI hydrogen generator, featuring an innovative static drying system.
- March 2022: PEAK Scientific expanded its manufacturing facilities in Glasgow, increasing production capacity.
In-Depth Laboratory Gas Generators Market Market Outlook
The Laboratory Gas Generators Market is poised for significant growth over the forecast period, driven by factors such as increasing R&D investments, technological advancements, and expanding applications across various industries. Strategic partnerships, focused innovation, and expansion into untapped markets will further enhance market potential. Companies that can effectively leverage these growth drivers and address the challenges related to cost, regulatory compliance, and competition will be best positioned to succeed in this dynamic market.
Laboratory Gas Generators Market Segmentation
-
1. Type
- 1.1. Nitrogen Gas Generators
- 1.2. Hydrogen Gas Generators
- 1.3. Zero Air Generators
- 1.4. TOC Gas Generators
- 1.5. Other Gas Generators
-
2. End User
- 2.1. Food and Beverage Companies
- 2.2. Chemical and Petrochemical Companies
- 2.3. Pharmaceutical and Biotechnological Companies
Laboratory Gas Generators Market Segmentation By Geography
-
1. North America
- 1.1. United States
- 1.2. Canada
- 1.3. Mexico
-
2. Europe
- 2.1. Germany
- 2.2. United Kingdom
- 2.3. France
- 2.4. Italy
- 2.5. Spain
- 2.6. Rest of Europe
-
3. Asia Pacific
- 3.1. China
- 3.2. Japan
- 3.3. India
- 3.4. Australia
- 3.5. South Korea
- 3.6. Rest of Asia Pacific
-
4. Middle East and Africa
- 4.1. GCC
- 4.2. South Africa
- 4.3. Rest of Middle East and Africa
-
5. South America
- 5.1. Brazil
- 5.2. Argentina
- 5.3. Rest of South America
Laboratory Gas Generators Market REPORT HIGHLIGHTS
| Aspects | Details |
|---|---|
| Study Period | 2019-2033 |
| Base Year | 2024 |
| Estimated Year | 2025 |
| Forecast Period | 2025-2033 |
| Historical Period | 2019-2024 |
| Growth Rate | CAGR of 6.59% from 2019-2033 |
| Segmentation |
|
Table of Contents
- 1. Introduction
- 1.1. Research Scope
- 1.2. Market Segmentation
- 1.3. Research Methodology
- 1.4. Definitions and Assumptions
- 2. Executive Summary
- 2.1. Introduction
- 3. Market Dynamics
- 3.1. Introduction
- 3.2. Market Drivers
- 3.2.1. Rising Safety Concerns Related to the Use of Conventional Gas Cylinders; Growing Importance of Analytical Techniques in Drug and Food Approval Processes; Increasing R&D Spending in Target Industries
- 3.3. Market Restrains
- 3.3.1. Reluctance to Replace Conventional Gas Supply Methods; Lack of Skilled Personnel
- 3.4. Market Trends
- 3.4.1. Nitrogen Gas Generators is Expected to Hold Significant Share in the Market Over the Forecast Period
- 4. Market Factor Analysis
- 4.1. Porters Five Forces
- 4.2. Supply/Value Chain
- 4.3. PESTEL analysis
- 4.4. Market Entropy
- 4.5. Patent/Trademark Analysis
- 5. Global Laboratory Gas Generators Market Analysis, Insights and Forecast, 2019-2031
- 5.1. Market Analysis, Insights and Forecast - by Type
- 5.1.1. Nitrogen Gas Generators
- 5.1.2. Hydrogen Gas Generators
- 5.1.3. Zero Air Generators
- 5.1.4. TOC Gas Generators
- 5.1.5. Other Gas Generators
- 5.2. Market Analysis, Insights and Forecast - by End User
- 5.2.1. Food and Beverage Companies
- 5.2.2. Chemical and Petrochemical Companies
- 5.2.3. Pharmaceutical and Biotechnological Companies
- 5.3. Market Analysis, Insights and Forecast - by Region
- 5.3.1. North America
- 5.3.2. Europe
- 5.3.3. Asia Pacific
- 5.3.4. Middle East and Africa
- 5.3.5. South America
- 5.1. Market Analysis, Insights and Forecast - by Type
- 6. North America Laboratory Gas Generators Market Analysis, Insights and Forecast, 2019-2031
- 6.1. Market Analysis, Insights and Forecast - by Type
- 6.1.1. Nitrogen Gas Generators
- 6.1.2. Hydrogen Gas Generators
- 6.1.3. Zero Air Generators
- 6.1.4. TOC Gas Generators
- 6.1.5. Other Gas Generators
- 6.2. Market Analysis, Insights and Forecast - by End User
- 6.2.1. Food and Beverage Companies
- 6.2.2. Chemical and Petrochemical Companies
- 6.2.3. Pharmaceutical and Biotechnological Companies
- 6.1. Market Analysis, Insights and Forecast - by Type
- 7. Europe Laboratory Gas Generators Market Analysis, Insights and Forecast, 2019-2031
- 7.1. Market Analysis, Insights and Forecast - by Type
- 7.1.1. Nitrogen Gas Generators
- 7.1.2. Hydrogen Gas Generators
- 7.1.3. Zero Air Generators
- 7.1.4. TOC Gas Generators
- 7.1.5. Other Gas Generators
- 7.2. Market Analysis, Insights and Forecast - by End User
- 7.2.1. Food and Beverage Companies
- 7.2.2. Chemical and Petrochemical Companies
- 7.2.3. Pharmaceutical and Biotechnological Companies
- 7.1. Market Analysis, Insights and Forecast - by Type
- 8. Asia Pacific Laboratory Gas Generators Market Analysis, Insights and Forecast, 2019-2031
- 8.1. Market Analysis, Insights and Forecast - by Type
- 8.1.1. Nitrogen Gas Generators
- 8.1.2. Hydrogen Gas Generators
- 8.1.3. Zero Air Generators
- 8.1.4. TOC Gas Generators
- 8.1.5. Other Gas Generators
- 8.2. Market Analysis, Insights and Forecast - by End User
- 8.2.1. Food and Beverage Companies
- 8.2.2. Chemical and Petrochemical Companies
- 8.2.3. Pharmaceutical and Biotechnological Companies
- 8.1. Market Analysis, Insights and Forecast - by Type
- 9. Middle East and Africa Laboratory Gas Generators Market Analysis, Insights and Forecast, 2019-2031
- 9.1. Market Analysis, Insights and Forecast - by Type
- 9.1.1. Nitrogen Gas Generators
- 9.1.2. Hydrogen Gas Generators
- 9.1.3. Zero Air Generators
- 9.1.4. TOC Gas Generators
- 9.1.5. Other Gas Generators
- 9.2. Market Analysis, Insights and Forecast - by End User
- 9.2.1. Food and Beverage Companies
- 9.2.2. Chemical and Petrochemical Companies
- 9.2.3. Pharmaceutical and Biotechnological Companies
- 9.1. Market Analysis, Insights and Forecast - by Type
- 10. South America Laboratory Gas Generators Market Analysis, Insights and Forecast, 2019-2031
- 10.1. Market Analysis, Insights and Forecast - by Type
- 10.1.1. Nitrogen Gas Generators
- 10.1.2. Hydrogen Gas Generators
- 10.1.3. Zero Air Generators
- 10.1.4. TOC Gas Generators
- 10.1.5. Other Gas Generators
- 10.2. Market Analysis, Insights and Forecast - by End User
- 10.2.1. Food and Beverage Companies
- 10.2.2. Chemical and Petrochemical Companies
- 10.2.3. Pharmaceutical and Biotechnological Companies
- 10.1. Market Analysis, Insights and Forecast - by Type
- 11. North America Laboratory Gas Generators Market Analysis, Insights and Forecast, 2019-2031
- 11.1. Market Analysis, Insights and Forecast - By Country/Sub-region
- 11.1.1 United States
- 11.1.2 Canada
- 11.1.3 Mexico
- 12. Europe Laboratory Gas Generators Market Analysis, Insights and Forecast, 2019-2031
- 12.1. Market Analysis, Insights and Forecast - By Country/Sub-region
- 12.1.1 Germany
- 12.1.2 United Kingdom
- 12.1.3 France
- 12.1.4 Italy
- 12.1.5 Spain
- 12.1.6 Rest of Europe
- 13. Asia Pacific Laboratory Gas Generators Market Analysis, Insights and Forecast, 2019-2031
- 13.1. Market Analysis, Insights and Forecast - By Country/Sub-region
- 13.1.1 China
- 13.1.2 Japan
- 13.1.3 India
- 13.1.4 Australia
- 13.1.5 South Korea
- 13.1.6 Rest of Asia Pacific
- 14. Middle East and Africa Laboratory Gas Generators Market Analysis, Insights and Forecast, 2019-2031
- 14.1. Market Analysis, Insights and Forecast - By Country/Sub-region
- 14.1.1 GCC
- 14.1.2 South Africa
- 14.1.3 Rest of Middle East and Africa
- 15. South America Laboratory Gas Generators Market Analysis, Insights and Forecast, 2019-2031
- 15.1. Market Analysis, Insights and Forecast - By Country/Sub-region
- 15.1.1 Brazil
- 15.1.2 Argentina
- 15.1.3 Rest of South America
- 16. Competitive Analysis
- 16.1. Global Market Share Analysis 2024
- 16.2. Company Profiles
- 16.2.1 LNI Swissgas
- 16.2.1.1. Overview
- 16.2.1.2. Products
- 16.2.1.3. SWOT Analysis
- 16.2.1.4. Recent Developments
- 16.2.1.5. Financials (Based on Availability)
- 16.2.2 Claind S r l
- 16.2.2.1. Overview
- 16.2.2.2. Products
- 16.2.2.3. SWOT Analysis
- 16.2.2.4. Recent Developments
- 16.2.2.5. Financials (Based on Availability)
- 16.2.3 Parker-Hannifin Corporation
- 16.2.3.1. Overview
- 16.2.3.2. Products
- 16.2.3.3. SWOT Analysis
- 16.2.3.4. Recent Developments
- 16.2.3.5. Financials (Based on Availability)
- 16.2.4 Peak Scientific Instruments Ltd
- 16.2.4.1. Overview
- 16.2.4.2. Products
- 16.2.4.3. SWOT Analysis
- 16.2.4.4. Recent Developments
- 16.2.4.5. Financials (Based on Availability)
- 16.2.5 On Site Gas Systems Inc
- 16.2.5.1. Overview
- 16.2.5.2. Products
- 16.2.5.3. SWOT Analysis
- 16.2.5.4. Recent Developments
- 16.2.5.5. Financials (Based on Availability)
- 16.2.6 Oxymat A/S*List Not Exhaustive
- 16.2.6.1. Overview
- 16.2.6.2. Products
- 16.2.6.3. SWOT Analysis
- 16.2.6.4. Recent Developments
- 16.2.6.5. Financials (Based on Availability)
- 16.2.7 Isolcell S p A
- 16.2.7.1. Overview
- 16.2.7.2. Products
- 16.2.7.3. SWOT Analysis
- 16.2.7.4. Recent Developments
- 16.2.7.5. Financials (Based on Availability)
- 16.2.8 ErreDue spa
- 16.2.8.1. Overview
- 16.2.8.2. Products
- 16.2.8.3. SWOT Analysis
- 16.2.8.4. Recent Developments
- 16.2.8.5. Financials (Based on Availability)
- 16.2.9 Linde Plc (Praxair Technology Inc )
- 16.2.9.1. Overview
- 16.2.9.2. Products
- 16.2.9.3. SWOT Analysis
- 16.2.9.4. Recent Developments
- 16.2.9.5. Financials (Based on Availability)
- 16.2.10 F-Dgsi
- 16.2.10.1. Overview
- 16.2.10.2. Products
- 16.2.10.3. SWOT Analysis
- 16.2.10.4. Recent Developments
- 16.2.10.5. Financials (Based on Availability)
- 16.2.11 Valco InstrumenValco Instruments Company Inc (VICI DBS SRL)
- 16.2.11.1. Overview
- 16.2.11.2. Products
- 16.2.11.3. SWOT Analysis
- 16.2.11.4. Recent Developments
- 16.2.11.5. Financials (Based on Availability)
- 16.2.12 Labtech S R L
- 16.2.12.1. Overview
- 16.2.12.2. Products
- 16.2.12.3. SWOT Analysis
- 16.2.12.4. Recent Developments
- 16.2.12.5. Financials (Based on Availability)
- 16.2.13 Nel ASA
- 16.2.13.1. Overview
- 16.2.13.2. Products
- 16.2.13.3. SWOT Analysis
- 16.2.13.4. Recent Developments
- 16.2.13.5. Financials (Based on Availability)
- 16.2.1 LNI Swissgas
List of Figures
- Figure 1: Global Laboratory Gas Generators Market Revenue Breakdown (Million, %) by Region 2024 & 2032
- Figure 2: North America Laboratory Gas Generators Market Revenue (Million), by Country 2024 & 2032
- Figure 3: North America Laboratory Gas Generators Market Revenue Share (%), by Country 2024 & 2032
- Figure 4: Europe Laboratory Gas Generators Market Revenue (Million), by Country 2024 & 2032
- Figure 5: Europe Laboratory Gas Generators Market Revenue Share (%), by Country 2024 & 2032
- Figure 6: Asia Pacific Laboratory Gas Generators Market Revenue (Million), by Country 2024 & 2032
- Figure 7: Asia Pacific Laboratory Gas Generators Market Revenue Share (%), by Country 2024 & 2032
- Figure 8: Middle East and Africa Laboratory Gas Generators Market Revenue (Million), by Country 2024 & 2032
- Figure 9: Middle East and Africa Laboratory Gas Generators Market Revenue Share (%), by Country 2024 & 2032
- Figure 10: South America Laboratory Gas Generators Market Revenue (Million), by Country 2024 & 2032
- Figure 11: South America Laboratory Gas Generators Market Revenue Share (%), by Country 2024 & 2032
- Figure 12: North America Laboratory Gas Generators Market Revenue (Million), by Type 2024 & 2032
- Figure 13: North America Laboratory Gas Generators Market Revenue Share (%), by Type 2024 & 2032
- Figure 14: North America Laboratory Gas Generators Market Revenue (Million), by End User 2024 & 2032
- Figure 15: North America Laboratory Gas Generators Market Revenue Share (%), by End User 2024 & 2032
- Figure 16: North America Laboratory Gas Generators Market Revenue (Million), by Country 2024 & 2032
- Figure 17: North America Laboratory Gas Generators Market Revenue Share (%), by Country 2024 & 2032
- Figure 18: Europe Laboratory Gas Generators Market Revenue (Million), by Type 2024 & 2032
- Figure 19: Europe Laboratory Gas Generators Market Revenue Share (%), by Type 2024 & 2032
- Figure 20: Europe Laboratory Gas Generators Market Revenue (Million), by End User 2024 & 2032
- Figure 21: Europe Laboratory Gas Generators Market Revenue Share (%), by End User 2024 & 2032
- Figure 22: Europe Laboratory Gas Generators Market Revenue (Million), by Country 2024 & 2032
- Figure 23: Europe Laboratory Gas Generators Market Revenue Share (%), by Country 2024 & 2032
- Figure 24: Asia Pacific Laboratory Gas Generators Market Revenue (Million), by Type 2024 & 2032
- Figure 25: Asia Pacific Laboratory Gas Generators Market Revenue Share (%), by Type 2024 & 2032
- Figure 26: Asia Pacific Laboratory Gas Generators Market Revenue (Million), by End User 2024 & 2032
- Figure 27: Asia Pacific Laboratory Gas Generators Market Revenue Share (%), by End User 2024 & 2032
- Figure 28: Asia Pacific Laboratory Gas Generators Market Revenue (Million), by Country 2024 & 2032
- Figure 29: Asia Pacific Laboratory Gas Generators Market Revenue Share (%), by Country 2024 & 2032
- Figure 30: Middle East and Africa Laboratory Gas Generators Market Revenue (Million), by Type 2024 & 2032
- Figure 31: Middle East and Africa Laboratory Gas Generators Market Revenue Share (%), by Type 2024 & 2032
- Figure 32: Middle East and Africa Laboratory Gas Generators Market Revenue (Million), by End User 2024 & 2032
- Figure 33: Middle East and Africa Laboratory Gas Generators Market Revenue Share (%), by End User 2024 & 2032
- Figure 34: Middle East and Africa Laboratory Gas Generators Market Revenue (Million), by Country 2024 & 2032
- Figure 35: Middle East and Africa Laboratory Gas Generators Market Revenue Share (%), by Country 2024 & 2032
- Figure 36: South America Laboratory Gas Generators Market Revenue (Million), by Type 2024 & 2032
- Figure 37: South America Laboratory Gas Generators Market Revenue Share (%), by Type 2024 & 2032
- Figure 38: South America Laboratory Gas Generators Market Revenue (Million), by End User 2024 & 2032
- Figure 39: South America Laboratory Gas Generators Market Revenue Share (%), by End User 2024 & 2032
- Figure 40: South America Laboratory Gas Generators Market Revenue (Million), by Country 2024 & 2032
- Figure 41: South America Laboratory Gas Generators Market Revenue Share (%), by Country 2024 & 2032
List of Tables
- Table 1: Global Laboratory Gas Generators Market Revenue Million Forecast, by Region 2019 & 2032
- Table 2: Global Laboratory Gas Generators Market Revenue Million Forecast, by Type 2019 & 2032
- Table 3: Global Laboratory Gas Generators Market Revenue Million Forecast, by End User 2019 & 2032
- Table 4: Global Laboratory Gas Generators Market Revenue Million Forecast, by Region 2019 & 2032
- Table 5: Global Laboratory Gas Generators Market Revenue Million Forecast, by Country 2019 & 2032
- Table 6: United States Laboratory Gas Generators Market Revenue (Million) Forecast, by Application 2019 & 2032
- Table 7: Canada Laboratory Gas Generators Market Revenue (Million) Forecast, by Application 2019 & 2032
- Table 8: Mexico Laboratory Gas Generators Market Revenue (Million) Forecast, by Application 2019 & 2032
- Table 9: Global Laboratory Gas Generators Market Revenue Million Forecast, by Country 2019 & 2032
- Table 10: Germany Laboratory Gas Generators Market Revenue (Million) Forecast, by Application 2019 & 2032
- Table 11: United Kingdom Laboratory Gas Generators Market Revenue (Million) Forecast, by Application 2019 & 2032
- Table 12: France Laboratory Gas Generators Market Revenue (Million) Forecast, by Application 2019 & 2032
- Table 13: Italy Laboratory Gas Generators Market Revenue (Million) Forecast, by Application 2019 & 2032
- Table 14: Spain Laboratory Gas Generators Market Revenue (Million) Forecast, by Application 2019 & 2032
- Table 15: Rest of Europe Laboratory Gas Generators Market Revenue (Million) Forecast, by Application 2019 & 2032
- Table 16: Global Laboratory Gas Generators Market Revenue Million Forecast, by Country 2019 & 2032
- Table 17: China Laboratory Gas Generators Market Revenue (Million) Forecast, by Application 2019 & 2032
- Table 18: Japan Laboratory Gas Generators Market Revenue (Million) Forecast, by Application 2019 & 2032
- Table 19: India Laboratory Gas Generators Market Revenue (Million) Forecast, by Application 2019 & 2032
- Table 20: Australia Laboratory Gas Generators Market Revenue (Million) Forecast, by Application 2019 & 2032
- Table 21: South Korea Laboratory Gas Generators Market Revenue (Million) Forecast, by Application 2019 & 2032
- Table 22: Rest of Asia Pacific Laboratory Gas Generators Market Revenue (Million) Forecast, by Application 2019 & 2032
- Table 23: Global Laboratory Gas Generators Market Revenue Million Forecast, by Country 2019 & 2032
- Table 24: GCC Laboratory Gas Generators Market Revenue (Million) Forecast, by Application 2019 & 2032
- Table 25: South Africa Laboratory Gas Generators Market Revenue (Million) Forecast, by Application 2019 & 2032
- Table 26: Rest of Middle East and Africa Laboratory Gas Generators Market Revenue (Million) Forecast, by Application 2019 & 2032
- Table 27: Global Laboratory Gas Generators Market Revenue Million Forecast, by Country 2019 & 2032
- Table 28: Brazil Laboratory Gas Generators Market Revenue (Million) Forecast, by Application 2019 & 2032
- Table 29: Argentina Laboratory Gas Generators Market Revenue (Million) Forecast, by Application 2019 & 2032
- Table 30: Rest of South America Laboratory Gas Generators Market Revenue (Million) Forecast, by Application 2019 & 2032
- Table 31: Global Laboratory Gas Generators Market Revenue Million Forecast, by Type 2019 & 2032
- Table 32: Global Laboratory Gas Generators Market Revenue Million Forecast, by End User 2019 & 2032
- Table 33: Global Laboratory Gas Generators Market Revenue Million Forecast, by Country 2019 & 2032
- Table 34: United States Laboratory Gas Generators Market Revenue (Million) Forecast, by Application 2019 & 2032
- Table 35: Canada Laboratory Gas Generators Market Revenue (Million) Forecast, by Application 2019 & 2032
- Table 36: Mexico Laboratory Gas Generators Market Revenue (Million) Forecast, by Application 2019 & 2032
- Table 37: Global Laboratory Gas Generators Market Revenue Million Forecast, by Type 2019 & 2032
- Table 38: Global Laboratory Gas Generators Market Revenue Million Forecast, by End User 2019 & 2032
- Table 39: Global Laboratory Gas Generators Market Revenue Million Forecast, by Country 2019 & 2032
- Table 40: Germany Laboratory Gas Generators Market Revenue (Million) Forecast, by Application 2019 & 2032
- Table 41: United Kingdom Laboratory Gas Generators Market Revenue (Million) Forecast, by Application 2019 & 2032
- Table 42: France Laboratory Gas Generators Market Revenue (Million) Forecast, by Application 2019 & 2032
- Table 43: Italy Laboratory Gas Generators Market Revenue (Million) Forecast, by Application 2019 & 2032
- Table 44: Spain Laboratory Gas Generators Market Revenue (Million) Forecast, by Application 2019 & 2032
- Table 45: Rest of Europe Laboratory Gas Generators Market Revenue (Million) Forecast, by Application 2019 & 2032
- Table 46: Global Laboratory Gas Generators Market Revenue Million Forecast, by Type 2019 & 2032
- Table 47: Global Laboratory Gas Generators Market Revenue Million Forecast, by End User 2019 & 2032
- Table 48: Global Laboratory Gas Generators Market Revenue Million Forecast, by Country 2019 & 2032
- Table 49: China Laboratory Gas Generators Market Revenue (Million) Forecast, by Application 2019 & 2032
- Table 50: Japan Laboratory Gas Generators Market Revenue (Million) Forecast, by Application 2019 & 2032
- Table 51: India Laboratory Gas Generators Market Revenue (Million) Forecast, by Application 2019 & 2032
- Table 52: Australia Laboratory Gas Generators Market Revenue (Million) Forecast, by Application 2019 & 2032
- Table 53: South Korea Laboratory Gas Generators Market Revenue (Million) Forecast, by Application 2019 & 2032
- Table 54: Rest of Asia Pacific Laboratory Gas Generators Market Revenue (Million) Forecast, by Application 2019 & 2032
- Table 55: Global Laboratory Gas Generators Market Revenue Million Forecast, by Type 2019 & 2032
- Table 56: Global Laboratory Gas Generators Market Revenue Million Forecast, by End User 2019 & 2032
- Table 57: Global Laboratory Gas Generators Market Revenue Million Forecast, by Country 2019 & 2032
- Table 58: GCC Laboratory Gas Generators Market Revenue (Million) Forecast, by Application 2019 & 2032
- Table 59: South Africa Laboratory Gas Generators Market Revenue (Million) Forecast, by Application 2019 & 2032
- Table 60: Rest of Middle East and Africa Laboratory Gas Generators Market Revenue (Million) Forecast, by Application 2019 & 2032
- Table 61: Global Laboratory Gas Generators Market Revenue Million Forecast, by Type 2019 & 2032
- Table 62: Global Laboratory Gas Generators Market Revenue Million Forecast, by End User 2019 & 2032
- Table 63: Global Laboratory Gas Generators Market Revenue Million Forecast, by Country 2019 & 2032
- Table 64: Brazil Laboratory Gas Generators Market Revenue (Million) Forecast, by Application 2019 & 2032
- Table 65: Argentina Laboratory Gas Generators Market Revenue (Million) Forecast, by Application 2019 & 2032
- Table 66: Rest of South America Laboratory Gas Generators Market Revenue (Million) Forecast, by Application 2019 & 2032
Frequently Asked Questions
1. What is the projected Compound Annual Growth Rate (CAGR) of the Laboratory Gas Generators Market?
The projected CAGR is approximately 6.59%.
2. Which companies are prominent players in the Laboratory Gas Generators Market?
Key companies in the market include LNI Swissgas, Claind S r l, Parker-Hannifin Corporation, Peak Scientific Instruments Ltd, On Site Gas Systems Inc, Oxymat A/S*List Not Exhaustive, Isolcell S p A, ErreDue spa, Linde Plc (Praxair Technology Inc ), F-Dgsi, Valco InstrumenValco Instruments Company Inc (VICI DBS SRL), Labtech S R L, Nel ASA.
3. What are the main segments of the Laboratory Gas Generators Market?
The market segments include Type, End User.
4. Can you provide details about the market size?
The market size is estimated to be USD 504.22 Million as of 2022.
5. What are some drivers contributing to market growth?
Rising Safety Concerns Related to the Use of Conventional Gas Cylinders; Growing Importance of Analytical Techniques in Drug and Food Approval Processes; Increasing R&D Spending in Target Industries.
6. What are the notable trends driving market growth?
Nitrogen Gas Generators is Expected to Hold Significant Share in the Market Over the Forecast Period.
7. Are there any restraints impacting market growth?
Reluctance to Replace Conventional Gas Supply Methods; Lack of Skilled Personnel.
8. Can you provide examples of recent developments in the market?
June 2022- LNI launched its new product, the HG MINI hydrogen generator. It has an innovative static drying system that ensures the maximum grade of hydrogen purity and protects the GC with its humidity safeguard.
9. What pricing options are available for accessing the report?
Pricing options include single-user, multi-user, and enterprise licenses priced at USD 4750, USD 5250, and USD 8750 respectively.
10. Is the market size provided in terms of value or volume?
The market size is provided in terms of value, measured in Million.
11. Are there any specific market keywords associated with the report?
Yes, the market keyword associated with the report is "Laboratory Gas Generators Market," which aids in identifying and referencing the specific market segment covered.
12. How do I determine which pricing option suits my needs best?
The pricing options vary based on user requirements and access needs. Individual users may opt for single-user licenses, while businesses requiring broader access may choose multi-user or enterprise licenses for cost-effective access to the report.
13. Are there any additional resources or data provided in the Laboratory Gas Generators Market report?
While the report offers comprehensive insights, it's advisable to review the specific contents or supplementary materials provided to ascertain if additional resources or data are available.
14. How can I stay updated on further developments or reports in the Laboratory Gas Generators Market?
To stay informed about further developments, trends, and reports in the Laboratory Gas Generators Market, consider subscribing to industry newsletters, following relevant companies and organizations, or regularly checking reputable industry news sources and publications.
Methodology
Step 1 - Identification of Relevant Samples Size from Population Database


Step 2 - Approaches for Defining Global Market Size (Value, Volume* & Price*)

Note*: In applicable scenarios
Step 3 - Data Sources
Primary Research
- Web Analytics
- Survey Reports
- Research Institute
- Latest Research Reports
- Opinion Leaders
Secondary Research
- Annual Reports
- White Paper
- Latest Press Release
- Industry Association
- Paid Database
- Investor Presentations

Step 4 - Data Triangulation
Involves using different sources of information in order to increase the validity of a study
These sources are likely to be stakeholders in a program - participants, other researchers, program staff, other community members, and so on.
Then we put all data in single framework & apply various statistical tools to find out the dynamic on the market.
During the analysis stage, feedback from the stakeholder groups would be compared to determine areas of agreement as well as areas of divergence


