

Key Insights
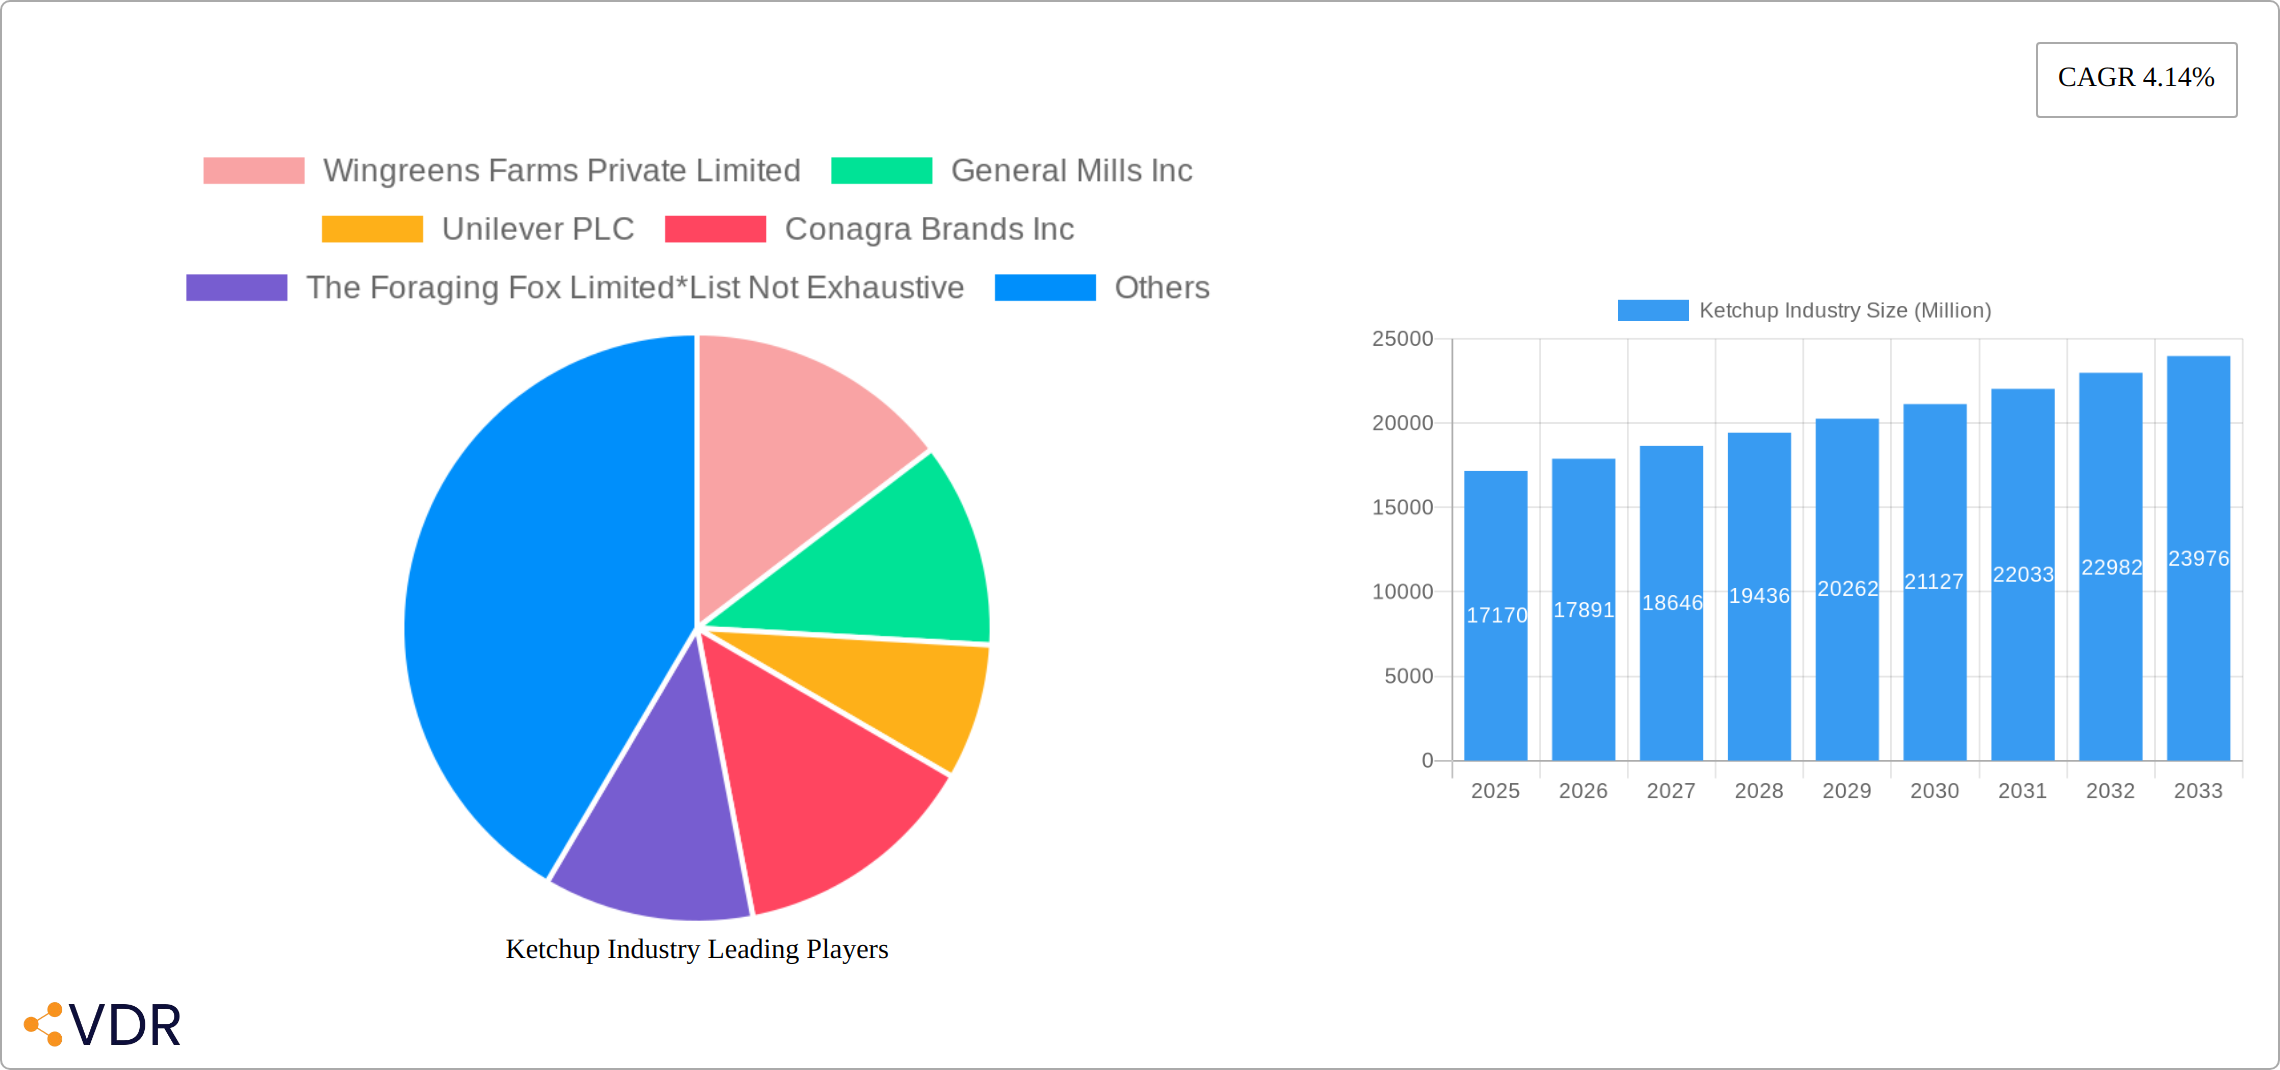
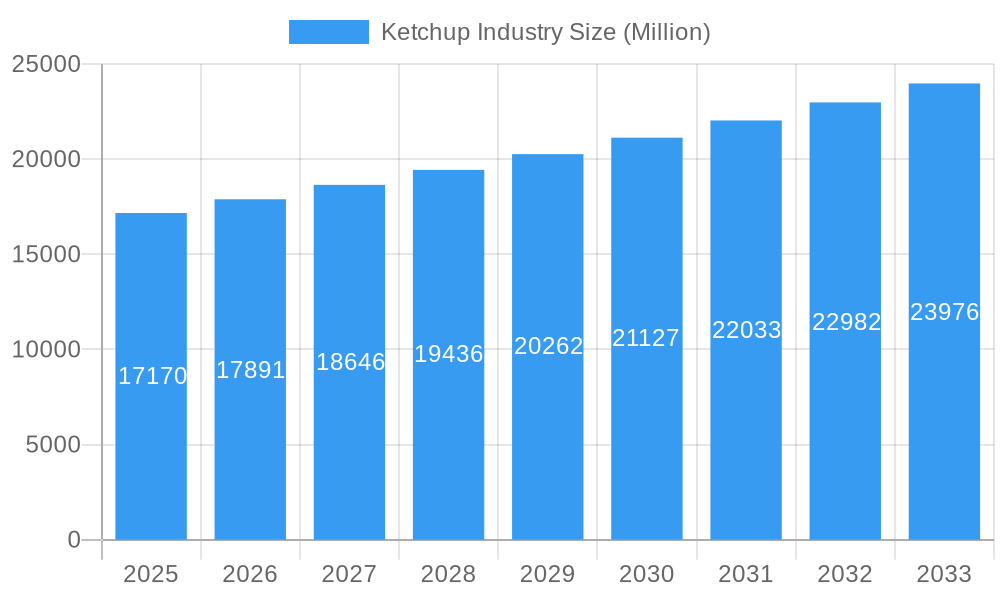
The global ketchup market, valued at $17.17 billion in 2025, is projected to experience steady growth, exhibiting a Compound Annual Growth Rate (CAGR) of 4.14% from 2025 to 2033. This growth is fueled by several key drivers. The rising popularity of fast food and processed foods globally significantly boosts ketchup demand. Consumer preference for convenient and readily available condiments continues to drive sales. Furthermore, the increasing adoption of diverse ketchup flavors beyond the traditional tomato variety, such as spicy, sweet chili, and even organic options, is expanding the market's appeal and attracting new consumer segments. Innovation in packaging, particularly the shift towards single-serve pouches and convenient sizes, contributes to market expansion, particularly within the on-trade (foodservice) sector. Major players like Kraft Heinz, Unilever, and McCormick & Company are leveraging their extensive distribution networks and established brands to maintain market leadership, while smaller, niche players are focusing on organic and specialty ketchup varieties to capture a share of the growing premium segment. Geographic expansion, particularly in developing economies with rising disposable incomes, further presents opportunities for market growth.
Ketchup Industry Market Size (In Billion)
However, certain restraints impact market expansion. Fluctuations in raw material prices, particularly tomatoes, can directly influence production costs and profitability. Growing health consciousness among consumers might lead to a reduced consumption of high-sugar and high-sodium condiments, necessitating innovation in healthier formulations. Stringent regulations regarding food additives and preservatives also pose challenges for manufacturers. The competitive landscape, marked by both large multinational corporations and smaller regional brands, necessitates continuous product innovation and efficient supply chain management to maintain competitiveness. The market is segmented by product type (regular, flavored), packaging (bottled, pouch), and distribution channel (on-trade, off-trade), reflecting diverse consumer preferences and purchasing behaviors. North America currently holds a significant market share, but Asia-Pacific is poised for substantial growth due to rising disposable incomes and changing dietary habits.
Ketchup Industry Company Market Share
Ketchup Industry Market Report: 2019-2033
This comprehensive report provides an in-depth analysis of the global ketchup industry, encompassing market dynamics, growth trends, competitive landscape, and future outlook. The study period covers 2019-2033, with 2025 as the base and estimated year. The report leverages extensive primary and secondary research to deliver actionable insights for industry professionals, investors, and stakeholders. This report covers both parent and child markets, offering a granular understanding of the ketchup market segmented by product type (Regular Ketchup, Flavored Ketchup), packaging (Bottled, Pouch), and distribution channel (On-trade, Off-trade).
Ketchup Industry Market Dynamics & Structure
The ketchup market is characterized by a dynamic interplay of established giants and agile disruptors. While major players command significant market share, a vibrant ecosystem of smaller, specialized companies is actively innovating, particularly in the realm of novel flavor profiles and environmentally conscious packaging solutions. This evolution is significantly influenced by shifting consumer preferences, with a growing appetite for healthier formulations, adventurous taste experiences, and sustainable product lifecycles. Technological advancements are also playing a crucial role, impacting everything from efficient production processes to innovative packaging designs. The regulatory landscape, with its emphasis on food safety and transparent labeling, continues to shape operational strategies. Mergers and acquisitions remain a strategic tool for larger entities aiming to broaden their product portfolios and extend their global footprint.
- Market Concentration: The top 5 players held approximately 60-70% of the global market share in 2024, indicating a moderately concentrated industry.
- Technological Innovation: A strong emphasis is placed on developing biodegradable and recyclable packaging, implementing advanced automation in manufacturing for efficiency, and experimenting with diverse and appealing flavor infusions.
- Regulatory Framework: Strict adherence to food safety standards and clear, informative labeling mandates are critical for market access and consumer trust.
- Competitive Substitutes: The market faces competition from a wide array of alternative condiments, including mustard, mayonnaise, hot sauces, and various specialty dips.
- End-User Demographics: Millennials and Gen Z consumers are increasingly driving demand for unique, globally inspired flavors and user-friendly, sustainable packaging options.
- M&A Trends: The period between 2019 and 2024 saw around 10-15 notable M&A transactions within the ketchup industry, predominantly aimed at enhancing product diversification and expanding market reach.
Ketchup Industry Growth Trends & Insights
The global ketchup market has demonstrated consistent growth over the historical period (2019-2024), achieving a Compound Annual Growth Rate (CAGR) of approximately 4-5%. This upward trajectory is anticipated to persist through the forecast period (2025-2033), propelled by several key factors. The increasing global consumption of processed and convenience foods, coupled with rising disposable incomes in developing economies, fuels demand. Furthermore, the continuous introduction of novel and appealing product offerings, including a surge in flavored ketchups and eco-friendly packaging, actively responds to evolving consumer tastes and environmental consciousness. Technological advancements in production efficiency and packaging innovation are also significant contributors to market expansion. Consumer behavior is notably shifting towards healthier food choices, prompting manufacturers to adapt their product development and marketing strategies. Market penetration exhibits considerable regional variation, with mature markets reaching saturation while emerging economies present substantial untapped growth potential.
Dominant Regions, Countries, or Segments in Ketchup Industry
North America and Europe currently dominate the global ketchup market, driven by high per capita consumption and well-established distribution networks. However, Asia-Pacific is emerging as a high-growth region, fueled by rapid urbanization, rising disposable incomes, and changing dietary habits. Within product types, regular ketchup remains the dominant segment, but flavored ketchup is experiencing substantial growth. Bottled ketchup accounts for a larger market share compared to pouches, but pouch packaging is gaining popularity for convenience and portability. The off-trade (retail) distribution channel holds the larger market share, but the on-trade (foodservice) segment presents significant growth potential.
- Key Drivers: Rising disposable incomes, urbanization, changing food consumption patterns, and strong retail infrastructure.
- Dominance Factors: Established brand presence, extensive distribution networks, strong consumer preference for established brands in mature markets.
- Growth Potential: Asia-Pacific and other emerging markets present substantial growth opportunities due to increasing consumer spending and evolving taste preferences.
Ketchup Industry Product Landscape
The ketchup market offers a variety of products catering to diverse consumer preferences. Innovation centers around flavor variations (e.g., spicy, smoky, sweet), packaging formats (e.g., single-serve pouches, refillable bottles), and sustainability initiatives (e.g., reduced plastic usage, plant-based packaging). Key performance metrics include shelf life, flavor profile, consistency, and packaging efficiency. Unique selling propositions often focus on natural ingredients, unique flavor combinations, and environmentally friendly packaging. Technological advancements in production processes enable better quality control, increased efficiency, and reduced costs.
Key Drivers, Barriers & Challenges in Ketchup Industry
Key Drivers: The escalating demand for convenient, ready-to-eat food options, the robust expansion of the fast-food sector, and the increasing accessibility of retail channels are primary growth drivers.
Key Challenges: Volatility in the pricing of key raw materials, particularly tomatoes, presents a significant challenge. Stringent and evolving food safety regulations require continuous adaptation. Intense competition from a multitude of private label brands and diverse condiment manufacturers also exerts pressure on market share. Moreover, supply chain vulnerabilities, exacerbated by geopolitical instability or extreme weather events, can disrupt raw material availability and inflate operational costs.
Emerging Opportunities in Ketchup Industry
Emerging opportunities exist in exploring new and unique flavor profiles catering to diverse palates, expanding into untapped markets in developing regions, and developing sustainable packaging solutions to meet growing environmental concerns. Further, there's potential in creating innovative product formats tailored for specific applications (e.g., single-serve packets for travel).
Growth Accelerators in the Ketchup Industry Industry
Strategic alliances and collaborative ventures, coupled with continuous investment in cutting-edge production and packaging technologies, are pivotal growth accelerators. Geographic expansion into previously underserved or emerging markets also offers significant opportunities. The successful development and introduction of innovative products, characterized by unique flavor profiles and health-conscious formulations, will be instrumental in driving further market expansion and capturing consumer interest.
Key Players Shaping the Ketchup Industry Market
- Wingreens Farms Private Limited
- General Mills Inc
- Unilever PLC
- Conagra Brands Inc
- The Foraging Fox Limited
- The Kraft Heinz Company
- Windmill Organics Ltd
- Del Monte Foods Holdings Limited
- McCormick & Company Incorporated
- Nestlé S A
Notable Milestones in Ketchup Industry Sector
- November 2021: The Kraft Heinz company launched Marz Edition ketchup, made with tomatoes grown under Martian soil conditions.
- May 2022: Heinz partnered with Pulpex to develop a paper-based, renewable, and recyclable bottle.
- June 2022: Heinz launched a range of new cold ketchup in Canada.
In-Depth Ketchup Industry Market Outlook
The future of the ketchup industry is promising, driven by continued innovation, expanding consumer base, and favorable economic trends in various regions. Strategic partnerships and investments in sustainable practices will be critical for long-term success. The market is poised for significant growth, particularly in emerging markets with rising disposable incomes and evolving consumer preferences for convenience and healthier options. Companies that focus on product differentiation, sustainable practices, and effective distribution strategies are best positioned to capture market share and drive long-term growth.
Ketchup Industry Segmentation
-
1. Product Type
- 1.1. Regular Ketchup
- 1.2. Flavored Ketchup
-
2. Packaging
- 2.1. Bottled
- 2.2. Pouch
-
3. Distribution Channel
- 3.1. On-trade (Foodservice)
-
3.2. Off-trade
- 3.2.1. Supermarkets/Hypermarkets
- 3.2.2. Convenience Stores
- 3.2.3. Online Retail Stores
- 3.2.4. Other Off-trade Channels
Ketchup Industry Segmentation By Geography
-
1. North America
- 1.1. United States
- 1.2. Canada
- 1.3. Mexico
- 1.4. Rest of North America
-
2. Europe
- 2.1. Spain
- 2.2. United Kingdom
- 2.3. Germany
- 2.4. France
- 2.5. Italy
- 2.6. Rest of Europe
-
3. Asia Pacific
- 3.1. China
- 3.2. Japan
- 3.3. India
- 3.4. Australia
- 3.5. Rest of Asia Pacific
-
4. South America
- 4.1. Brazil
- 4.2. Argentina
- 4.3. Rest of South America
-
5. Middle East and Africa
- 5.1. South Africa
- 5.2. United Arab Emirates
- 5.3. Rest of Middle East and Africa
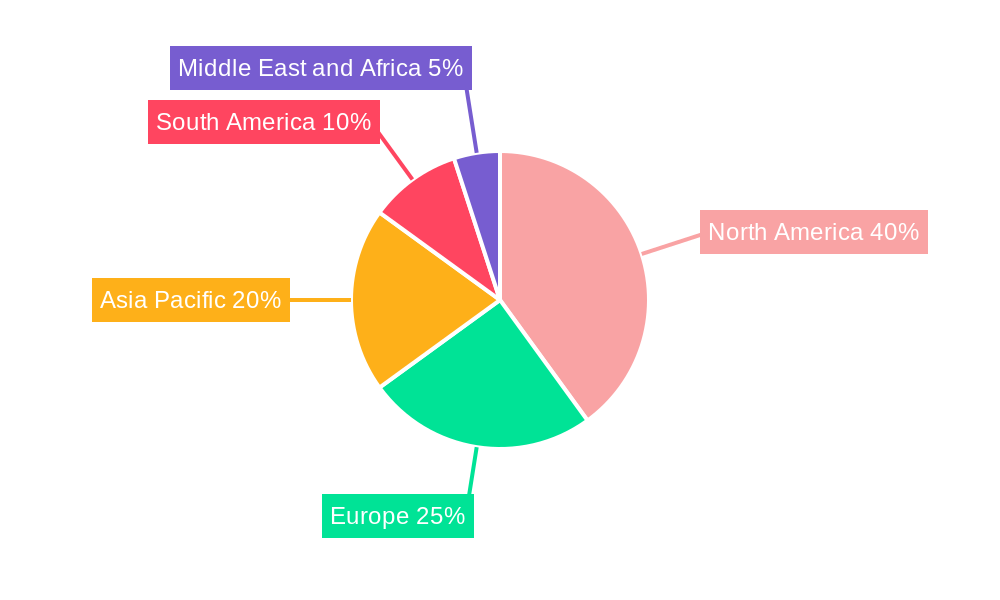
Ketchup Industry Regional Market Share
Geographic Coverage of Ketchup Industry
Ketchup Industry REPORT HIGHLIGHTS
| Aspects | Details |
|---|---|
| Study Period | 2020-2034 |
| Base Year | 2025 |
| Estimated Year | 2026 |
| Forecast Period | 2026-2034 |
| Historical Period | 2020-2025 |
| Growth Rate | CAGR of 4.14% from 2020-2034 |
| Segmentation |
|
Table of Contents
- 1. Introduction
- 1.1. Research Scope
- 1.2. Market Segmentation
- 1.3. Research Methodology
- 1.4. Definitions and Assumptions
- 2. Executive Summary
- 2.1. Introduction
- 3. Market Dynamics
- 3.1. Introduction
- 3.2. Market Drivers
- 3.2.1. Rising Health Consciousness among consumer
- 3.3. Market Restrains
- 3.3.1. High Cost of natural Ingredients
- 3.4. Market Trends
- 3.4.1. Increasing Inclination Toward Organic Ketchup
- 4. Market Factor Analysis
- 4.1. Porters Five Forces
- 4.2. Supply/Value Chain
- 4.3. PESTEL analysis
- 4.4. Market Entropy
- 4.5. Patent/Trademark Analysis
- 5. Global Ketchup Industry Analysis, Insights and Forecast, 2020-2032
- 5.1. Market Analysis, Insights and Forecast - by Product Type
- 5.1.1. Regular Ketchup
- 5.1.2. Flavored Ketchup
- 5.2. Market Analysis, Insights and Forecast - by Packaging
- 5.2.1. Bottled
- 5.2.2. Pouch
- 5.3. Market Analysis, Insights and Forecast - by Distribution Channel
- 5.3.1. On-trade (Foodservice)
- 5.3.2. Off-trade
- 5.3.2.1. Supermarkets/Hypermarkets
- 5.3.2.2. Convenience Stores
- 5.3.2.3. Online Retail Stores
- 5.3.2.4. Other Off-trade Channels
- 5.4. Market Analysis, Insights and Forecast - by Region
- 5.4.1. North America
- 5.4.2. Europe
- 5.4.3. Asia Pacific
- 5.4.4. South America
- 5.4.5. Middle East and Africa
- 5.1. Market Analysis, Insights and Forecast - by Product Type
- 6. North America Ketchup Industry Analysis, Insights and Forecast, 2020-2032
- 6.1. Market Analysis, Insights and Forecast - by Product Type
- 6.1.1. Regular Ketchup
- 6.1.2. Flavored Ketchup
- 6.2. Market Analysis, Insights and Forecast - by Packaging
- 6.2.1. Bottled
- 6.2.2. Pouch
- 6.3. Market Analysis, Insights and Forecast - by Distribution Channel
- 6.3.1. On-trade (Foodservice)
- 6.3.2. Off-trade
- 6.3.2.1. Supermarkets/Hypermarkets
- 6.3.2.2. Convenience Stores
- 6.3.2.3. Online Retail Stores
- 6.3.2.4. Other Off-trade Channels
- 6.1. Market Analysis, Insights and Forecast - by Product Type
- 7. Europe Ketchup Industry Analysis, Insights and Forecast, 2020-2032
- 7.1. Market Analysis, Insights and Forecast - by Product Type
- 7.1.1. Regular Ketchup
- 7.1.2. Flavored Ketchup
- 7.2. Market Analysis, Insights and Forecast - by Packaging
- 7.2.1. Bottled
- 7.2.2. Pouch
- 7.3. Market Analysis, Insights and Forecast - by Distribution Channel
- 7.3.1. On-trade (Foodservice)
- 7.3.2. Off-trade
- 7.3.2.1. Supermarkets/Hypermarkets
- 7.3.2.2. Convenience Stores
- 7.3.2.3. Online Retail Stores
- 7.3.2.4. Other Off-trade Channels
- 7.1. Market Analysis, Insights and Forecast - by Product Type
- 8. Asia Pacific Ketchup Industry Analysis, Insights and Forecast, 2020-2032
- 8.1. Market Analysis, Insights and Forecast - by Product Type
- 8.1.1. Regular Ketchup
- 8.1.2. Flavored Ketchup
- 8.2. Market Analysis, Insights and Forecast - by Packaging
- 8.2.1. Bottled
- 8.2.2. Pouch
- 8.3. Market Analysis, Insights and Forecast - by Distribution Channel
- 8.3.1. On-trade (Foodservice)
- 8.3.2. Off-trade
- 8.3.2.1. Supermarkets/Hypermarkets
- 8.3.2.2. Convenience Stores
- 8.3.2.3. Online Retail Stores
- 8.3.2.4. Other Off-trade Channels
- 8.1. Market Analysis, Insights and Forecast - by Product Type
- 9. South America Ketchup Industry Analysis, Insights and Forecast, 2020-2032
- 9.1. Market Analysis, Insights and Forecast - by Product Type
- 9.1.1. Regular Ketchup
- 9.1.2. Flavored Ketchup
- 9.2. Market Analysis, Insights and Forecast - by Packaging
- 9.2.1. Bottled
- 9.2.2. Pouch
- 9.3. Market Analysis, Insights and Forecast - by Distribution Channel
- 9.3.1. On-trade (Foodservice)
- 9.3.2. Off-trade
- 9.3.2.1. Supermarkets/Hypermarkets
- 9.3.2.2. Convenience Stores
- 9.3.2.3. Online Retail Stores
- 9.3.2.4. Other Off-trade Channels
- 9.1. Market Analysis, Insights and Forecast - by Product Type
- 10. Middle East and Africa Ketchup Industry Analysis, Insights and Forecast, 2020-2032
- 10.1. Market Analysis, Insights and Forecast - by Product Type
- 10.1.1. Regular Ketchup
- 10.1.2. Flavored Ketchup
- 10.2. Market Analysis, Insights and Forecast - by Packaging
- 10.2.1. Bottled
- 10.2.2. Pouch
- 10.3. Market Analysis, Insights and Forecast - by Distribution Channel
- 10.3.1. On-trade (Foodservice)
- 10.3.2. Off-trade
- 10.3.2.1. Supermarkets/Hypermarkets
- 10.3.2.2. Convenience Stores
- 10.3.2.3. Online Retail Stores
- 10.3.2.4. Other Off-trade Channels
- 10.1. Market Analysis, Insights and Forecast - by Product Type
- 11. Competitive Analysis
- 11.1. Global Market Share Analysis 2025
- 11.2. Company Profiles
- 11.2.1 Wingreens Farms Private Limited
- 11.2.1.1. Overview
- 11.2.1.2. Products
- 11.2.1.3. SWOT Analysis
- 11.2.1.4. Recent Developments
- 11.2.1.5. Financials (Based on Availability)
- 11.2.2 General Mills Inc
- 11.2.2.1. Overview
- 11.2.2.2. Products
- 11.2.2.3. SWOT Analysis
- 11.2.2.4. Recent Developments
- 11.2.2.5. Financials (Based on Availability)
- 11.2.3 Unilever PLC
- 11.2.3.1. Overview
- 11.2.3.2. Products
- 11.2.3.3. SWOT Analysis
- 11.2.3.4. Recent Developments
- 11.2.3.5. Financials (Based on Availability)
- 11.2.4 Conagra Brands Inc
- 11.2.4.1. Overview
- 11.2.4.2. Products
- 11.2.4.3. SWOT Analysis
- 11.2.4.4. Recent Developments
- 11.2.4.5. Financials (Based on Availability)
- 11.2.5 The Foraging Fox Limited*List Not Exhaustive
- 11.2.5.1. Overview
- 11.2.5.2. Products
- 11.2.5.3. SWOT Analysis
- 11.2.5.4. Recent Developments
- 11.2.5.5. Financials (Based on Availability)
- 11.2.6 The Kraft Heinz Company
- 11.2.6.1. Overview
- 11.2.6.2. Products
- 11.2.6.3. SWOT Analysis
- 11.2.6.4. Recent Developments
- 11.2.6.5. Financials (Based on Availability)
- 11.2.7 Windmill Organics Ltd
- 11.2.7.1. Overview
- 11.2.7.2. Products
- 11.2.7.3. SWOT Analysis
- 11.2.7.4. Recent Developments
- 11.2.7.5. Financials (Based on Availability)
- 11.2.8 Del Monte Foods Holdings Limited
- 11.2.8.1. Overview
- 11.2.8.2. Products
- 11.2.8.3. SWOT Analysis
- 11.2.8.4. Recent Developments
- 11.2.8.5. Financials (Based on Availability)
- 11.2.9 McCormick & Company Incorporated
- 11.2.9.1. Overview
- 11.2.9.2. Products
- 11.2.9.3. SWOT Analysis
- 11.2.9.4. Recent Developments
- 11.2.9.5. Financials (Based on Availability)
- 11.2.10 Nestlé S A
- 11.2.10.1. Overview
- 11.2.10.2. Products
- 11.2.10.3. SWOT Analysis
- 11.2.10.4. Recent Developments
- 11.2.10.5. Financials (Based on Availability)
- 11.2.1 Wingreens Farms Private Limited
List of Figures
- Figure 1: Global Ketchup Industry Revenue Breakdown (Million, %) by Region 2025 & 2033
- Figure 2: North America Ketchup Industry Revenue (Million), by Product Type 2025 & 2033
- Figure 3: North America Ketchup Industry Revenue Share (%), by Product Type 2025 & 2033
- Figure 4: North America Ketchup Industry Revenue (Million), by Packaging 2025 & 2033
- Figure 5: North America Ketchup Industry Revenue Share (%), by Packaging 2025 & 2033
- Figure 6: North America Ketchup Industry Revenue (Million), by Distribution Channel 2025 & 2033
- Figure 7: North America Ketchup Industry Revenue Share (%), by Distribution Channel 2025 & 2033
- Figure 8: North America Ketchup Industry Revenue (Million), by Country 2025 & 2033
- Figure 9: North America Ketchup Industry Revenue Share (%), by Country 2025 & 2033
- Figure 10: Europe Ketchup Industry Revenue (Million), by Product Type 2025 & 2033
- Figure 11: Europe Ketchup Industry Revenue Share (%), by Product Type 2025 & 2033
- Figure 12: Europe Ketchup Industry Revenue (Million), by Packaging 2025 & 2033
- Figure 13: Europe Ketchup Industry Revenue Share (%), by Packaging 2025 & 2033
- Figure 14: Europe Ketchup Industry Revenue (Million), by Distribution Channel 2025 & 2033
- Figure 15: Europe Ketchup Industry Revenue Share (%), by Distribution Channel 2025 & 2033
- Figure 16: Europe Ketchup Industry Revenue (Million), by Country 2025 & 2033
- Figure 17: Europe Ketchup Industry Revenue Share (%), by Country 2025 & 2033
- Figure 18: Asia Pacific Ketchup Industry Revenue (Million), by Product Type 2025 & 2033
- Figure 19: Asia Pacific Ketchup Industry Revenue Share (%), by Product Type 2025 & 2033
- Figure 20: Asia Pacific Ketchup Industry Revenue (Million), by Packaging 2025 & 2033
- Figure 21: Asia Pacific Ketchup Industry Revenue Share (%), by Packaging 2025 & 2033
- Figure 22: Asia Pacific Ketchup Industry Revenue (Million), by Distribution Channel 2025 & 2033
- Figure 23: Asia Pacific Ketchup Industry Revenue Share (%), by Distribution Channel 2025 & 2033
- Figure 24: Asia Pacific Ketchup Industry Revenue (Million), by Country 2025 & 2033
- Figure 25: Asia Pacific Ketchup Industry Revenue Share (%), by Country 2025 & 2033
- Figure 26: South America Ketchup Industry Revenue (Million), by Product Type 2025 & 2033
- Figure 27: South America Ketchup Industry Revenue Share (%), by Product Type 2025 & 2033
- Figure 28: South America Ketchup Industry Revenue (Million), by Packaging 2025 & 2033
- Figure 29: South America Ketchup Industry Revenue Share (%), by Packaging 2025 & 2033
- Figure 30: South America Ketchup Industry Revenue (Million), by Distribution Channel 2025 & 2033
- Figure 31: South America Ketchup Industry Revenue Share (%), by Distribution Channel 2025 & 2033
- Figure 32: South America Ketchup Industry Revenue (Million), by Country 2025 & 2033
- Figure 33: South America Ketchup Industry Revenue Share (%), by Country 2025 & 2033
- Figure 34: Middle East and Africa Ketchup Industry Revenue (Million), by Product Type 2025 & 2033
- Figure 35: Middle East and Africa Ketchup Industry Revenue Share (%), by Product Type 2025 & 2033
- Figure 36: Middle East and Africa Ketchup Industry Revenue (Million), by Packaging 2025 & 2033
- Figure 37: Middle East and Africa Ketchup Industry Revenue Share (%), by Packaging 2025 & 2033
- Figure 38: Middle East and Africa Ketchup Industry Revenue (Million), by Distribution Channel 2025 & 2033
- Figure 39: Middle East and Africa Ketchup Industry Revenue Share (%), by Distribution Channel 2025 & 2033
- Figure 40: Middle East and Africa Ketchup Industry Revenue (Million), by Country 2025 & 2033
- Figure 41: Middle East and Africa Ketchup Industry Revenue Share (%), by Country 2025 & 2033
List of Tables
- Table 1: Global Ketchup Industry Revenue Million Forecast, by Product Type 2020 & 2033
- Table 2: Global Ketchup Industry Revenue Million Forecast, by Packaging 2020 & 2033
- Table 3: Global Ketchup Industry Revenue Million Forecast, by Distribution Channel 2020 & 2033
- Table 4: Global Ketchup Industry Revenue Million Forecast, by Region 2020 & 2033
- Table 5: Global Ketchup Industry Revenue Million Forecast, by Product Type 2020 & 2033
- Table 6: Global Ketchup Industry Revenue Million Forecast, by Packaging 2020 & 2033
- Table 7: Global Ketchup Industry Revenue Million Forecast, by Distribution Channel 2020 & 2033
- Table 8: Global Ketchup Industry Revenue Million Forecast, by Country 2020 & 2033
- Table 9: United States Ketchup Industry Revenue (Million) Forecast, by Application 2020 & 2033
- Table 10: Canada Ketchup Industry Revenue (Million) Forecast, by Application 2020 & 2033
- Table 11: Mexico Ketchup Industry Revenue (Million) Forecast, by Application 2020 & 2033
- Table 12: Rest of North America Ketchup Industry Revenue (Million) Forecast, by Application 2020 & 2033
- Table 13: Global Ketchup Industry Revenue Million Forecast, by Product Type 2020 & 2033
- Table 14: Global Ketchup Industry Revenue Million Forecast, by Packaging 2020 & 2033
- Table 15: Global Ketchup Industry Revenue Million Forecast, by Distribution Channel 2020 & 2033
- Table 16: Global Ketchup Industry Revenue Million Forecast, by Country 2020 & 2033
- Table 17: Spain Ketchup Industry Revenue (Million) Forecast, by Application 2020 & 2033
- Table 18: United Kingdom Ketchup Industry Revenue (Million) Forecast, by Application 2020 & 2033
- Table 19: Germany Ketchup Industry Revenue (Million) Forecast, by Application 2020 & 2033
- Table 20: France Ketchup Industry Revenue (Million) Forecast, by Application 2020 & 2033
- Table 21: Italy Ketchup Industry Revenue (Million) Forecast, by Application 2020 & 2033
- Table 22: Rest of Europe Ketchup Industry Revenue (Million) Forecast, by Application 2020 & 2033
- Table 23: Global Ketchup Industry Revenue Million Forecast, by Product Type 2020 & 2033
- Table 24: Global Ketchup Industry Revenue Million Forecast, by Packaging 2020 & 2033
- Table 25: Global Ketchup Industry Revenue Million Forecast, by Distribution Channel 2020 & 2033
- Table 26: Global Ketchup Industry Revenue Million Forecast, by Country 2020 & 2033
- Table 27: China Ketchup Industry Revenue (Million) Forecast, by Application 2020 & 2033
- Table 28: Japan Ketchup Industry Revenue (Million) Forecast, by Application 2020 & 2033
- Table 29: India Ketchup Industry Revenue (Million) Forecast, by Application 2020 & 2033
- Table 30: Australia Ketchup Industry Revenue (Million) Forecast, by Application 2020 & 2033
- Table 31: Rest of Asia Pacific Ketchup Industry Revenue (Million) Forecast, by Application 2020 & 2033
- Table 32: Global Ketchup Industry Revenue Million Forecast, by Product Type 2020 & 2033
- Table 33: Global Ketchup Industry Revenue Million Forecast, by Packaging 2020 & 2033
- Table 34: Global Ketchup Industry Revenue Million Forecast, by Distribution Channel 2020 & 2033
- Table 35: Global Ketchup Industry Revenue Million Forecast, by Country 2020 & 2033
- Table 36: Brazil Ketchup Industry Revenue (Million) Forecast, by Application 2020 & 2033
- Table 37: Argentina Ketchup Industry Revenue (Million) Forecast, by Application 2020 & 2033
- Table 38: Rest of South America Ketchup Industry Revenue (Million) Forecast, by Application 2020 & 2033
- Table 39: Global Ketchup Industry Revenue Million Forecast, by Product Type 2020 & 2033
- Table 40: Global Ketchup Industry Revenue Million Forecast, by Packaging 2020 & 2033
- Table 41: Global Ketchup Industry Revenue Million Forecast, by Distribution Channel 2020 & 2033
- Table 42: Global Ketchup Industry Revenue Million Forecast, by Country 2020 & 2033
- Table 43: South Africa Ketchup Industry Revenue (Million) Forecast, by Application 2020 & 2033
- Table 44: United Arab Emirates Ketchup Industry Revenue (Million) Forecast, by Application 2020 & 2033
- Table 45: Rest of Middle East and Africa Ketchup Industry Revenue (Million) Forecast, by Application 2020 & 2033
Frequently Asked Questions
1. What is the projected Compound Annual Growth Rate (CAGR) of the Ketchup Industry?
The projected CAGR is approximately 4.14%.
2. Which companies are prominent players in the Ketchup Industry?
Key companies in the market include Wingreens Farms Private Limited, General Mills Inc, Unilever PLC, Conagra Brands Inc, The Foraging Fox Limited*List Not Exhaustive, The Kraft Heinz Company, Windmill Organics Ltd, Del Monte Foods Holdings Limited, McCormick & Company Incorporated, Nestlé S A.
3. What are the main segments of the Ketchup Industry?
The market segments include Product Type, Packaging, Distribution Channel.
4. Can you provide details about the market size?
The market size is estimated to be USD 17.17 Million as of 2022.
5. What are some drivers contributing to market growth?
Rising Health Consciousness among consumer.
6. What are the notable trends driving market growth?
Increasing Inclination Toward Organic Ketchup.
7. Are there any restraints impacting market growth?
High Cost of natural Ingredients.
8. Can you provide examples of recent developments in the market?
June 2022: Heinz launched a range of new cold ketchup in Canada. It's the same iconic, slow-pouring ketchup, now cold, with a label that turns icy blue when it's perfectly chilled. The new product by Heinz was available at participating Wendy's locations in Canada for a limited duration and at selected grocery stores in specially-marked display fridges.
9. What pricing options are available for accessing the report?
Pricing options include single-user, multi-user, and enterprise licenses priced at USD 4750, USD 5250, and USD 8750 respectively.
10. Is the market size provided in terms of value or volume?
The market size is provided in terms of value, measured in Million.
11. Are there any specific market keywords associated with the report?
Yes, the market keyword associated with the report is "Ketchup Industry," which aids in identifying and referencing the specific market segment covered.
12. How do I determine which pricing option suits my needs best?
The pricing options vary based on user requirements and access needs. Individual users may opt for single-user licenses, while businesses requiring broader access may choose multi-user or enterprise licenses for cost-effective access to the report.
13. Are there any additional resources or data provided in the Ketchup Industry report?
While the report offers comprehensive insights, it's advisable to review the specific contents or supplementary materials provided to ascertain if additional resources or data are available.
14. How can I stay updated on further developments or reports in the Ketchup Industry?
To stay informed about further developments, trends, and reports in the Ketchup Industry, consider subscribing to industry newsletters, following relevant companies and organizations, or regularly checking reputable industry news sources and publications.
Methodology
Step 1 - Identification of Relevant Samples Size from Population Database


Step 2 - Approaches for Defining Global Market Size (Value, Volume* & Price*)

Note*: In applicable scenarios
Step 3 - Data Sources
Primary Research
- Web Analytics
- Survey Reports
- Research Institute
- Latest Research Reports
- Opinion Leaders
Secondary Research
- Annual Reports
- White Paper
- Latest Press Release
- Industry Association
- Paid Database
- Investor Presentations

Step 4 - Data Triangulation
Involves using different sources of information in order to increase the validity of a study
These sources are likely to be stakeholders in a program - participants, other researchers, program staff, other community members, and so on.
Then we put all data in single framework & apply various statistical tools to find out the dynamic on the market.
During the analysis stage, feedback from the stakeholder groups would be compared to determine areas of agreement as well as areas of divergence