
Key Insights
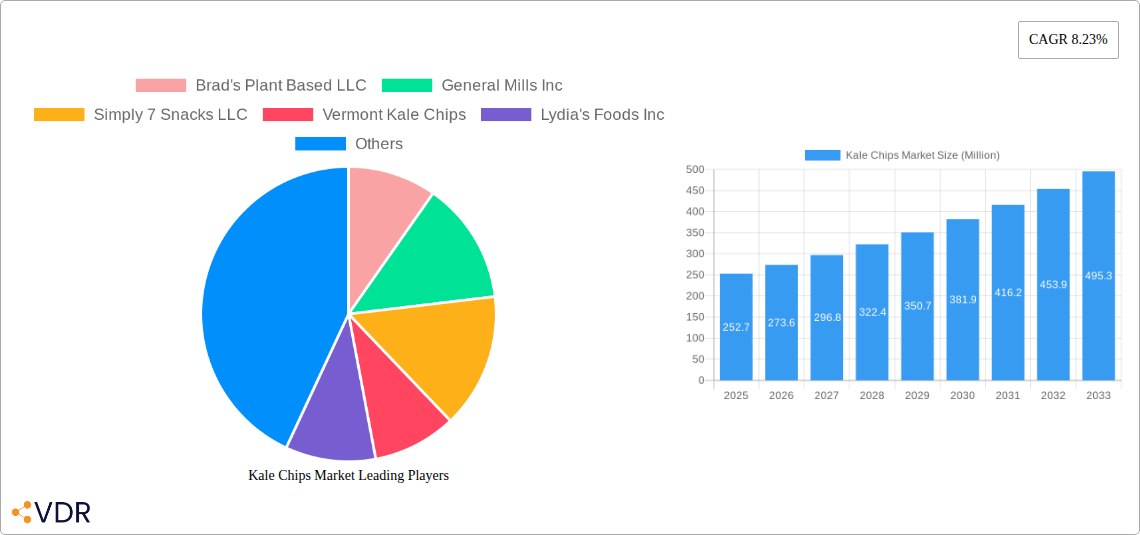
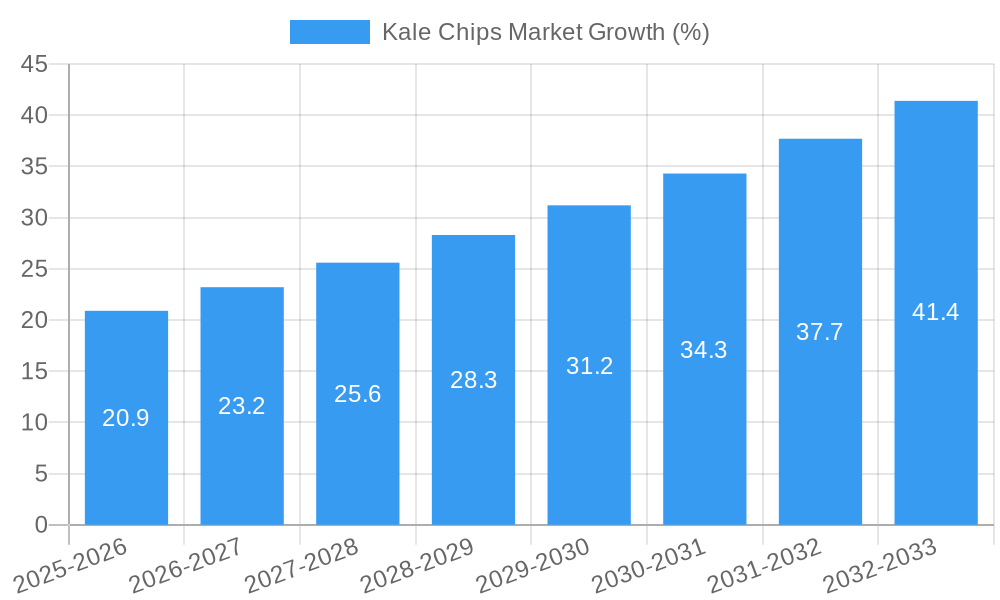
The global kale chips market, valued at $252.7 million in 2025, is projected to experience robust growth, driven by increasing consumer demand for healthy and convenient snack options. The market's Compound Annual Growth Rate (CAGR) of 8.23% from 2025 to 2033 indicates a significant expansion, fueled by several key factors. The rising prevalence of health-conscious lifestyles, coupled with growing awareness of kale's nutritional benefits, is a primary driver. Consumers are increasingly seeking snacks that are low in calories, high in nutrients, and free from artificial additives, making kale chips an attractive alternative to traditional processed snacks. Furthermore, the market is witnessing innovation in product offerings, with the emergence of various flavors, textures, and formats like dehydrated leaf crisps, extruded chips, and even organic and gluten-free options. The expanding distribution channels, including hypermarkets, convenience stores, specialist health food stores, and the rapidly growing online retail sector, further contribute to market expansion. While potential restraints like price sensitivity and seasonal variations in kale supply exist, the overall market outlook remains positive, driven by strong consumer preference for healthy snacking and continuous product development.
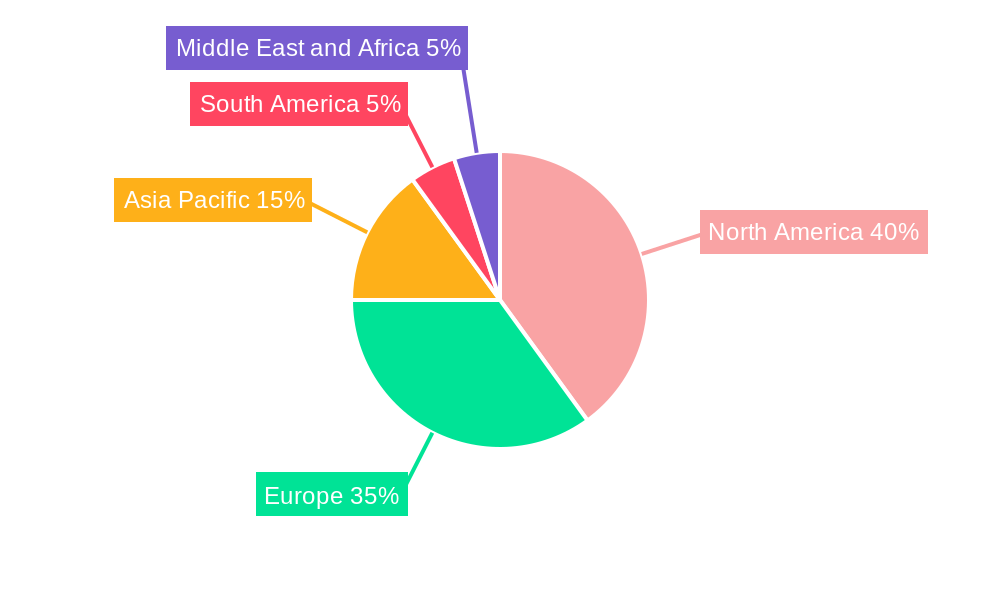
The segment analysis reveals a dynamic landscape. Dehydrated leaf crisps and extruded chips, representing different processing techniques and resulting textures, are key product types driving market growth. Distribution channels also show varied performance, with hypermarkets and supermarkets holding a significant share due to their wide reach, while online stores contribute to the market’s growing convenience factor. North America and Europe currently dominate the market, largely due to high consumer awareness and established health-conscious markets. However, Asia-Pacific is expected to witness significant growth, fuelled by increasing disposable incomes and rising health awareness among the rapidly growing middle class in regions like China and India. Key players, including Brad's Plant Based LLC, General Mills Inc., and others, are actively engaged in product innovation, brand building, and strategic expansions to capitalize on the market's potential. This competitive landscape further intensifies innovation and boosts market growth.
Kale Chips Market: A Comprehensive Market Report (2019-2033)
This comprehensive report provides a detailed analysis of the global Kale Chips market, encompassing market dynamics, growth trends, regional performance, product landscape, and key players. The study period covers 2019-2033, with 2025 as the base year and a forecast period of 2025-2033. This report is invaluable for industry professionals, investors, and stakeholders seeking a deep understanding of this rapidly evolving market segment within the larger healthy snack food market. The report is structured to provide clear, concise insights and actionable intelligence.
Kale Chips Market Dynamics & Structure
The kale chips market, a sub-segment of the broader healthy snacks market (valued at xx Million units in 2024), exhibits a moderately fragmented structure. While larger players like General Mills Inc. exert influence, numerous smaller, specialized brands contribute significantly to overall volume. Market concentration is relatively low, with the top five players holding an estimated xx% market share in 2024. Technological innovation, primarily focused on enhancing flavor profiles, improving texture, and optimizing production efficiency, is a key driver. Regulatory frameworks related to food safety and labeling significantly impact operations. Competitive substitutes include other vegetable chips, baked snacks, and protein bars. The end-user demographic is primarily health-conscious millennials and Gen Z consumers, with a growing adoption across broader age groups. M&A activity has been moderate, with approximately xx deals recorded between 2019 and 2024, indicating strategic consolidation within the sector.
- Market Concentration: Low, top 5 players holding approximately xx% market share (2024).
- Technological Innovation: Focus on flavor enhancement, texture improvement, and production optimization.
- Regulatory Framework: Significant impact from food safety and labeling regulations.
- Competitive Substitutes: Vegetable chips, baked snacks, protein bars.
- End-User Demographics: Primarily health-conscious millennials and Gen Z, expanding to broader demographics.
- M&A Activity: Moderate, with approximately xx deals between 2019 and 2024.
Kale Chips Market Growth Trends & Insights
The global kale chips market experienced robust growth during the historical period (2019-2024), driven by increasing consumer awareness of health and wellness, the rising popularity of plant-based diets, and the convenience offered by ready-to-eat snacks. The market size expanded from xx Million units in 2019 to xx Million units in 2024, registering a Compound Annual Growth Rate (CAGR) of xx%. Technological disruptions, such as improved dehydration and extrusion techniques, have contributed to enhanced product quality and affordability. Consumer behavior shifts toward healthier snacking options continue to fuel market expansion. Market penetration remains relatively high in developed countries but offers significant potential in emerging economies. The forecast period (2025-2033) projects sustained growth, with a projected CAGR of xx%, driven by factors including increasing disposable incomes in developing countries and the ongoing trend toward convenient and nutritious food options. Specific market penetration rates and CAGR values are detailed in the full report.
Dominant Regions, Countries, or Segments in Kale Chips Market
North America currently dominates the kale chips market, accounting for approximately xx% of global sales in 2024. This dominance is attributed to high consumer awareness of healthy eating, strong distribution channels, and a well-established market for healthy snacks. Europe holds the second-largest market share, driven by rising demand for plant-based foods and increasing consumer spending on premium snacks. Within product types, dehydrated leaf crisps/chips hold the largest market share, owing to their traditional appeal and widespread availability. Hypermarkets/supermarkets remain the primary distribution channel, followed by convenience stores and online retailers. Growth is also expected in specialty stores.
- North America: High consumer awareness of healthy eating, strong distribution networks.
- Europe: Rising demand for plant-based foods, increased consumer spending on premium snacks.
- Product Type: Dehydrated leaf crisps/chips hold the largest market share.
- Distribution Channel: Hypermarkets/supermarkets are the dominant channel.
- Emerging Markets: Strong growth potential in Asia-Pacific and Latin America.
Kale Chips Market Product Landscape
The kale chips market offers a diverse range of products, including dehydrated leaf crisps/chips and extruded chips, each catering to specific consumer preferences and dietary needs. Innovations focus on flavor variations (e.g., spicy, sweet, savory), the addition of functional ingredients (e.g., seeds, spices), and improved texture to enhance the consumer experience. The use of advanced processing techniques ensures optimal preservation of nutrients and flavor. Key selling propositions include health benefits (high in vitamins and fiber), natural ingredients, and the convenience of a ready-to-eat snack.
Key Drivers, Barriers & Challenges in Kale Chips Market
Key Drivers:
- The growing demand for healthy and convenient snacks.
- Increasing consumer awareness of the health benefits of kale.
- Rising popularity of plant-based diets.
- Technological advancements in production processes.
Key Challenges:
- Supply chain disruptions impacting kale sourcing and production.
- Fluctuations in raw material prices.
- Intense competition from established snack food brands and emerging players.
- Stringent food safety regulations. These factors can significantly impact profit margins and hinder market growth.
Emerging Opportunities in Kale Chips Market
Emerging opportunities lie in expanding into untapped markets in developing economies, introducing innovative flavors and product formats (e.g., organic, gluten-free, flavored varieties), and developing value-added products with enhanced health benefits (e.g., incorporating probiotics or other functional ingredients). Targeting niche consumer segments with specific dietary needs (e.g., vegan, vegetarian) offers significant growth potential. Furthermore, exploring new distribution channels, including online platforms and direct-to-consumer sales, presents opportunities to reach wider audiences.
Growth Accelerators in the Kale Chips Market Industry
Long-term growth in the kale chips market will be fueled by continued technological advancements in processing and packaging, fostering sustainability and reducing environmental impact. Strategic partnerships with major food retailers and distributors will enhance market reach and brand visibility. Expansion into new geographic regions with high growth potential, particularly in developing economies, will drive market volume. These initiatives will establish a stronger position within the broader snack food market.
Key Players Shaping the Kale Chips Market Market
- Brad's Plant Based LLC
- General Mills Inc
- Simply 7 Snacks LLC
- Vermont Kale Chips
- Lydia's Foods Inc
- Healthy Crunch
- The Green Snack Co
- The Angel Kale Company
- The Kale Factory
- GlaxoSmithKline PLC *List Not Exhaustive
Notable Milestones in Kale Chips Market Sector
- September 2020: Ecoideas launched Solar Raw's Kaley's Kale Chips in four new flavors.
- November 2019: San Miguel Produce launched a new line of fresh Kale Chip Kits.
- January 2017: General Mills Inc. invested in Rhythm Superfoods.
In-Depth Kale Chips Market Market Outlook
The future of the kale chips market appears promising, with projected continued growth driven by the aforementioned factors. Strategic investments in research and development, focusing on innovation and improved product offerings, will play a crucial role in maintaining market competitiveness. Expansion into new markets and the development of novel distribution channels will be essential for long-term success. This presents significant opportunities for existing players and new entrants to capitalize on the growing demand for convenient, healthy, and plant-based snack options.
Kale Chips Market Segmentation
-
1. Product Type
- 1.1. Dehydrated leaf Crisps/Chips
- 1.2. Extruded Chips
-
2. Distribution Channel
- 2.1. Hypermarkets/Supermarkets
- 2.2. Convenience Stores
- 2.3. Specialist Stores
- 2.4. Online Stores
Kale Chips Market Segmentation By Geography
-
1. North America
- 1.1. United States
- 1.2. Canada
- 1.3. Mexico
- 1.4. Rest of North America
-
2. Europe
- 2.1. United Kingdom
- 2.2. Germany
- 2.3. Spain
- 2.4. France
- 2.5. Italy
- 2.6. Russia
- 2.7. Rest of Europe
-
3. Asia Pacific
- 3.1. China
- 3.2. Japan
- 3.3. India
- 3.4. Australia
- 3.5. Rest of Asia Pacific
-
4. South America
- 4.1. Brazil
- 4.2. Argentina
- 4.3. Rest of South America
-
5. Middle East and Africa
- 5.1. United Arab Emirates
- 5.2. South Africa
- 5.3. Rest of Middle East and Africa
Kale Chips Market REPORT HIGHLIGHTS
| Aspects | Details |
|---|---|
| Study Period | 2019-2033 |
| Base Year | 2024 |
| Estimated Year | 2025 |
| Forecast Period | 2025-2033 |
| Historical Period | 2019-2024 |
| Growth Rate | CAGR of 8.23% from 2019-2033 |
| Segmentation |
|
Table of Contents
- 1. Introduction
- 1.1. Research Scope
- 1.2. Market Segmentation
- 1.3. Research Methodology
- 1.4. Definitions and Assumptions
- 2. Executive Summary
- 2.1. Introduction
- 3. Market Dynamics
- 3.1. Introduction
- 3.2. Market Drivers
- 3.2.1. Increasing Demand for Clean Label Ingredients; Growing Health Consciousness of Consumers
- 3.3. Market Restrains
- 3.3.1. Higher Manufacturing Cost
- 3.4. Market Trends
- 3.4.1. Increasing demand of Vegetable and Healthy Chips
- 4. Market Factor Analysis
- 4.1. Porters Five Forces
- 4.2. Supply/Value Chain
- 4.3. PESTEL analysis
- 4.4. Market Entropy
- 4.5. Patent/Trademark Analysis
- 5. Global Kale Chips Market Analysis, Insights and Forecast, 2019-2031
- 5.1. Market Analysis, Insights and Forecast - by Product Type
- 5.1.1. Dehydrated leaf Crisps/Chips
- 5.1.2. Extruded Chips
- 5.2. Market Analysis, Insights and Forecast - by Distribution Channel
- 5.2.1. Hypermarkets/Supermarkets
- 5.2.2. Convenience Stores
- 5.2.3. Specialist Stores
- 5.2.4. Online Stores
- 5.3. Market Analysis, Insights and Forecast - by Region
- 5.3.1. North America
- 5.3.2. Europe
- 5.3.3. Asia Pacific
- 5.3.4. South America
- 5.3.5. Middle East and Africa
- 5.1. Market Analysis, Insights and Forecast - by Product Type
- 6. North America Kale Chips Market Analysis, Insights and Forecast, 2019-2031
- 6.1. Market Analysis, Insights and Forecast - by Product Type
- 6.1.1. Dehydrated leaf Crisps/Chips
- 6.1.2. Extruded Chips
- 6.2. Market Analysis, Insights and Forecast - by Distribution Channel
- 6.2.1. Hypermarkets/Supermarkets
- 6.2.2. Convenience Stores
- 6.2.3. Specialist Stores
- 6.2.4. Online Stores
- 6.1. Market Analysis, Insights and Forecast - by Product Type
- 7. Europe Kale Chips Market Analysis, Insights and Forecast, 2019-2031
- 7.1. Market Analysis, Insights and Forecast - by Product Type
- 7.1.1. Dehydrated leaf Crisps/Chips
- 7.1.2. Extruded Chips
- 7.2. Market Analysis, Insights and Forecast - by Distribution Channel
- 7.2.1. Hypermarkets/Supermarkets
- 7.2.2. Convenience Stores
- 7.2.3. Specialist Stores
- 7.2.4. Online Stores
- 7.1. Market Analysis, Insights and Forecast - by Product Type
- 8. Asia Pacific Kale Chips Market Analysis, Insights and Forecast, 2019-2031
- 8.1. Market Analysis, Insights and Forecast - by Product Type
- 8.1.1. Dehydrated leaf Crisps/Chips
- 8.1.2. Extruded Chips
- 8.2. Market Analysis, Insights and Forecast - by Distribution Channel
- 8.2.1. Hypermarkets/Supermarkets
- 8.2.2. Convenience Stores
- 8.2.3. Specialist Stores
- 8.2.4. Online Stores
- 8.1. Market Analysis, Insights and Forecast - by Product Type
- 9. South America Kale Chips Market Analysis, Insights and Forecast, 2019-2031
- 9.1. Market Analysis, Insights and Forecast - by Product Type
- 9.1.1. Dehydrated leaf Crisps/Chips
- 9.1.2. Extruded Chips
- 9.2. Market Analysis, Insights and Forecast - by Distribution Channel
- 9.2.1. Hypermarkets/Supermarkets
- 9.2.2. Convenience Stores
- 9.2.3. Specialist Stores
- 9.2.4. Online Stores
- 9.1. Market Analysis, Insights and Forecast - by Product Type
- 10. Middle East and Africa Kale Chips Market Analysis, Insights and Forecast, 2019-2031
- 10.1. Market Analysis, Insights and Forecast - by Product Type
- 10.1.1. Dehydrated leaf Crisps/Chips
- 10.1.2. Extruded Chips
- 10.2. Market Analysis, Insights and Forecast - by Distribution Channel
- 10.2.1. Hypermarkets/Supermarkets
- 10.2.2. Convenience Stores
- 10.2.3. Specialist Stores
- 10.2.4. Online Stores
- 10.1. Market Analysis, Insights and Forecast - by Product Type
- 11. North America Kale Chips Market Analysis, Insights and Forecast, 2019-2031
- 11.1. Market Analysis, Insights and Forecast - By Country/Sub-region
- 11.1.1 United States
- 11.1.2 Canada
- 11.1.3 Mexico
- 11.1.4 Rest of North America
- 12. Europe Kale Chips Market Analysis, Insights and Forecast, 2019-2031
- 12.1. Market Analysis, Insights and Forecast - By Country/Sub-region
- 12.1.1 United Kingdom
- 12.1.2 Germany
- 12.1.3 Spain
- 12.1.4 France
- 12.1.5 Italy
- 12.1.6 Russia
- 12.1.7 Rest of Europe
- 13. Asia Pacific Kale Chips Market Analysis, Insights and Forecast, 2019-2031
- 13.1. Market Analysis, Insights and Forecast - By Country/Sub-region
- 13.1.1 China
- 13.1.2 Japan
- 13.1.3 India
- 13.1.4 Australia
- 13.1.5 Rest of Asia Pacific
- 14. South America Kale Chips Market Analysis, Insights and Forecast, 2019-2031
- 14.1. Market Analysis, Insights and Forecast - By Country/Sub-region
- 14.1.1 Brazil
- 14.1.2 Argentina
- 14.1.3 Rest of South America
- 15. Middle East and Africa Kale Chips Market Analysis, Insights and Forecast, 2019-2031
- 15.1. Market Analysis, Insights and Forecast - By Country/Sub-region
- 15.1.1 United Arab Emirates
- 15.1.2 South Africa
- 15.1.3 Rest of Middle East and Africa
- 16. Competitive Analysis
- 16.1. Global Market Share Analysis 2024
- 16.2. Company Profiles
- 16.2.1 Brad's Plant Based LLC
- 16.2.1.1. Overview
- 16.2.1.2. Products
- 16.2.1.3. SWOT Analysis
- 16.2.1.4. Recent Developments
- 16.2.1.5. Financials (Based on Availability)
- 16.2.2 General Mills Inc
- 16.2.2.1. Overview
- 16.2.2.2. Products
- 16.2.2.3. SWOT Analysis
- 16.2.2.4. Recent Developments
- 16.2.2.5. Financials (Based on Availability)
- 16.2.3 Simply 7 Snacks LLC
- 16.2.3.1. Overview
- 16.2.3.2. Products
- 16.2.3.3. SWOT Analysis
- 16.2.3.4. Recent Developments
- 16.2.3.5. Financials (Based on Availability)
- 16.2.4 Vermont Kale Chips
- 16.2.4.1. Overview
- 16.2.4.2. Products
- 16.2.4.3. SWOT Analysis
- 16.2.4.4. Recent Developments
- 16.2.4.5. Financials (Based on Availability)
- 16.2.5 Lydia's Foods Inc
- 16.2.5.1. Overview
- 16.2.5.2. Products
- 16.2.5.3. SWOT Analysis
- 16.2.5.4. Recent Developments
- 16.2.5.5. Financials (Based on Availability)
- 16.2.6 Healthy Crunch
- 16.2.6.1. Overview
- 16.2.6.2. Products
- 16.2.6.3. SWOT Analysis
- 16.2.6.4. Recent Developments
- 16.2.6.5. Financials (Based on Availability)
- 16.2.7 The Green Snack Co *List Not Exhaustive
- 16.2.7.1. Overview
- 16.2.7.2. Products
- 16.2.7.3. SWOT Analysis
- 16.2.7.4. Recent Developments
- 16.2.7.5. Financials (Based on Availability)
- 16.2.8 The Angel Kale Company
- 16.2.8.1. Overview
- 16.2.8.2. Products
- 16.2.8.3. SWOT Analysis
- 16.2.8.4. Recent Developments
- 16.2.8.5. Financials (Based on Availability)
- 16.2.9 The Kale Factory
- 16.2.9.1. Overview
- 16.2.9.2. Products
- 16.2.9.3. SWOT Analysis
- 16.2.9.4. Recent Developments
- 16.2.9.5. Financials (Based on Availability)
- 16.2.10 GlaxoSmithKline PLC
- 16.2.10.1. Overview
- 16.2.10.2. Products
- 16.2.10.3. SWOT Analysis
- 16.2.10.4. Recent Developments
- 16.2.10.5. Financials (Based on Availability)
- 16.2.1 Brad's Plant Based LLC
List of Figures
- Figure 1: Global Kale Chips Market Revenue Breakdown (Million, %) by Region 2024 & 2032
- Figure 2: Global Kale Chips Market Volume Breakdown (K Tons, %) by Region 2024 & 2032
- Figure 3: North America Kale Chips Market Revenue (Million), by Country 2024 & 2032
- Figure 4: North America Kale Chips Market Volume (K Tons), by Country 2024 & 2032
- Figure 5: North America Kale Chips Market Revenue Share (%), by Country 2024 & 2032
- Figure 6: North America Kale Chips Market Volume Share (%), by Country 2024 & 2032
- Figure 7: Europe Kale Chips Market Revenue (Million), by Country 2024 & 2032
- Figure 8: Europe Kale Chips Market Volume (K Tons), by Country 2024 & 2032
- Figure 9: Europe Kale Chips Market Revenue Share (%), by Country 2024 & 2032
- Figure 10: Europe Kale Chips Market Volume Share (%), by Country 2024 & 2032
- Figure 11: Asia Pacific Kale Chips Market Revenue (Million), by Country 2024 & 2032
- Figure 12: Asia Pacific Kale Chips Market Volume (K Tons), by Country 2024 & 2032
- Figure 13: Asia Pacific Kale Chips Market Revenue Share (%), by Country 2024 & 2032
- Figure 14: Asia Pacific Kale Chips Market Volume Share (%), by Country 2024 & 2032
- Figure 15: South America Kale Chips Market Revenue (Million), by Country 2024 & 2032
- Figure 16: South America Kale Chips Market Volume (K Tons), by Country 2024 & 2032
- Figure 17: South America Kale Chips Market Revenue Share (%), by Country 2024 & 2032
- Figure 18: South America Kale Chips Market Volume Share (%), by Country 2024 & 2032
- Figure 19: Middle East and Africa Kale Chips Market Revenue (Million), by Country 2024 & 2032
- Figure 20: Middle East and Africa Kale Chips Market Volume (K Tons), by Country 2024 & 2032
- Figure 21: Middle East and Africa Kale Chips Market Revenue Share (%), by Country 2024 & 2032
- Figure 22: Middle East and Africa Kale Chips Market Volume Share (%), by Country 2024 & 2032
- Figure 23: North America Kale Chips Market Revenue (Million), by Product Type 2024 & 2032
- Figure 24: North America Kale Chips Market Volume (K Tons), by Product Type 2024 & 2032
- Figure 25: North America Kale Chips Market Revenue Share (%), by Product Type 2024 & 2032
- Figure 26: North America Kale Chips Market Volume Share (%), by Product Type 2024 & 2032
- Figure 27: North America Kale Chips Market Revenue (Million), by Distribution Channel 2024 & 2032
- Figure 28: North America Kale Chips Market Volume (K Tons), by Distribution Channel 2024 & 2032
- Figure 29: North America Kale Chips Market Revenue Share (%), by Distribution Channel 2024 & 2032
- Figure 30: North America Kale Chips Market Volume Share (%), by Distribution Channel 2024 & 2032
- Figure 31: North America Kale Chips Market Revenue (Million), by Country 2024 & 2032
- Figure 32: North America Kale Chips Market Volume (K Tons), by Country 2024 & 2032
- Figure 33: North America Kale Chips Market Revenue Share (%), by Country 2024 & 2032
- Figure 34: North America Kale Chips Market Volume Share (%), by Country 2024 & 2032
- Figure 35: Europe Kale Chips Market Revenue (Million), by Product Type 2024 & 2032
- Figure 36: Europe Kale Chips Market Volume (K Tons), by Product Type 2024 & 2032
- Figure 37: Europe Kale Chips Market Revenue Share (%), by Product Type 2024 & 2032
- Figure 38: Europe Kale Chips Market Volume Share (%), by Product Type 2024 & 2032
- Figure 39: Europe Kale Chips Market Revenue (Million), by Distribution Channel 2024 & 2032
- Figure 40: Europe Kale Chips Market Volume (K Tons), by Distribution Channel 2024 & 2032
- Figure 41: Europe Kale Chips Market Revenue Share (%), by Distribution Channel 2024 & 2032
- Figure 42: Europe Kale Chips Market Volume Share (%), by Distribution Channel 2024 & 2032
- Figure 43: Europe Kale Chips Market Revenue (Million), by Country 2024 & 2032
- Figure 44: Europe Kale Chips Market Volume (K Tons), by Country 2024 & 2032
- Figure 45: Europe Kale Chips Market Revenue Share (%), by Country 2024 & 2032
- Figure 46: Europe Kale Chips Market Volume Share (%), by Country 2024 & 2032
- Figure 47: Asia Pacific Kale Chips Market Revenue (Million), by Product Type 2024 & 2032
- Figure 48: Asia Pacific Kale Chips Market Volume (K Tons), by Product Type 2024 & 2032
- Figure 49: Asia Pacific Kale Chips Market Revenue Share (%), by Product Type 2024 & 2032
- Figure 50: Asia Pacific Kale Chips Market Volume Share (%), by Product Type 2024 & 2032
- Figure 51: Asia Pacific Kale Chips Market Revenue (Million), by Distribution Channel 2024 & 2032
- Figure 52: Asia Pacific Kale Chips Market Volume (K Tons), by Distribution Channel 2024 & 2032
- Figure 53: Asia Pacific Kale Chips Market Revenue Share (%), by Distribution Channel 2024 & 2032
- Figure 54: Asia Pacific Kale Chips Market Volume Share (%), by Distribution Channel 2024 & 2032
- Figure 55: Asia Pacific Kale Chips Market Revenue (Million), by Country 2024 & 2032
- Figure 56: Asia Pacific Kale Chips Market Volume (K Tons), by Country 2024 & 2032
- Figure 57: Asia Pacific Kale Chips Market Revenue Share (%), by Country 2024 & 2032
- Figure 58: Asia Pacific Kale Chips Market Volume Share (%), by Country 2024 & 2032
- Figure 59: South America Kale Chips Market Revenue (Million), by Product Type 2024 & 2032
- Figure 60: South America Kale Chips Market Volume (K Tons), by Product Type 2024 & 2032
- Figure 61: South America Kale Chips Market Revenue Share (%), by Product Type 2024 & 2032
- Figure 62: South America Kale Chips Market Volume Share (%), by Product Type 2024 & 2032
- Figure 63: South America Kale Chips Market Revenue (Million), by Distribution Channel 2024 & 2032
- Figure 64: South America Kale Chips Market Volume (K Tons), by Distribution Channel 2024 & 2032
- Figure 65: South America Kale Chips Market Revenue Share (%), by Distribution Channel 2024 & 2032
- Figure 66: South America Kale Chips Market Volume Share (%), by Distribution Channel 2024 & 2032
- Figure 67: South America Kale Chips Market Revenue (Million), by Country 2024 & 2032
- Figure 68: South America Kale Chips Market Volume (K Tons), by Country 2024 & 2032
- Figure 69: South America Kale Chips Market Revenue Share (%), by Country 2024 & 2032
- Figure 70: South America Kale Chips Market Volume Share (%), by Country 2024 & 2032
- Figure 71: Middle East and Africa Kale Chips Market Revenue (Million), by Product Type 2024 & 2032
- Figure 72: Middle East and Africa Kale Chips Market Volume (K Tons), by Product Type 2024 & 2032
- Figure 73: Middle East and Africa Kale Chips Market Revenue Share (%), by Product Type 2024 & 2032
- Figure 74: Middle East and Africa Kale Chips Market Volume Share (%), by Product Type 2024 & 2032
- Figure 75: Middle East and Africa Kale Chips Market Revenue (Million), by Distribution Channel 2024 & 2032
- Figure 76: Middle East and Africa Kale Chips Market Volume (K Tons), by Distribution Channel 2024 & 2032
- Figure 77: Middle East and Africa Kale Chips Market Revenue Share (%), by Distribution Channel 2024 & 2032
- Figure 78: Middle East and Africa Kale Chips Market Volume Share (%), by Distribution Channel 2024 & 2032
- Figure 79: Middle East and Africa Kale Chips Market Revenue (Million), by Country 2024 & 2032
- Figure 80: Middle East and Africa Kale Chips Market Volume (K Tons), by Country 2024 & 2032
- Figure 81: Middle East and Africa Kale Chips Market Revenue Share (%), by Country 2024 & 2032
- Figure 82: Middle East and Africa Kale Chips Market Volume Share (%), by Country 2024 & 2032
List of Tables
- Table 1: Global Kale Chips Market Revenue Million Forecast, by Region 2019 & 2032
- Table 2: Global Kale Chips Market Volume K Tons Forecast, by Region 2019 & 2032
- Table 3: Global Kale Chips Market Revenue Million Forecast, by Product Type 2019 & 2032
- Table 4: Global Kale Chips Market Volume K Tons Forecast, by Product Type 2019 & 2032
- Table 5: Global Kale Chips Market Revenue Million Forecast, by Distribution Channel 2019 & 2032
- Table 6: Global Kale Chips Market Volume K Tons Forecast, by Distribution Channel 2019 & 2032
- Table 7: Global Kale Chips Market Revenue Million Forecast, by Region 2019 & 2032
- Table 8: Global Kale Chips Market Volume K Tons Forecast, by Region 2019 & 2032
- Table 9: Global Kale Chips Market Revenue Million Forecast, by Country 2019 & 2032
- Table 10: Global Kale Chips Market Volume K Tons Forecast, by Country 2019 & 2032
- Table 11: United States Kale Chips Market Revenue (Million) Forecast, by Application 2019 & 2032
- Table 12: United States Kale Chips Market Volume (K Tons) Forecast, by Application 2019 & 2032
- Table 13: Canada Kale Chips Market Revenue (Million) Forecast, by Application 2019 & 2032
- Table 14: Canada Kale Chips Market Volume (K Tons) Forecast, by Application 2019 & 2032
- Table 15: Mexico Kale Chips Market Revenue (Million) Forecast, by Application 2019 & 2032
- Table 16: Mexico Kale Chips Market Volume (K Tons) Forecast, by Application 2019 & 2032
- Table 17: Rest of North America Kale Chips Market Revenue (Million) Forecast, by Application 2019 & 2032
- Table 18: Rest of North America Kale Chips Market Volume (K Tons) Forecast, by Application 2019 & 2032
- Table 19: Global Kale Chips Market Revenue Million Forecast, by Country 2019 & 2032
- Table 20: Global Kale Chips Market Volume K Tons Forecast, by Country 2019 & 2032
- Table 21: United Kingdom Kale Chips Market Revenue (Million) Forecast, by Application 2019 & 2032
- Table 22: United Kingdom Kale Chips Market Volume (K Tons) Forecast, by Application 2019 & 2032
- Table 23: Germany Kale Chips Market Revenue (Million) Forecast, by Application 2019 & 2032
- Table 24: Germany Kale Chips Market Volume (K Tons) Forecast, by Application 2019 & 2032
- Table 25: Spain Kale Chips Market Revenue (Million) Forecast, by Application 2019 & 2032
- Table 26: Spain Kale Chips Market Volume (K Tons) Forecast, by Application 2019 & 2032
- Table 27: France Kale Chips Market Revenue (Million) Forecast, by Application 2019 & 2032
- Table 28: France Kale Chips Market Volume (K Tons) Forecast, by Application 2019 & 2032
- Table 29: Italy Kale Chips Market Revenue (Million) Forecast, by Application 2019 & 2032
- Table 30: Italy Kale Chips Market Volume (K Tons) Forecast, by Application 2019 & 2032
- Table 31: Russia Kale Chips Market Revenue (Million) Forecast, by Application 2019 & 2032
- Table 32: Russia Kale Chips Market Volume (K Tons) Forecast, by Application 2019 & 2032
- Table 33: Rest of Europe Kale Chips Market Revenue (Million) Forecast, by Application 2019 & 2032
- Table 34: Rest of Europe Kale Chips Market Volume (K Tons) Forecast, by Application 2019 & 2032
- Table 35: Global Kale Chips Market Revenue Million Forecast, by Country 2019 & 2032
- Table 36: Global Kale Chips Market Volume K Tons Forecast, by Country 2019 & 2032
- Table 37: China Kale Chips Market Revenue (Million) Forecast, by Application 2019 & 2032
- Table 38: China Kale Chips Market Volume (K Tons) Forecast, by Application 2019 & 2032
- Table 39: Japan Kale Chips Market Revenue (Million) Forecast, by Application 2019 & 2032
- Table 40: Japan Kale Chips Market Volume (K Tons) Forecast, by Application 2019 & 2032
- Table 41: India Kale Chips Market Revenue (Million) Forecast, by Application 2019 & 2032
- Table 42: India Kale Chips Market Volume (K Tons) Forecast, by Application 2019 & 2032
- Table 43: Australia Kale Chips Market Revenue (Million) Forecast, by Application 2019 & 2032
- Table 44: Australia Kale Chips Market Volume (K Tons) Forecast, by Application 2019 & 2032
- Table 45: Rest of Asia Pacific Kale Chips Market Revenue (Million) Forecast, by Application 2019 & 2032
- Table 46: Rest of Asia Pacific Kale Chips Market Volume (K Tons) Forecast, by Application 2019 & 2032
- Table 47: Global Kale Chips Market Revenue Million Forecast, by Country 2019 & 2032
- Table 48: Global Kale Chips Market Volume K Tons Forecast, by Country 2019 & 2032
- Table 49: Brazil Kale Chips Market Revenue (Million) Forecast, by Application 2019 & 2032
- Table 50: Brazil Kale Chips Market Volume (K Tons) Forecast, by Application 2019 & 2032
- Table 51: Argentina Kale Chips Market Revenue (Million) Forecast, by Application 2019 & 2032
- Table 52: Argentina Kale Chips Market Volume (K Tons) Forecast, by Application 2019 & 2032
- Table 53: Rest of South America Kale Chips Market Revenue (Million) Forecast, by Application 2019 & 2032
- Table 54: Rest of South America Kale Chips Market Volume (K Tons) Forecast, by Application 2019 & 2032
- Table 55: Global Kale Chips Market Revenue Million Forecast, by Country 2019 & 2032
- Table 56: Global Kale Chips Market Volume K Tons Forecast, by Country 2019 & 2032
- Table 57: United Arab Emirates Kale Chips Market Revenue (Million) Forecast, by Application 2019 & 2032
- Table 58: United Arab Emirates Kale Chips Market Volume (K Tons) Forecast, by Application 2019 & 2032
- Table 59: South Africa Kale Chips Market Revenue (Million) Forecast, by Application 2019 & 2032
- Table 60: South Africa Kale Chips Market Volume (K Tons) Forecast, by Application 2019 & 2032
- Table 61: Rest of Middle East and Africa Kale Chips Market Revenue (Million) Forecast, by Application 2019 & 2032
- Table 62: Rest of Middle East and Africa Kale Chips Market Volume (K Tons) Forecast, by Application 2019 & 2032
- Table 63: Global Kale Chips Market Revenue Million Forecast, by Product Type 2019 & 2032
- Table 64: Global Kale Chips Market Volume K Tons Forecast, by Product Type 2019 & 2032
- Table 65: Global Kale Chips Market Revenue Million Forecast, by Distribution Channel 2019 & 2032
- Table 66: Global Kale Chips Market Volume K Tons Forecast, by Distribution Channel 2019 & 2032
- Table 67: Global Kale Chips Market Revenue Million Forecast, by Country 2019 & 2032
- Table 68: Global Kale Chips Market Volume K Tons Forecast, by Country 2019 & 2032
- Table 69: United States Kale Chips Market Revenue (Million) Forecast, by Application 2019 & 2032
- Table 70: United States Kale Chips Market Volume (K Tons) Forecast, by Application 2019 & 2032
- Table 71: Canada Kale Chips Market Revenue (Million) Forecast, by Application 2019 & 2032
- Table 72: Canada Kale Chips Market Volume (K Tons) Forecast, by Application 2019 & 2032
- Table 73: Mexico Kale Chips Market Revenue (Million) Forecast, by Application 2019 & 2032
- Table 74: Mexico Kale Chips Market Volume (K Tons) Forecast, by Application 2019 & 2032
- Table 75: Rest of North America Kale Chips Market Revenue (Million) Forecast, by Application 2019 & 2032
- Table 76: Rest of North America Kale Chips Market Volume (K Tons) Forecast, by Application 2019 & 2032
- Table 77: Global Kale Chips Market Revenue Million Forecast, by Product Type 2019 & 2032
- Table 78: Global Kale Chips Market Volume K Tons Forecast, by Product Type 2019 & 2032
- Table 79: Global Kale Chips Market Revenue Million Forecast, by Distribution Channel 2019 & 2032
- Table 80: Global Kale Chips Market Volume K Tons Forecast, by Distribution Channel 2019 & 2032
- Table 81: Global Kale Chips Market Revenue Million Forecast, by Country 2019 & 2032
- Table 82: Global Kale Chips Market Volume K Tons Forecast, by Country 2019 & 2032
- Table 83: United Kingdom Kale Chips Market Revenue (Million) Forecast, by Application 2019 & 2032
- Table 84: United Kingdom Kale Chips Market Volume (K Tons) Forecast, by Application 2019 & 2032
- Table 85: Germany Kale Chips Market Revenue (Million) Forecast, by Application 2019 & 2032
- Table 86: Germany Kale Chips Market Volume (K Tons) Forecast, by Application 2019 & 2032
- Table 87: Spain Kale Chips Market Revenue (Million) Forecast, by Application 2019 & 2032
- Table 88: Spain Kale Chips Market Volume (K Tons) Forecast, by Application 2019 & 2032
- Table 89: France Kale Chips Market Revenue (Million) Forecast, by Application 2019 & 2032
- Table 90: France Kale Chips Market Volume (K Tons) Forecast, by Application 2019 & 2032
- Table 91: Italy Kale Chips Market Revenue (Million) Forecast, by Application 2019 & 2032
- Table 92: Italy Kale Chips Market Volume (K Tons) Forecast, by Application 2019 & 2032
- Table 93: Russia Kale Chips Market Revenue (Million) Forecast, by Application 2019 & 2032
- Table 94: Russia Kale Chips Market Volume (K Tons) Forecast, by Application 2019 & 2032
- Table 95: Rest of Europe Kale Chips Market Revenue (Million) Forecast, by Application 2019 & 2032
- Table 96: Rest of Europe Kale Chips Market Volume (K Tons) Forecast, by Application 2019 & 2032
- Table 97: Global Kale Chips Market Revenue Million Forecast, by Product Type 2019 & 2032
- Table 98: Global Kale Chips Market Volume K Tons Forecast, by Product Type 2019 & 2032
- Table 99: Global Kale Chips Market Revenue Million Forecast, by Distribution Channel 2019 & 2032
- Table 100: Global Kale Chips Market Volume K Tons Forecast, by Distribution Channel 2019 & 2032
- Table 101: Global Kale Chips Market Revenue Million Forecast, by Country 2019 & 2032
- Table 102: Global Kale Chips Market Volume K Tons Forecast, by Country 2019 & 2032
- Table 103: China Kale Chips Market Revenue (Million) Forecast, by Application 2019 & 2032
- Table 104: China Kale Chips Market Volume (K Tons) Forecast, by Application 2019 & 2032
- Table 105: Japan Kale Chips Market Revenue (Million) Forecast, by Application 2019 & 2032
- Table 106: Japan Kale Chips Market Volume (K Tons) Forecast, by Application 2019 & 2032
- Table 107: India Kale Chips Market Revenue (Million) Forecast, by Application 2019 & 2032
- Table 108: India Kale Chips Market Volume (K Tons) Forecast, by Application 2019 & 2032
- Table 109: Australia Kale Chips Market Revenue (Million) Forecast, by Application 2019 & 2032
- Table 110: Australia Kale Chips Market Volume (K Tons) Forecast, by Application 2019 & 2032
- Table 111: Rest of Asia Pacific Kale Chips Market Revenue (Million) Forecast, by Application 2019 & 2032
- Table 112: Rest of Asia Pacific Kale Chips Market Volume (K Tons) Forecast, by Application 2019 & 2032
- Table 113: Global Kale Chips Market Revenue Million Forecast, by Product Type 2019 & 2032
- Table 114: Global Kale Chips Market Volume K Tons Forecast, by Product Type 2019 & 2032
- Table 115: Global Kale Chips Market Revenue Million Forecast, by Distribution Channel 2019 & 2032
- Table 116: Global Kale Chips Market Volume K Tons Forecast, by Distribution Channel 2019 & 2032
- Table 117: Global Kale Chips Market Revenue Million Forecast, by Country 2019 & 2032
- Table 118: Global Kale Chips Market Volume K Tons Forecast, by Country 2019 & 2032
- Table 119: Brazil Kale Chips Market Revenue (Million) Forecast, by Application 2019 & 2032
- Table 120: Brazil Kale Chips Market Volume (K Tons) Forecast, by Application 2019 & 2032
- Table 121: Argentina Kale Chips Market Revenue (Million) Forecast, by Application 2019 & 2032
- Table 122: Argentina Kale Chips Market Volume (K Tons) Forecast, by Application 2019 & 2032
- Table 123: Rest of South America Kale Chips Market Revenue (Million) Forecast, by Application 2019 & 2032
- Table 124: Rest of South America Kale Chips Market Volume (K Tons) Forecast, by Application 2019 & 2032
- Table 125: Global Kale Chips Market Revenue Million Forecast, by Product Type 2019 & 2032
- Table 126: Global Kale Chips Market Volume K Tons Forecast, by Product Type 2019 & 2032
- Table 127: Global Kale Chips Market Revenue Million Forecast, by Distribution Channel 2019 & 2032
- Table 128: Global Kale Chips Market Volume K Tons Forecast, by Distribution Channel 2019 & 2032
- Table 129: Global Kale Chips Market Revenue Million Forecast, by Country 2019 & 2032
- Table 130: Global Kale Chips Market Volume K Tons Forecast, by Country 2019 & 2032
- Table 131: United Arab Emirates Kale Chips Market Revenue (Million) Forecast, by Application 2019 & 2032
- Table 132: United Arab Emirates Kale Chips Market Volume (K Tons) Forecast, by Application 2019 & 2032
- Table 133: South Africa Kale Chips Market Revenue (Million) Forecast, by Application 2019 & 2032
- Table 134: South Africa Kale Chips Market Volume (K Tons) Forecast, by Application 2019 & 2032
- Table 135: Rest of Middle East and Africa Kale Chips Market Revenue (Million) Forecast, by Application 2019 & 2032
- Table 136: Rest of Middle East and Africa Kale Chips Market Volume (K Tons) Forecast, by Application 2019 & 2032
Frequently Asked Questions
1. What is the projected Compound Annual Growth Rate (CAGR) of the Kale Chips Market?
The projected CAGR is approximately 8.23%.
2. Which companies are prominent players in the Kale Chips Market?
Key companies in the market include Brad's Plant Based LLC, General Mills Inc, Simply 7 Snacks LLC, Vermont Kale Chips, Lydia's Foods Inc, Healthy Crunch, The Green Snack Co *List Not Exhaustive, The Angel Kale Company, The Kale Factory, GlaxoSmithKline PLC.
3. What are the main segments of the Kale Chips Market?
The market segments include Product Type, Distribution Channel.
4. Can you provide details about the market size?
The market size is estimated to be USD 252.7 Million as of 2022.
5. What are some drivers contributing to market growth?
Increasing Demand for Clean Label Ingredients; Growing Health Consciousness of Consumers.
6. What are the notable trends driving market growth?
Increasing demand of Vegetable and Healthy Chips.
7. Are there any restraints impacting market growth?
Higher Manufacturing Cost.
8. Can you provide examples of recent developments in the market?
In September 2020, Ecoideas announced the launch of Solar Raw's Kaley's Kale Chips in four new flavors to meet the growing demand for nutritionally dense and naturally delicious plant based snacks that appeal to mainstream snacker.
9. What pricing options are available for accessing the report?
Pricing options include single-user, multi-user, and enterprise licenses priced at USD 4750, USD 5250, and USD 8750 respectively.
10. Is the market size provided in terms of value or volume?
The market size is provided in terms of value, measured in Million and volume, measured in K Tons.
11. Are there any specific market keywords associated with the report?
Yes, the market keyword associated with the report is "Kale Chips Market," which aids in identifying and referencing the specific market segment covered.
12. How do I determine which pricing option suits my needs best?
The pricing options vary based on user requirements and access needs. Individual users may opt for single-user licenses, while businesses requiring broader access may choose multi-user or enterprise licenses for cost-effective access to the report.
13. Are there any additional resources or data provided in the Kale Chips Market report?
While the report offers comprehensive insights, it's advisable to review the specific contents or supplementary materials provided to ascertain if additional resources or data are available.
14. How can I stay updated on further developments or reports in the Kale Chips Market?
To stay informed about further developments, trends, and reports in the Kale Chips Market, consider subscribing to industry newsletters, following relevant companies and organizations, or regularly checking reputable industry news sources and publications.
Methodology
Step 1 - Identification of Relevant Samples Size from Population Database


Step 2 - Approaches for Defining Global Market Size (Value, Volume* & Price*)

Note*: In applicable scenarios
Step 3 - Data Sources
Primary Research
- Web Analytics
- Survey Reports
- Research Institute
- Latest Research Reports
- Opinion Leaders
Secondary Research
- Annual Reports
- White Paper
- Latest Press Release
- Industry Association
- Paid Database
- Investor Presentations

Step 4 - Data Triangulation
Involves using different sources of information in order to increase the validity of a study
These sources are likely to be stakeholders in a program - participants, other researchers, program staff, other community members, and so on.
Then we put all data in single framework & apply various statistical tools to find out the dynamic on the market.
During the analysis stage, feedback from the stakeholder groups would be compared to determine areas of agreement as well as areas of divergence


