
Key Insights
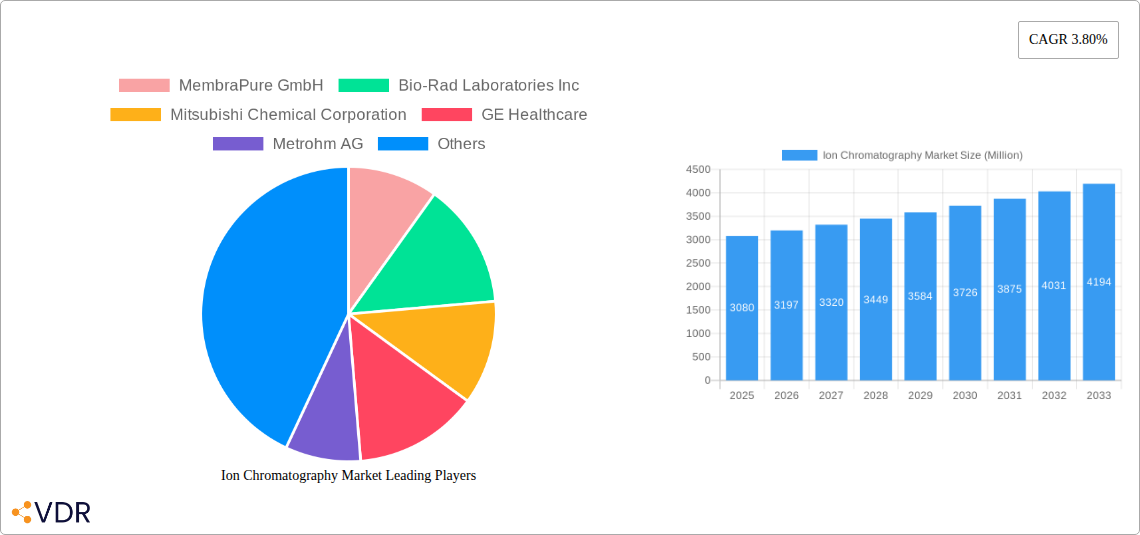
The Ion Chromatography (IC) market is experiencing robust growth, projected to reach a market size of $3.08 billion in 2025 and maintain a Compound Annual Growth Rate (CAGR) of 3.80% from 2025 to 2033. This expansion is fueled by several key drivers. The increasing demand for precise environmental monitoring, particularly for pollutants and contaminants in water and soil, is significantly boosting the adoption of IC technologies. Furthermore, the pharmaceutical and food industries rely heavily on IC for quality control and ensuring product purity, contributing significantly to market growth. Stringent regulatory frameworks concerning food safety and pharmaceutical purity are enforcing the use of advanced analytical techniques like IC. Technological advancements, such as the development of high-performance and miniaturized IC systems with enhanced sensitivity and automation capabilities, are also driving market expansion. The expanding chemicals industry, needing precise composition analysis, further contributes to the overall market demand.
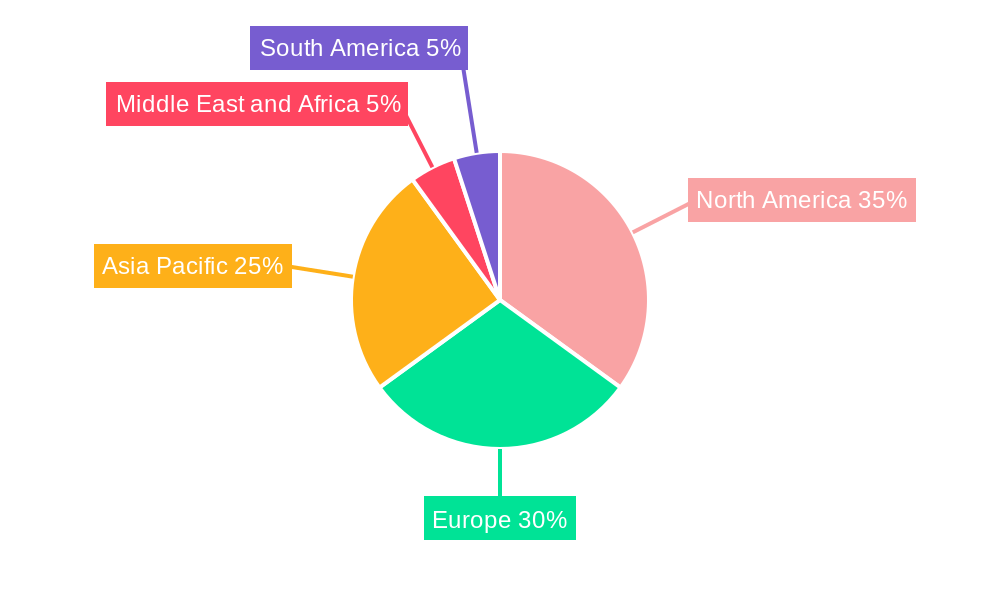
While the market presents substantial opportunities, it also faces certain restraints. The high initial investment cost associated with IC equipment can be a barrier to entry for smaller players, particularly in developing economies. Furthermore, the need for skilled technicians to operate and maintain these sophisticated instruments poses a challenge. However, the ongoing development of user-friendly interfaces and readily available training programs are mitigating this issue. The market segmentation reflects the diverse applications, with environmental testing and pharmaceutical industries leading the charge, followed by food and chemical sectors. Key players like Thermo Fisher Scientific, Agilent Technologies, and Waters Corporation are driving innovation and shaping the competitive landscape through strategic acquisitions, product launches, and partnerships. Regional growth is expected to be diverse, with North America and Europe maintaining significant market share due to well-established regulatory frameworks and advanced infrastructure, while the Asia-Pacific region is poised for substantial growth owing to increasing industrialization and rising environmental awareness.
This in-depth report provides a comprehensive analysis of the Ion Chromatography market, encompassing market dynamics, growth trends, regional analysis, product landscape, key players, and future outlook. The study period covers 2019-2033, with a base year of 2025 and a forecast period of 2025-2033. The report is essential for industry professionals, investors, and researchers seeking a granular understanding of this dynamic market. Market values are presented in Million units.
Ion Chromatography Market Dynamics & Structure
The Ion Chromatography market is characterized by moderate concentration, with several key players holding significant market share. Technological innovation, particularly in areas like high-performance ion chromatography (HPIC) and miniaturized systems, is a major driver. Stringent regulatory frameworks, especially within the environmental testing and pharmaceutical sectors, significantly influence market growth. Competitive product substitutes, such as capillary electrophoresis, exist but often lack the versatility and sensitivity of ion chromatography. The end-user demographics are diverse, encompassing environmental agencies, pharmaceutical companies, food and beverage manufacturers, and chemical industries. M&A activity within the sector is moderate, with strategic acquisitions aimed at expanding product portfolios and geographical reach.
- Market Concentration: Moderately concentrated, with top 5 players holding approximately xx% market share in 2024.
- Technological Innovation: Significant advancements in column technology, detection methods, and automation are driving market growth.
- Regulatory Landscape: Stringent regulations in key industries (pharmaceutical, environmental) create strong demand.
- Competitive Substitutes: Capillary electrophoresis poses some competition, but ion chromatography remains dominant due to its versatility.
- M&A Activity: Moderate level of mergers and acquisitions, primarily focused on expanding capabilities and market access. xx M&A deals observed in the historical period.
- Innovation Barriers: High R&D costs and the need for specialized expertise can pose barriers to entry for new players.
Ion Chromatography Market Growth Trends & Insights
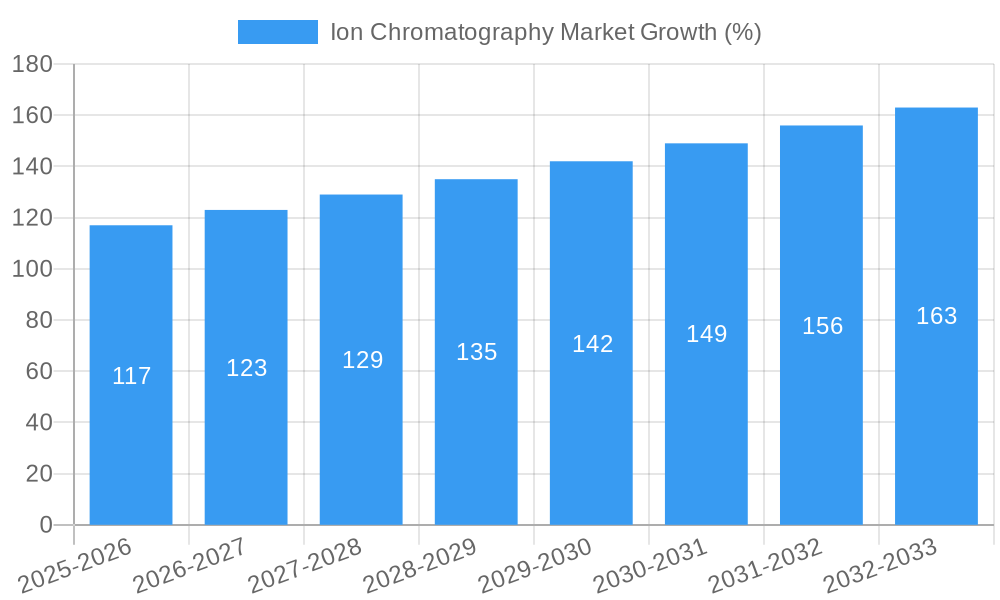
The global Ion Chromatography market experienced steady growth during the historical period (2019-2024), driven by increasing demand from various end-user industries. The market size reached xx Million units in 2024 and is projected to reach xx Million units by 2033, exhibiting a Compound Annual Growth Rate (CAGR) of xx% during the forecast period (2025-2033). This growth is fueled by technological advancements leading to higher sensitivity and throughput, wider application scope, and increasing regulatory compliance requirements. Market penetration is high in developed regions, but significant growth potential remains in emerging economies. The adoption rate is steadily increasing across various industries, particularly in environmental monitoring and pharmaceutical quality control. Consumer behavior shows a preference towards automated, user-friendly systems, and higher throughput solutions.
Dominant Regions, Countries, or Segments in Ion Chromatography Market
North America currently holds the largest market share in the Ion Chromatography market, followed by Europe. Within technology segments, Ion-exchange Chromatography dominates, owing to its wide applicability and established market presence. The Pharmaceutical Industry is the largest application segment, driven by stringent quality control requirements.
- Leading Region: North America (xx% market share in 2024)
- Leading Technology Segment: Ion-exchange Chromatography (xx% market share in 2024)
- Leading Application Segment: Pharmaceutical Industry (xx% market share in 2024)
- Key Drivers: Stringent environmental regulations, rising demand for high-quality pharmaceuticals, and increasing food safety concerns.
- Growth Potential: Significant growth potential exists in emerging markets (Asia-Pacific, Latin America) due to increasing industrialization and infrastructure development.
Ion Chromatography Market Product Landscape
The Ion Chromatography market offers a diverse range of instruments and consumables, including high-performance ion chromatographs (HPIC), suppressed and non-suppressed conductivity detectors, advanced sample preparation systems, and various chromatography columns with diverse stationary phases. Recent innovations focus on miniaturization, enhanced sensitivity, improved automation, and user-friendly software interfaces. Unique selling propositions frequently include superior detection limits, faster analysis times, and reduced solvent consumption.
Key Drivers, Barriers & Challenges in Ion Chromatography Market
Key Drivers: Increasing regulatory requirements for environmental monitoring, stringent quality control measures in the pharmaceutical industry, and the growing demand for food safety testing are significant drivers. Technological advancements, such as the development of novel column chemistries and detection methods, further boost market growth.
Key Barriers & Challenges: High initial investment costs for advanced systems, the need for skilled operators, and the potential for interference from complex matrices can hinder market growth. Supply chain disruptions can also lead to fluctuations in instrument and consumable availability. Regulatory changes and stringent compliance requirements impose additional challenges.
Emerging Opportunities in Ion Chromatography Market
Emerging opportunities include the increasing application of ion chromatography in emerging fields such as metabolomics, proteomics, and clinical diagnostics. The development of portable and miniaturized systems for on-site analysis opens up new applications in environmental monitoring and field testing. The growing demand for cost-effective and efficient solutions is driving the development of new, innovative consumables.
Growth Accelerators in the Ion Chromatography Market Industry
Technological breakthroughs in miniaturization, automation, and detection capabilities are driving market growth. Strategic partnerships and collaborations between instrument manufacturers and consumables providers are expanding market reach. Increased investments in R&D aimed at developing novel applications are fueling long-term growth.
Key Players Shaping the Ion Chromatography Market Market
- MembraPure GmbH
- Bio-Rad Laboratories Inc
- Mitsubishi Chemical Corporation
- GE Healthcare
- Metrohm AG
- Waters
- Tosoh Corporation
- Agilent Technologies Inc
- Qingdao Shenghan
- Thermo Fisher Scientific
- Shimadzu Corporation
- Perkin Elmer Inc
Notable Milestones in Ion Chromatography Market Sector
- June 2022: Bio-Rad launched EconoFit Chromatography Column packs, offering various prepacked resins.
- May 2022: Thermo Fisher launched workflows for quat pesticide determination and quantitation in food.
In-Depth Ion Chromatography Market Market Outlook
The Ion Chromatography market is poised for continued growth, driven by technological advancements, expanding applications, and increasing regulatory requirements. Strategic investments in R&D, coupled with strategic partnerships and market expansion strategies, will further accelerate market growth. The focus on developing user-friendly, automated systems will enhance market penetration, particularly in emerging economies. The long-term outlook remains positive, with significant growth potential across various industry sectors.
Ion Chromatography Market Segmentation
-
1. Technology
- 1.1. Ion-exchange Chromatography
- 1.2. Ion-exclusion Chromatography
- 1.3. Ion-pair Chromatography
-
2. Application
- 2.1. Environmental Testing
- 2.2. Pharmaceutical Industry
- 2.3. Food Industry
- 2.4. Chemicals Industry
- 2.5. Other Applications
Ion Chromatography Market Segmentation By Geography
-
1. North America
- 1.1. United States
- 1.2. Canada
- 1.3. Mexico
-
2. Europe
- 2.1. Germany
- 2.2. United Kingdom
- 2.3. France
- 2.4. Italy
- 2.5. Spain
- 2.6. Rest of Europe
-
3. Asia Pacific
- 3.1. China
- 3.2. Japan
- 3.3. India
- 3.4. Australia
- 3.5. South korea
- 3.6. Rest of Asia Pacific
-
4. Middle East and Africa
- 4.1. GCC
- 4.2. South Africa
- 4.3. Rest of Middle East and Africa
-
5. South America
- 5.1. Brazil
- 5.2. Argentina
- 5.3. Rest of South America
Ion Chromatography Market REPORT HIGHLIGHTS
| Aspects | Details |
|---|---|
| Study Period | 2019-2033 |
| Base Year | 2024 |
| Estimated Year | 2025 |
| Forecast Period | 2025-2033 |
| Historical Period | 2019-2024 |
| Growth Rate | CAGR of 3.80% from 2019-2033 |
| Segmentation |
|
Table of Contents
- 1. Introduction
- 1.1. Research Scope
- 1.2. Market Segmentation
- 1.3. Research Methodology
- 1.4. Definitions and Assumptions
- 2. Executive Summary
- 2.1. Introduction
- 3. Market Dynamics
- 3.1. Introduction
- 3.2. Market Drivers
- 3.2.1. Increasing Academic and Commercial R&D Spending on Pharmaceuticals; Increasing Use of Ion Chromatography Technique in Various Fields; Technological Advancements in Ion Chromatography
- 3.3. Market Restrains
- 3.3.1. High Cost of Instruments; Lack of Skilled Personnel to Handle Equipment
- 3.4. Market Trends
- 3.4.1. Application in Pharmaceutical Industry is Expected to Exhibit Fastest Growth Over the Forecast Period
- 4. Market Factor Analysis
- 4.1. Porters Five Forces
- 4.2. Supply/Value Chain
- 4.3. PESTEL analysis
- 4.4. Market Entropy
- 4.5. Patent/Trademark Analysis
- 5. Global Ion Chromatography Market Analysis, Insights and Forecast, 2019-2031
- 5.1. Market Analysis, Insights and Forecast - by Technology
- 5.1.1. Ion-exchange Chromatography
- 5.1.2. Ion-exclusion Chromatography
- 5.1.3. Ion-pair Chromatography
- 5.2. Market Analysis, Insights and Forecast - by Application
- 5.2.1. Environmental Testing
- 5.2.2. Pharmaceutical Industry
- 5.2.3. Food Industry
- 5.2.4. Chemicals Industry
- 5.2.5. Other Applications
- 5.3. Market Analysis, Insights and Forecast - by Region
- 5.3.1. North America
- 5.3.2. Europe
- 5.3.3. Asia Pacific
- 5.3.4. Middle East and Africa
- 5.3.5. South America
- 5.1. Market Analysis, Insights and Forecast - by Technology
- 6. North America Ion Chromatography Market Analysis, Insights and Forecast, 2019-2031
- 6.1. Market Analysis, Insights and Forecast - by Technology
- 6.1.1. Ion-exchange Chromatography
- 6.1.2. Ion-exclusion Chromatography
- 6.1.3. Ion-pair Chromatography
- 6.2. Market Analysis, Insights and Forecast - by Application
- 6.2.1. Environmental Testing
- 6.2.2. Pharmaceutical Industry
- 6.2.3. Food Industry
- 6.2.4. Chemicals Industry
- 6.2.5. Other Applications
- 6.1. Market Analysis, Insights and Forecast - by Technology
- 7. Europe Ion Chromatography Market Analysis, Insights and Forecast, 2019-2031
- 7.1. Market Analysis, Insights and Forecast - by Technology
- 7.1.1. Ion-exchange Chromatography
- 7.1.2. Ion-exclusion Chromatography
- 7.1.3. Ion-pair Chromatography
- 7.2. Market Analysis, Insights and Forecast - by Application
- 7.2.1. Environmental Testing
- 7.2.2. Pharmaceutical Industry
- 7.2.3. Food Industry
- 7.2.4. Chemicals Industry
- 7.2.5. Other Applications
- 7.1. Market Analysis, Insights and Forecast - by Technology
- 8. Asia Pacific Ion Chromatography Market Analysis, Insights and Forecast, 2019-2031
- 8.1. Market Analysis, Insights and Forecast - by Technology
- 8.1.1. Ion-exchange Chromatography
- 8.1.2. Ion-exclusion Chromatography
- 8.1.3. Ion-pair Chromatography
- 8.2. Market Analysis, Insights and Forecast - by Application
- 8.2.1. Environmental Testing
- 8.2.2. Pharmaceutical Industry
- 8.2.3. Food Industry
- 8.2.4. Chemicals Industry
- 8.2.5. Other Applications
- 8.1. Market Analysis, Insights and Forecast - by Technology
- 9. Middle East and Africa Ion Chromatography Market Analysis, Insights and Forecast, 2019-2031
- 9.1. Market Analysis, Insights and Forecast - by Technology
- 9.1.1. Ion-exchange Chromatography
- 9.1.2. Ion-exclusion Chromatography
- 9.1.3. Ion-pair Chromatography
- 9.2. Market Analysis, Insights and Forecast - by Application
- 9.2.1. Environmental Testing
- 9.2.2. Pharmaceutical Industry
- 9.2.3. Food Industry
- 9.2.4. Chemicals Industry
- 9.2.5. Other Applications
- 9.1. Market Analysis, Insights and Forecast - by Technology
- 10. South America Ion Chromatography Market Analysis, Insights and Forecast, 2019-2031
- 10.1. Market Analysis, Insights and Forecast - by Technology
- 10.1.1. Ion-exchange Chromatography
- 10.1.2. Ion-exclusion Chromatography
- 10.1.3. Ion-pair Chromatography
- 10.2. Market Analysis, Insights and Forecast - by Application
- 10.2.1. Environmental Testing
- 10.2.2. Pharmaceutical Industry
- 10.2.3. Food Industry
- 10.2.4. Chemicals Industry
- 10.2.5. Other Applications
- 10.1. Market Analysis, Insights and Forecast - by Technology
- 11. North America Ion Chromatography Market Analysis, Insights and Forecast, 2019-2031
- 11.1. Market Analysis, Insights and Forecast - By Country/Sub-region
- 11.1.1 United States
- 11.1.2 Canada
- 11.1.3 Mexico
- 12. Europe Ion Chromatography Market Analysis, Insights and Forecast, 2019-2031
- 12.1. Market Analysis, Insights and Forecast - By Country/Sub-region
- 12.1.1 Germany
- 12.1.2 United Kingdom
- 12.1.3 France
- 12.1.4 Italy
- 12.1.5 Spain
- 12.1.6 Rest of Europe
- 13. Asia Pacific Ion Chromatography Market Analysis, Insights and Forecast, 2019-2031
- 13.1. Market Analysis, Insights and Forecast - By Country/Sub-region
- 13.1.1 China
- 13.1.2 Japan
- 13.1.3 India
- 13.1.4 Australia
- 13.1.5 South korea
- 13.1.6 Rest of Asia Pacific
- 14. Middle East and Africa Ion Chromatography Market Analysis, Insights and Forecast, 2019-2031
- 14.1. Market Analysis, Insights and Forecast - By Country/Sub-region
- 14.1.1 GCC
- 14.1.2 South Africa
- 14.1.3 Rest of Middle East and Africa
- 15. South America Ion Chromatography Market Analysis, Insights and Forecast, 2019-2031
- 15.1. Market Analysis, Insights and Forecast - By Country/Sub-region
- 15.1.1 Brazil
- 15.1.2 Argentina
- 15.1.3 Rest of South America
- 16. Competitive Analysis
- 16.1. Global Market Share Analysis 2024
- 16.2. Company Profiles
- 16.2.1 MembraPure GmbH
- 16.2.1.1. Overview
- 16.2.1.2. Products
- 16.2.1.3. SWOT Analysis
- 16.2.1.4. Recent Developments
- 16.2.1.5. Financials (Based on Availability)
- 16.2.2 Bio-Rad Laboratories Inc
- 16.2.2.1. Overview
- 16.2.2.2. Products
- 16.2.2.3. SWOT Analysis
- 16.2.2.4. Recent Developments
- 16.2.2.5. Financials (Based on Availability)
- 16.2.3 Mitsubishi Chemical Corporation
- 16.2.3.1. Overview
- 16.2.3.2. Products
- 16.2.3.3. SWOT Analysis
- 16.2.3.4. Recent Developments
- 16.2.3.5. Financials (Based on Availability)
- 16.2.4 GE Healthcare
- 16.2.4.1. Overview
- 16.2.4.2. Products
- 16.2.4.3. SWOT Analysis
- 16.2.4.4. Recent Developments
- 16.2.4.5. Financials (Based on Availability)
- 16.2.5 Metrohm AG
- 16.2.5.1. Overview
- 16.2.5.2. Products
- 16.2.5.3. SWOT Analysis
- 16.2.5.4. Recent Developments
- 16.2.5.5. Financials (Based on Availability)
- 16.2.6 Waters
- 16.2.6.1. Overview
- 16.2.6.2. Products
- 16.2.6.3. SWOT Analysis
- 16.2.6.4. Recent Developments
- 16.2.6.5. Financials (Based on Availability)
- 16.2.7 Tosoh Corporation
- 16.2.7.1. Overview
- 16.2.7.2. Products
- 16.2.7.3. SWOT Analysis
- 16.2.7.4. Recent Developments
- 16.2.7.5. Financials (Based on Availability)
- 16.2.8 Agilent Technologies Inc
- 16.2.8.1. Overview
- 16.2.8.2. Products
- 16.2.8.3. SWOT Analysis
- 16.2.8.4. Recent Developments
- 16.2.8.5. Financials (Based on Availability)
- 16.2.9 Qingdao Shenghan
- 16.2.9.1. Overview
- 16.2.9.2. Products
- 16.2.9.3. SWOT Analysis
- 16.2.9.4. Recent Developments
- 16.2.9.5. Financials (Based on Availability)
- 16.2.10 Thermo Fisher Scientific
- 16.2.10.1. Overview
- 16.2.10.2. Products
- 16.2.10.3. SWOT Analysis
- 16.2.10.4. Recent Developments
- 16.2.10.5. Financials (Based on Availability)
- 16.2.11 Shimadzu Corporation
- 16.2.11.1. Overview
- 16.2.11.2. Products
- 16.2.11.3. SWOT Analysis
- 16.2.11.4. Recent Developments
- 16.2.11.5. Financials (Based on Availability)
- 16.2.12 Perkin Elmer Inc
- 16.2.12.1. Overview
- 16.2.12.2. Products
- 16.2.12.3. SWOT Analysis
- 16.2.12.4. Recent Developments
- 16.2.12.5. Financials (Based on Availability)
- 16.2.1 MembraPure GmbH
List of Figures
- Figure 1: Global Ion Chromatography Market Revenue Breakdown (Million, %) by Region 2024 & 2032
- Figure 2: Global Ion Chromatography Market Volume Breakdown (K Unit, %) by Region 2024 & 2032
- Figure 3: North America Ion Chromatography Market Revenue (Million), by Country 2024 & 2032
- Figure 4: North America Ion Chromatography Market Volume (K Unit), by Country 2024 & 2032
- Figure 5: North America Ion Chromatography Market Revenue Share (%), by Country 2024 & 2032
- Figure 6: North America Ion Chromatography Market Volume Share (%), by Country 2024 & 2032
- Figure 7: Europe Ion Chromatography Market Revenue (Million), by Country 2024 & 2032
- Figure 8: Europe Ion Chromatography Market Volume (K Unit), by Country 2024 & 2032
- Figure 9: Europe Ion Chromatography Market Revenue Share (%), by Country 2024 & 2032
- Figure 10: Europe Ion Chromatography Market Volume Share (%), by Country 2024 & 2032
- Figure 11: Asia Pacific Ion Chromatography Market Revenue (Million), by Country 2024 & 2032
- Figure 12: Asia Pacific Ion Chromatography Market Volume (K Unit), by Country 2024 & 2032
- Figure 13: Asia Pacific Ion Chromatography Market Revenue Share (%), by Country 2024 & 2032
- Figure 14: Asia Pacific Ion Chromatography Market Volume Share (%), by Country 2024 & 2032
- Figure 15: Middle East and Africa Ion Chromatography Market Revenue (Million), by Country 2024 & 2032
- Figure 16: Middle East and Africa Ion Chromatography Market Volume (K Unit), by Country 2024 & 2032
- Figure 17: Middle East and Africa Ion Chromatography Market Revenue Share (%), by Country 2024 & 2032
- Figure 18: Middle East and Africa Ion Chromatography Market Volume Share (%), by Country 2024 & 2032
- Figure 19: South America Ion Chromatography Market Revenue (Million), by Country 2024 & 2032
- Figure 20: South America Ion Chromatography Market Volume (K Unit), by Country 2024 & 2032
- Figure 21: South America Ion Chromatography Market Revenue Share (%), by Country 2024 & 2032
- Figure 22: South America Ion Chromatography Market Volume Share (%), by Country 2024 & 2032
- Figure 23: North America Ion Chromatography Market Revenue (Million), by Technology 2024 & 2032
- Figure 24: North America Ion Chromatography Market Volume (K Unit), by Technology 2024 & 2032
- Figure 25: North America Ion Chromatography Market Revenue Share (%), by Technology 2024 & 2032
- Figure 26: North America Ion Chromatography Market Volume Share (%), by Technology 2024 & 2032
- Figure 27: North America Ion Chromatography Market Revenue (Million), by Application 2024 & 2032
- Figure 28: North America Ion Chromatography Market Volume (K Unit), by Application 2024 & 2032
- Figure 29: North America Ion Chromatography Market Revenue Share (%), by Application 2024 & 2032
- Figure 30: North America Ion Chromatography Market Volume Share (%), by Application 2024 & 2032
- Figure 31: North America Ion Chromatography Market Revenue (Million), by Country 2024 & 2032
- Figure 32: North America Ion Chromatography Market Volume (K Unit), by Country 2024 & 2032
- Figure 33: North America Ion Chromatography Market Revenue Share (%), by Country 2024 & 2032
- Figure 34: North America Ion Chromatography Market Volume Share (%), by Country 2024 & 2032
- Figure 35: Europe Ion Chromatography Market Revenue (Million), by Technology 2024 & 2032
- Figure 36: Europe Ion Chromatography Market Volume (K Unit), by Technology 2024 & 2032
- Figure 37: Europe Ion Chromatography Market Revenue Share (%), by Technology 2024 & 2032
- Figure 38: Europe Ion Chromatography Market Volume Share (%), by Technology 2024 & 2032
- Figure 39: Europe Ion Chromatography Market Revenue (Million), by Application 2024 & 2032
- Figure 40: Europe Ion Chromatography Market Volume (K Unit), by Application 2024 & 2032
- Figure 41: Europe Ion Chromatography Market Revenue Share (%), by Application 2024 & 2032
- Figure 42: Europe Ion Chromatography Market Volume Share (%), by Application 2024 & 2032
- Figure 43: Europe Ion Chromatography Market Revenue (Million), by Country 2024 & 2032
- Figure 44: Europe Ion Chromatography Market Volume (K Unit), by Country 2024 & 2032
- Figure 45: Europe Ion Chromatography Market Revenue Share (%), by Country 2024 & 2032
- Figure 46: Europe Ion Chromatography Market Volume Share (%), by Country 2024 & 2032
- Figure 47: Asia Pacific Ion Chromatography Market Revenue (Million), by Technology 2024 & 2032
- Figure 48: Asia Pacific Ion Chromatography Market Volume (K Unit), by Technology 2024 & 2032
- Figure 49: Asia Pacific Ion Chromatography Market Revenue Share (%), by Technology 2024 & 2032
- Figure 50: Asia Pacific Ion Chromatography Market Volume Share (%), by Technology 2024 & 2032
- Figure 51: Asia Pacific Ion Chromatography Market Revenue (Million), by Application 2024 & 2032
- Figure 52: Asia Pacific Ion Chromatography Market Volume (K Unit), by Application 2024 & 2032
- Figure 53: Asia Pacific Ion Chromatography Market Revenue Share (%), by Application 2024 & 2032
- Figure 54: Asia Pacific Ion Chromatography Market Volume Share (%), by Application 2024 & 2032
- Figure 55: Asia Pacific Ion Chromatography Market Revenue (Million), by Country 2024 & 2032
- Figure 56: Asia Pacific Ion Chromatography Market Volume (K Unit), by Country 2024 & 2032
- Figure 57: Asia Pacific Ion Chromatography Market Revenue Share (%), by Country 2024 & 2032
- Figure 58: Asia Pacific Ion Chromatography Market Volume Share (%), by Country 2024 & 2032
- Figure 59: Middle East and Africa Ion Chromatography Market Revenue (Million), by Technology 2024 & 2032
- Figure 60: Middle East and Africa Ion Chromatography Market Volume (K Unit), by Technology 2024 & 2032
- Figure 61: Middle East and Africa Ion Chromatography Market Revenue Share (%), by Technology 2024 & 2032
- Figure 62: Middle East and Africa Ion Chromatography Market Volume Share (%), by Technology 2024 & 2032
- Figure 63: Middle East and Africa Ion Chromatography Market Revenue (Million), by Application 2024 & 2032
- Figure 64: Middle East and Africa Ion Chromatography Market Volume (K Unit), by Application 2024 & 2032
- Figure 65: Middle East and Africa Ion Chromatography Market Revenue Share (%), by Application 2024 & 2032
- Figure 66: Middle East and Africa Ion Chromatography Market Volume Share (%), by Application 2024 & 2032
- Figure 67: Middle East and Africa Ion Chromatography Market Revenue (Million), by Country 2024 & 2032
- Figure 68: Middle East and Africa Ion Chromatography Market Volume (K Unit), by Country 2024 & 2032
- Figure 69: Middle East and Africa Ion Chromatography Market Revenue Share (%), by Country 2024 & 2032
- Figure 70: Middle East and Africa Ion Chromatography Market Volume Share (%), by Country 2024 & 2032
- Figure 71: South America Ion Chromatography Market Revenue (Million), by Technology 2024 & 2032
- Figure 72: South America Ion Chromatography Market Volume (K Unit), by Technology 2024 & 2032
- Figure 73: South America Ion Chromatography Market Revenue Share (%), by Technology 2024 & 2032
- Figure 74: South America Ion Chromatography Market Volume Share (%), by Technology 2024 & 2032
- Figure 75: South America Ion Chromatography Market Revenue (Million), by Application 2024 & 2032
- Figure 76: South America Ion Chromatography Market Volume (K Unit), by Application 2024 & 2032
- Figure 77: South America Ion Chromatography Market Revenue Share (%), by Application 2024 & 2032
- Figure 78: South America Ion Chromatography Market Volume Share (%), by Application 2024 & 2032
- Figure 79: South America Ion Chromatography Market Revenue (Million), by Country 2024 & 2032
- Figure 80: South America Ion Chromatography Market Volume (K Unit), by Country 2024 & 2032
- Figure 81: South America Ion Chromatography Market Revenue Share (%), by Country 2024 & 2032
- Figure 82: South America Ion Chromatography Market Volume Share (%), by Country 2024 & 2032
List of Tables
- Table 1: Global Ion Chromatography Market Revenue Million Forecast, by Region 2019 & 2032
- Table 2: Global Ion Chromatography Market Volume K Unit Forecast, by Region 2019 & 2032
- Table 3: Global Ion Chromatography Market Revenue Million Forecast, by Technology 2019 & 2032
- Table 4: Global Ion Chromatography Market Volume K Unit Forecast, by Technology 2019 & 2032
- Table 5: Global Ion Chromatography Market Revenue Million Forecast, by Application 2019 & 2032
- Table 6: Global Ion Chromatography Market Volume K Unit Forecast, by Application 2019 & 2032
- Table 7: Global Ion Chromatography Market Revenue Million Forecast, by Region 2019 & 2032
- Table 8: Global Ion Chromatography Market Volume K Unit Forecast, by Region 2019 & 2032
- Table 9: Global Ion Chromatography Market Revenue Million Forecast, by Country 2019 & 2032
- Table 10: Global Ion Chromatography Market Volume K Unit Forecast, by Country 2019 & 2032
- Table 11: United States Ion Chromatography Market Revenue (Million) Forecast, by Application 2019 & 2032
- Table 12: United States Ion Chromatography Market Volume (K Unit) Forecast, by Application 2019 & 2032
- Table 13: Canada Ion Chromatography Market Revenue (Million) Forecast, by Application 2019 & 2032
- Table 14: Canada Ion Chromatography Market Volume (K Unit) Forecast, by Application 2019 & 2032
- Table 15: Mexico Ion Chromatography Market Revenue (Million) Forecast, by Application 2019 & 2032
- Table 16: Mexico Ion Chromatography Market Volume (K Unit) Forecast, by Application 2019 & 2032
- Table 17: Global Ion Chromatography Market Revenue Million Forecast, by Country 2019 & 2032
- Table 18: Global Ion Chromatography Market Volume K Unit Forecast, by Country 2019 & 2032
- Table 19: Germany Ion Chromatography Market Revenue (Million) Forecast, by Application 2019 & 2032
- Table 20: Germany Ion Chromatography Market Volume (K Unit) Forecast, by Application 2019 & 2032
- Table 21: United Kingdom Ion Chromatography Market Revenue (Million) Forecast, by Application 2019 & 2032
- Table 22: United Kingdom Ion Chromatography Market Volume (K Unit) Forecast, by Application 2019 & 2032
- Table 23: France Ion Chromatography Market Revenue (Million) Forecast, by Application 2019 & 2032
- Table 24: France Ion Chromatography Market Volume (K Unit) Forecast, by Application 2019 & 2032
- Table 25: Italy Ion Chromatography Market Revenue (Million) Forecast, by Application 2019 & 2032
- Table 26: Italy Ion Chromatography Market Volume (K Unit) Forecast, by Application 2019 & 2032
- Table 27: Spain Ion Chromatography Market Revenue (Million) Forecast, by Application 2019 & 2032
- Table 28: Spain Ion Chromatography Market Volume (K Unit) Forecast, by Application 2019 & 2032
- Table 29: Rest of Europe Ion Chromatography Market Revenue (Million) Forecast, by Application 2019 & 2032
- Table 30: Rest of Europe Ion Chromatography Market Volume (K Unit) Forecast, by Application 2019 & 2032
- Table 31: Global Ion Chromatography Market Revenue Million Forecast, by Country 2019 & 2032
- Table 32: Global Ion Chromatography Market Volume K Unit Forecast, by Country 2019 & 2032
- Table 33: China Ion Chromatography Market Revenue (Million) Forecast, by Application 2019 & 2032
- Table 34: China Ion Chromatography Market Volume (K Unit) Forecast, by Application 2019 & 2032
- Table 35: Japan Ion Chromatography Market Revenue (Million) Forecast, by Application 2019 & 2032
- Table 36: Japan Ion Chromatography Market Volume (K Unit) Forecast, by Application 2019 & 2032
- Table 37: India Ion Chromatography Market Revenue (Million) Forecast, by Application 2019 & 2032
- Table 38: India Ion Chromatography Market Volume (K Unit) Forecast, by Application 2019 & 2032
- Table 39: Australia Ion Chromatography Market Revenue (Million) Forecast, by Application 2019 & 2032
- Table 40: Australia Ion Chromatography Market Volume (K Unit) Forecast, by Application 2019 & 2032
- Table 41: South korea Ion Chromatography Market Revenue (Million) Forecast, by Application 2019 & 2032
- Table 42: South korea Ion Chromatography Market Volume (K Unit) Forecast, by Application 2019 & 2032
- Table 43: Rest of Asia Pacific Ion Chromatography Market Revenue (Million) Forecast, by Application 2019 & 2032
- Table 44: Rest of Asia Pacific Ion Chromatography Market Volume (K Unit) Forecast, by Application 2019 & 2032
- Table 45: Global Ion Chromatography Market Revenue Million Forecast, by Country 2019 & 2032
- Table 46: Global Ion Chromatography Market Volume K Unit Forecast, by Country 2019 & 2032
- Table 47: GCC Ion Chromatography Market Revenue (Million) Forecast, by Application 2019 & 2032
- Table 48: GCC Ion Chromatography Market Volume (K Unit) Forecast, by Application 2019 & 2032
- Table 49: South Africa Ion Chromatography Market Revenue (Million) Forecast, by Application 2019 & 2032
- Table 50: South Africa Ion Chromatography Market Volume (K Unit) Forecast, by Application 2019 & 2032
- Table 51: Rest of Middle East and Africa Ion Chromatography Market Revenue (Million) Forecast, by Application 2019 & 2032
- Table 52: Rest of Middle East and Africa Ion Chromatography Market Volume (K Unit) Forecast, by Application 2019 & 2032
- Table 53: Global Ion Chromatography Market Revenue Million Forecast, by Country 2019 & 2032
- Table 54: Global Ion Chromatography Market Volume K Unit Forecast, by Country 2019 & 2032
- Table 55: Brazil Ion Chromatography Market Revenue (Million) Forecast, by Application 2019 & 2032
- Table 56: Brazil Ion Chromatography Market Volume (K Unit) Forecast, by Application 2019 & 2032
- Table 57: Argentina Ion Chromatography Market Revenue (Million) Forecast, by Application 2019 & 2032
- Table 58: Argentina Ion Chromatography Market Volume (K Unit) Forecast, by Application 2019 & 2032
- Table 59: Rest of South America Ion Chromatography Market Revenue (Million) Forecast, by Application 2019 & 2032
- Table 60: Rest of South America Ion Chromatography Market Volume (K Unit) Forecast, by Application 2019 & 2032
- Table 61: Global Ion Chromatography Market Revenue Million Forecast, by Technology 2019 & 2032
- Table 62: Global Ion Chromatography Market Volume K Unit Forecast, by Technology 2019 & 2032
- Table 63: Global Ion Chromatography Market Revenue Million Forecast, by Application 2019 & 2032
- Table 64: Global Ion Chromatography Market Volume K Unit Forecast, by Application 2019 & 2032
- Table 65: Global Ion Chromatography Market Revenue Million Forecast, by Country 2019 & 2032
- Table 66: Global Ion Chromatography Market Volume K Unit Forecast, by Country 2019 & 2032
- Table 67: United States Ion Chromatography Market Revenue (Million) Forecast, by Application 2019 & 2032
- Table 68: United States Ion Chromatography Market Volume (K Unit) Forecast, by Application 2019 & 2032
- Table 69: Canada Ion Chromatography Market Revenue (Million) Forecast, by Application 2019 & 2032
- Table 70: Canada Ion Chromatography Market Volume (K Unit) Forecast, by Application 2019 & 2032
- Table 71: Mexico Ion Chromatography Market Revenue (Million) Forecast, by Application 2019 & 2032
- Table 72: Mexico Ion Chromatography Market Volume (K Unit) Forecast, by Application 2019 & 2032
- Table 73: Global Ion Chromatography Market Revenue Million Forecast, by Technology 2019 & 2032
- Table 74: Global Ion Chromatography Market Volume K Unit Forecast, by Technology 2019 & 2032
- Table 75: Global Ion Chromatography Market Revenue Million Forecast, by Application 2019 & 2032
- Table 76: Global Ion Chromatography Market Volume K Unit Forecast, by Application 2019 & 2032
- Table 77: Global Ion Chromatography Market Revenue Million Forecast, by Country 2019 & 2032
- Table 78: Global Ion Chromatography Market Volume K Unit Forecast, by Country 2019 & 2032
- Table 79: Germany Ion Chromatography Market Revenue (Million) Forecast, by Application 2019 & 2032
- Table 80: Germany Ion Chromatography Market Volume (K Unit) Forecast, by Application 2019 & 2032
- Table 81: United Kingdom Ion Chromatography Market Revenue (Million) Forecast, by Application 2019 & 2032
- Table 82: United Kingdom Ion Chromatography Market Volume (K Unit) Forecast, by Application 2019 & 2032
- Table 83: France Ion Chromatography Market Revenue (Million) Forecast, by Application 2019 & 2032
- Table 84: France Ion Chromatography Market Volume (K Unit) Forecast, by Application 2019 & 2032
- Table 85: Italy Ion Chromatography Market Revenue (Million) Forecast, by Application 2019 & 2032
- Table 86: Italy Ion Chromatography Market Volume (K Unit) Forecast, by Application 2019 & 2032
- Table 87: Spain Ion Chromatography Market Revenue (Million) Forecast, by Application 2019 & 2032
- Table 88: Spain Ion Chromatography Market Volume (K Unit) Forecast, by Application 2019 & 2032
- Table 89: Rest of Europe Ion Chromatography Market Revenue (Million) Forecast, by Application 2019 & 2032
- Table 90: Rest of Europe Ion Chromatography Market Volume (K Unit) Forecast, by Application 2019 & 2032
- Table 91: Global Ion Chromatography Market Revenue Million Forecast, by Technology 2019 & 2032
- Table 92: Global Ion Chromatography Market Volume K Unit Forecast, by Technology 2019 & 2032
- Table 93: Global Ion Chromatography Market Revenue Million Forecast, by Application 2019 & 2032
- Table 94: Global Ion Chromatography Market Volume K Unit Forecast, by Application 2019 & 2032
- Table 95: Global Ion Chromatography Market Revenue Million Forecast, by Country 2019 & 2032
- Table 96: Global Ion Chromatography Market Volume K Unit Forecast, by Country 2019 & 2032
- Table 97: China Ion Chromatography Market Revenue (Million) Forecast, by Application 2019 & 2032
- Table 98: China Ion Chromatography Market Volume (K Unit) Forecast, by Application 2019 & 2032
- Table 99: Japan Ion Chromatography Market Revenue (Million) Forecast, by Application 2019 & 2032
- Table 100: Japan Ion Chromatography Market Volume (K Unit) Forecast, by Application 2019 & 2032
- Table 101: India Ion Chromatography Market Revenue (Million) Forecast, by Application 2019 & 2032
- Table 102: India Ion Chromatography Market Volume (K Unit) Forecast, by Application 2019 & 2032
- Table 103: Australia Ion Chromatography Market Revenue (Million) Forecast, by Application 2019 & 2032
- Table 104: Australia Ion Chromatography Market Volume (K Unit) Forecast, by Application 2019 & 2032
- Table 105: South korea Ion Chromatography Market Revenue (Million) Forecast, by Application 2019 & 2032
- Table 106: South korea Ion Chromatography Market Volume (K Unit) Forecast, by Application 2019 & 2032
- Table 107: Rest of Asia Pacific Ion Chromatography Market Revenue (Million) Forecast, by Application 2019 & 2032
- Table 108: Rest of Asia Pacific Ion Chromatography Market Volume (K Unit) Forecast, by Application 2019 & 2032
- Table 109: Global Ion Chromatography Market Revenue Million Forecast, by Technology 2019 & 2032
- Table 110: Global Ion Chromatography Market Volume K Unit Forecast, by Technology 2019 & 2032
- Table 111: Global Ion Chromatography Market Revenue Million Forecast, by Application 2019 & 2032
- Table 112: Global Ion Chromatography Market Volume K Unit Forecast, by Application 2019 & 2032
- Table 113: Global Ion Chromatography Market Revenue Million Forecast, by Country 2019 & 2032
- Table 114: Global Ion Chromatography Market Volume K Unit Forecast, by Country 2019 & 2032
- Table 115: GCC Ion Chromatography Market Revenue (Million) Forecast, by Application 2019 & 2032
- Table 116: GCC Ion Chromatography Market Volume (K Unit) Forecast, by Application 2019 & 2032
- Table 117: South Africa Ion Chromatography Market Revenue (Million) Forecast, by Application 2019 & 2032
- Table 118: South Africa Ion Chromatography Market Volume (K Unit) Forecast, by Application 2019 & 2032
- Table 119: Rest of Middle East and Africa Ion Chromatography Market Revenue (Million) Forecast, by Application 2019 & 2032
- Table 120: Rest of Middle East and Africa Ion Chromatography Market Volume (K Unit) Forecast, by Application 2019 & 2032
- Table 121: Global Ion Chromatography Market Revenue Million Forecast, by Technology 2019 & 2032
- Table 122: Global Ion Chromatography Market Volume K Unit Forecast, by Technology 2019 & 2032
- Table 123: Global Ion Chromatography Market Revenue Million Forecast, by Application 2019 & 2032
- Table 124: Global Ion Chromatography Market Volume K Unit Forecast, by Application 2019 & 2032
- Table 125: Global Ion Chromatography Market Revenue Million Forecast, by Country 2019 & 2032
- Table 126: Global Ion Chromatography Market Volume K Unit Forecast, by Country 2019 & 2032
- Table 127: Brazil Ion Chromatography Market Revenue (Million) Forecast, by Application 2019 & 2032
- Table 128: Brazil Ion Chromatography Market Volume (K Unit) Forecast, by Application 2019 & 2032
- Table 129: Argentina Ion Chromatography Market Revenue (Million) Forecast, by Application 2019 & 2032
- Table 130: Argentina Ion Chromatography Market Volume (K Unit) Forecast, by Application 2019 & 2032
- Table 131: Rest of South America Ion Chromatography Market Revenue (Million) Forecast, by Application 2019 & 2032
- Table 132: Rest of South America Ion Chromatography Market Volume (K Unit) Forecast, by Application 2019 & 2032
Frequently Asked Questions
1. What is the projected Compound Annual Growth Rate (CAGR) of the Ion Chromatography Market?
The projected CAGR is approximately 3.80%.
2. Which companies are prominent players in the Ion Chromatography Market?
Key companies in the market include MembraPure GmbH, Bio-Rad Laboratories Inc, Mitsubishi Chemical Corporation, GE Healthcare, Metrohm AG, Waters, Tosoh Corporation, Agilent Technologies Inc, Qingdao Shenghan, Thermo Fisher Scientific, Shimadzu Corporation, Perkin Elmer Inc.
3. What are the main segments of the Ion Chromatography Market?
The market segments include Technology, Application.
4. Can you provide details about the market size?
The market size is estimated to be USD 3.08 Million as of 2022.
5. What are some drivers contributing to market growth?
Increasing Academic and Commercial R&D Spending on Pharmaceuticals; Increasing Use of Ion Chromatography Technique in Various Fields; Technological Advancements in Ion Chromatography.
6. What are the notable trends driving market growth?
Application in Pharmaceutical Industry is Expected to Exhibit Fastest Growth Over the Forecast Period.
7. Are there any restraints impacting market growth?
High Cost of Instruments; Lack of Skilled Personnel to Handle Equipment.
8. Can you provide examples of recent developments in the market?
In June 2022, Bio-Rad launched EconoFit Chromatography Column packs, that offer various resins in a prepacked format, including mixed-mode, cation, and anion exchange resin columns, as well as a pack designed for polyhistidine protein purification
9. What pricing options are available for accessing the report?
Pricing options include single-user, multi-user, and enterprise licenses priced at USD 4750, USD 5250, and USD 8750 respectively.
10. Is the market size provided in terms of value or volume?
The market size is provided in terms of value, measured in Million and volume, measured in K Unit.
11. Are there any specific market keywords associated with the report?
Yes, the market keyword associated with the report is "Ion Chromatography Market," which aids in identifying and referencing the specific market segment covered.
12. How do I determine which pricing option suits my needs best?
The pricing options vary based on user requirements and access needs. Individual users may opt for single-user licenses, while businesses requiring broader access may choose multi-user or enterprise licenses for cost-effective access to the report.
13. Are there any additional resources or data provided in the Ion Chromatography Market report?
While the report offers comprehensive insights, it's advisable to review the specific contents or supplementary materials provided to ascertain if additional resources or data are available.
14. How can I stay updated on further developments or reports in the Ion Chromatography Market?
To stay informed about further developments, trends, and reports in the Ion Chromatography Market, consider subscribing to industry newsletters, following relevant companies and organizations, or regularly checking reputable industry news sources and publications.
Methodology
Step 1 - Identification of Relevant Samples Size from Population Database


Step 2 - Approaches for Defining Global Market Size (Value, Volume* & Price*)

Note*: In applicable scenarios
Step 3 - Data Sources
Primary Research
- Web Analytics
- Survey Reports
- Research Institute
- Latest Research Reports
- Opinion Leaders
Secondary Research
- Annual Reports
- White Paper
- Latest Press Release
- Industry Association
- Paid Database
- Investor Presentations

Step 4 - Data Triangulation
Involves using different sources of information in order to increase the validity of a study
These sources are likely to be stakeholders in a program - participants, other researchers, program staff, other community members, and so on.
Then we put all data in single framework & apply various statistical tools to find out the dynamic on the market.
During the analysis stage, feedback from the stakeholder groups would be compared to determine areas of agreement as well as areas of divergence


