
Key Insights
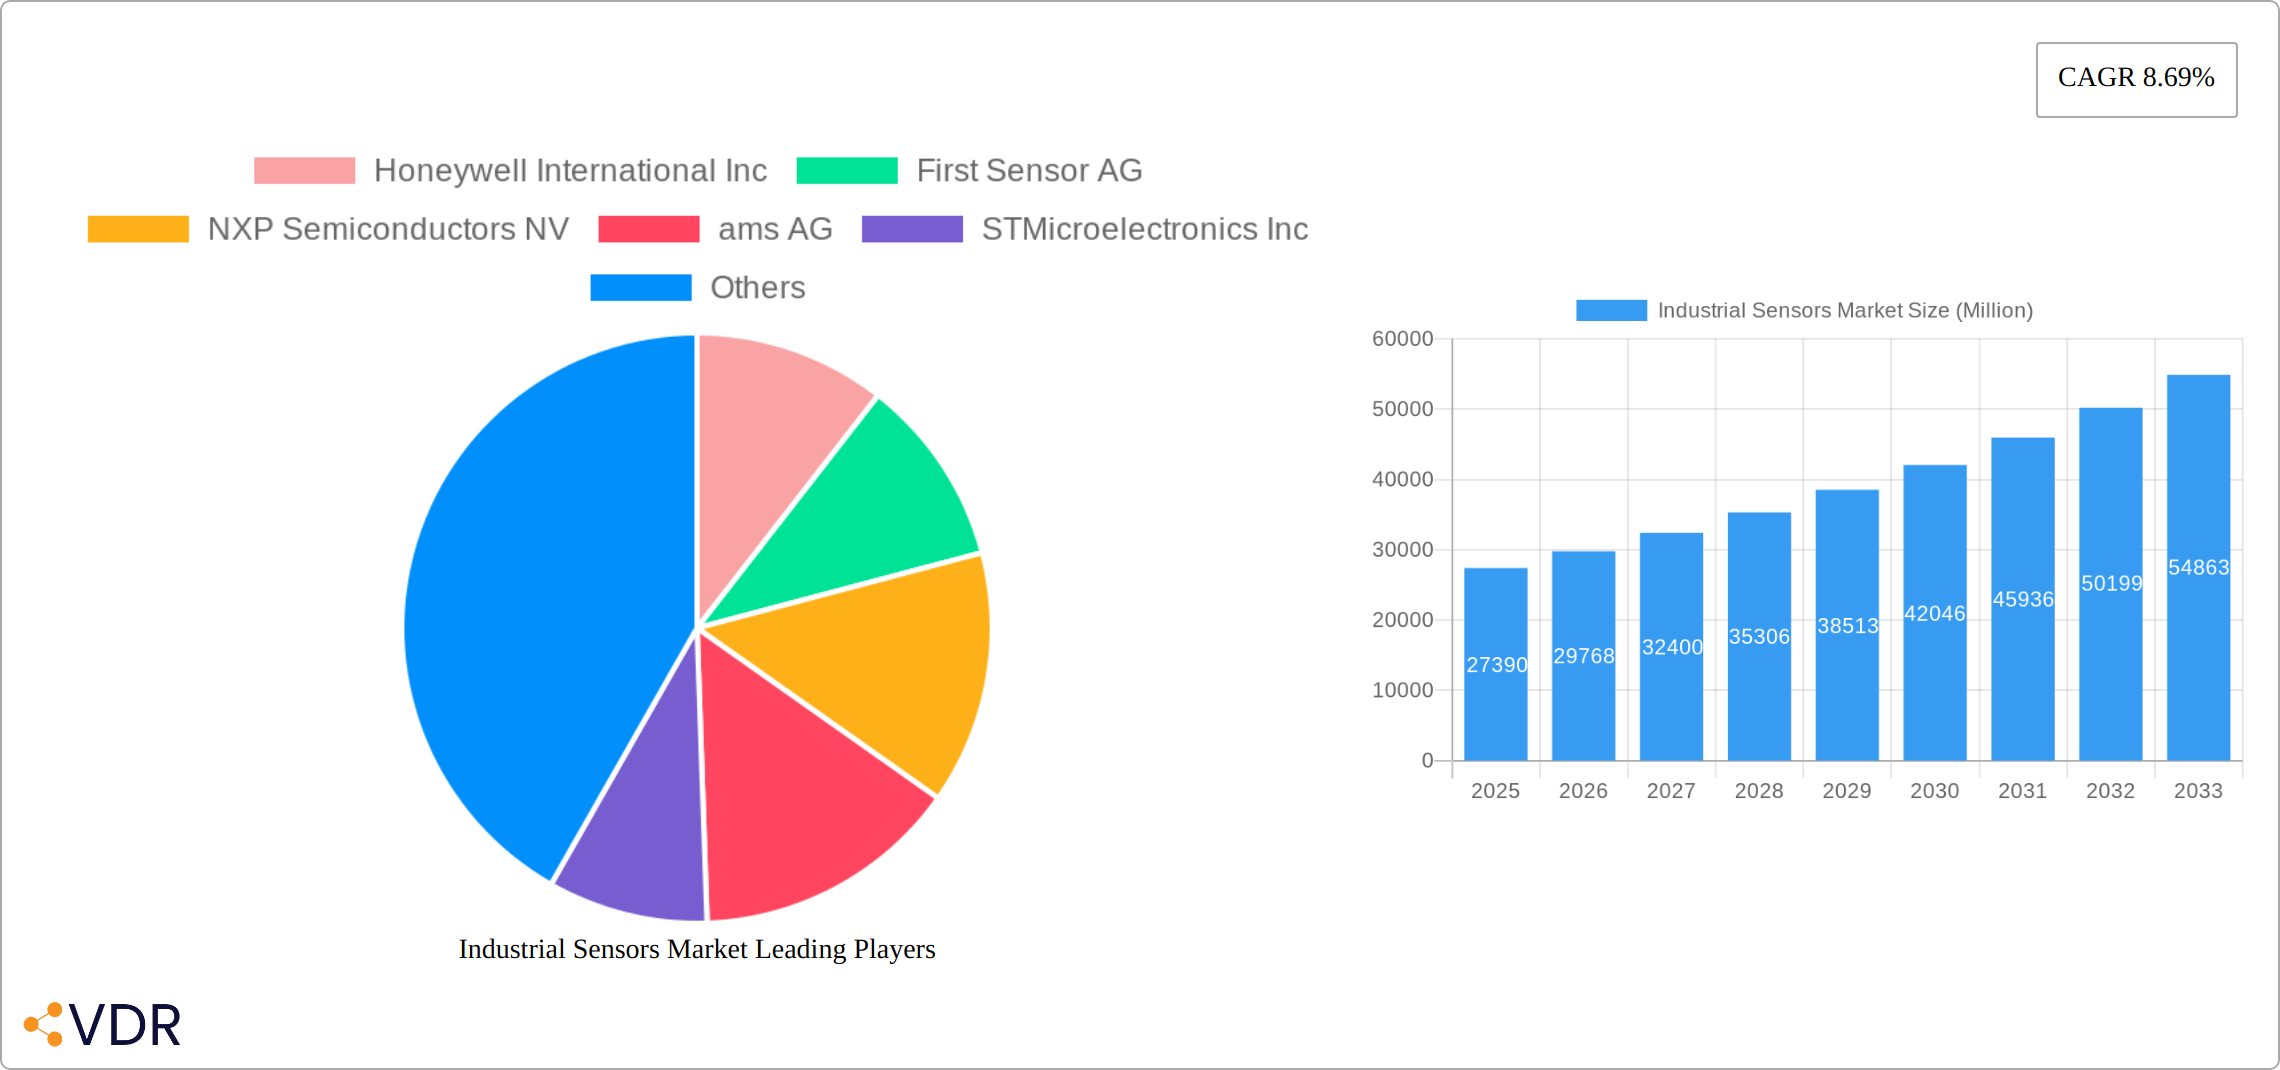
The industrial sensors market is experiencing robust growth, projected to reach $27.39 billion in 2025 and maintain a Compound Annual Growth Rate (CAGR) of 8.69% from 2025 to 2033. This expansion is fueled by several key drivers. The increasing automation across manufacturing, coupled with the rising demand for predictive maintenance and Industry 4.0 initiatives, significantly boosts sensor adoption. Furthermore, advancements in sensor technology, including miniaturization, improved accuracy, and enhanced connectivity (like IoT integration), are expanding application possibilities across diverse sectors. Government regulations mandating increased safety and efficiency in industrial processes also contribute to market growth. While initial investment costs can be a restraint, the long-term return on investment (ROI) from improved efficiency and reduced downtime makes sensors a compelling proposition for businesses. North America currently holds a significant market share, driven by strong technological advancements and established industrial infrastructure. However, the Asia-Pacific region is poised for significant growth, fueled by rapid industrialization and increasing adoption of smart manufacturing practices in countries like China and Japan. Competition is intense, with established players like Honeywell, Siemens, and Texas Instruments alongside emerging technology providers vying for market share through innovation and strategic partnerships. The market's segmentation by sensor type (temperature, pressure, flow, etc.) and application (process control, safety, environmental monitoring) further highlights its diverse and dynamic nature.
The forecast period (2025-2033) anticipates continued growth, with specific regional variations. North America will likely maintain a leading position due to its advanced industrial base, while the Asia-Pacific region will experience the fastest growth rate, driven by emerging economies. Europe will maintain steady growth, driven by technological advancements and government initiatives focused on sustainable manufacturing. The market's success hinges on ongoing technological innovation, particularly in areas such as AI-powered sensor analytics, which can provide more actionable insights from sensor data and reduce reliance on manual intervention. The continued integration of sensors into broader industrial IoT ecosystems will be a key factor shaping the future of the market, leading to more sophisticated and interconnected industrial operations.
Industrial Sensors Market: A Comprehensive Market Report (2019-2033)
This in-depth report provides a comprehensive analysis of the Industrial Sensors Market, encompassing market dynamics, growth trends, regional segmentation, product landscape, key players, and future outlook. The study period covers 2019-2033, with 2025 as the base year and a forecast period of 2025-2033. The report quantifies the market in Million units and offers crucial insights for industry professionals, investors, and strategic decision-makers.
Industrial Sensors Market Dynamics & Structure
The Industrial Sensors Market, a crucial sub-segment of the broader Industrial Automation market, is characterized by moderate concentration, with key players holding significant market share. Technological innovation, particularly in areas like IoT, AI, and 5G, are primary drivers, while stringent regulatory compliance requirements (e.g., safety standards) shape market dynamics. The market witnesses continuous development of competitive product substitutes, pushing companies to innovate and improve product performance. The end-user demographic is diverse, encompassing manufacturing, energy, automotive, and infrastructure sectors. M&A activities have been relatively frequent, with xx deals recorded in the last five years, reflecting strategic consolidation and expansion efforts. Market share for the top 5 players is estimated at xx%, indicating a moderately consolidated market.
- Market Concentration: Moderately consolidated, with top 5 players holding xx% market share.
- Technological Innovation: Driven by IoT, AI, and 5G advancements, leading to improved sensor capabilities and data analytics.
- Regulatory Frameworks: Stringent safety and compliance standards influence product development and market access.
- Competitive Product Substitutes: Continuous development of alternative technologies creates competitive pressure.
- End-User Demographics: Diverse range of industries, including manufacturing, energy, automotive, and infrastructure.
- M&A Trends: xx M&A deals in the last five years, indicating significant consolidation.
- Innovation Barriers: High R&D costs and complexities in integrating advanced technologies pose challenges.
Industrial Sensors Market Growth Trends & Insights
The Industrial Sensors Market is experiencing robust growth, fueled by the accelerating adoption of automation across diverse industries and the widespread implementation of smart manufacturing and Industry 4.0 initiatives. Market projections indicate a substantial expansion, reaching an estimated value of [Insert Updated Market Value in USD/Units] by 2033, representing a Compound Annual Growth Rate (CAGR) of [Insert Updated CAGR]% during the forecast period (2023-2033). This significant growth is driven by several key factors: the continuous evolution of sensor technologies resulting in increased efficiency, reliability, and cost-effectiveness; the rising demand for data-driven decision-making and predictive maintenance strategies; and a global shift towards optimizing operational processes and reducing downtime. Market penetration is expected to increase from [Insert Updated 2025 Penetration]% in 2025 to [Insert Updated 2033 Penetration]% by 2033.
Dominant Regions, Countries, or Segments in Industrial Sensors Market
North America, particularly the United States, maintains its position as the leading market, driven by the region's robust industrial automation adoption, well-established manufacturing base, and continuous technological advancements. Europe, with Germany and the United Kingdom as key contributors, also demonstrates substantial market strength, leveraging its mature industrial sector and significant investments in automation technologies. However, the Asia-Pacific region, spearheaded by China's rapid industrialization and expanding manufacturing capacity, is projected to exhibit the most significant growth rate throughout the forecast period. This growth is further accelerated by increasing investments in infrastructure development and the burgeoning adoption of smart technologies across various sectors.
- North America (United States): Strong industrial base, advanced technological capabilities, high automation adoption rate, and robust government support for technological innovation.
- Europe (Germany, UK): Mature industrial sector, proactive focus on automation technologies, substantial government investments in research and development, and a skilled workforce.
- Asia-Pacific (China, India): Rapid industrialization, expanding manufacturing capabilities, significant government initiatives promoting industrial automation, and a large and growing consumer market.
Industrial Sensors Market Product Landscape
The market offers a diverse range of sensors, including temperature sensors, pressure sensors, flow sensors, level sensors, and proximity sensors. Recent innovations focus on miniaturization, improved accuracy, wireless connectivity, and enhanced data analytics capabilities. Key selling propositions include increased durability, reduced maintenance requirements, and seamless integration with existing industrial control systems. Advancements in materials science and micro-electromechanical systems (MEMS) technology contribute to the development of high-performance sensors.
Key Drivers, Barriers & Challenges in Industrial Sensors Market
Key Drivers:
- Widespread adoption of automation and Industry 4.0 principles, leading to increased operational efficiency and productivity.
- Growing demand for predictive maintenance and real-time monitoring capabilities, enabling proactive issue resolution and reduced downtime.
- Continuous advancements in sensor technologies, including improved accuracy, miniaturization, and enhanced connectivity through IoT platforms.
- Government initiatives and supportive policies aimed at promoting industrial automation and smart manufacturing adoption, including tax incentives and funding opportunities.
- Increased focus on data analytics and the utilization of AI/ML for enhanced decision-making and process optimization.
Key Challenges:
- High initial investment costs associated with implementing and integrating sensor technologies into existing infrastructure.
- Complexity in integrating diverse sensor systems and data sources, requiring specialized expertise and robust integration platforms.
- Cybersecurity concerns regarding data security, integrity, and the protection against potential cyber threats, impacting data reliability and market confidence. (estimated impact: [Insert Updated Impact]% reduction in adoption rate).
- Supply chain vulnerabilities and potential disruptions, impacting the availability and cost of raw materials and components (estimated impact: [Insert Updated Impact]% increase in sensor prices).
- Lack of skilled workforce and workforce training to manage and maintain advanced sensor systems.
Emerging Opportunities in Industrial Sensors Market
Emerging opportunities lie in the expansion into untapped markets (e.g., smart agriculture, smart cities), development of innovative applications (e.g., environmental monitoring, precision manufacturing), and the increasing focus on artificial intelligence (AI)-powered sensors for advanced data analysis and decision-making. The growing demand for energy-efficient and sustainable industrial processes also presents significant opportunities for specialized sensors.
Growth Accelerators in the Industrial Sensors Market Industry
Significant technological advancements, including the development of advanced materials, miniaturization techniques, and improved sensor functionalities, are key growth drivers. Strategic partnerships between sensor manufacturers and industrial automation providers are crucial for expanding market penetration and fostering innovation. The expansion of applications into emerging sectors like renewable energy, smart grids, and precision agriculture will further stimulate long-term growth. Additionally, the increasing focus on sustainability and environmental monitoring is creating new opportunities for industrial sensor applications in waste management, pollution control, and resource optimization. The development of standardized communication protocols and data formats will further streamline integration and reduce implementation complexities, accelerating market growth.
Key Players Shaping the Industrial Sensors Market Market
- Honeywell International Inc
- First Sensor AG
- NXP Semiconductors NV
- ams AG
- STMicroelectronics Inc
- Bosch Sensortec GmbH
- Siemens AG
- Omron Corporation
- Omega Engineering Inc
- Sick AG
- Texas Instruments Incorporated
- Rockwell Automation Inc
- ABB Limited
- TE Connectivity Inc
Notable Milestones in Industrial Sensors Market Sector
- March 2022: Rockwell Automation showcased its solutions at MODEX 2022, highlighting advancements in intelligent, connected, and productive industrial operations.
- February 2021: Petasense launched a 3-in-1 industrial sensor integrating vibration, temperature, and speed detection for improved asset monitoring and predictive maintenance.
In-Depth Industrial Sensors Market Market Outlook
The Industrial Sensors Market is poised for continued strong growth, driven by ongoing technological advancements, increasing automation adoption across diverse industries, and the emergence of new applications in areas such as smart cities and renewable energy. Strategic partnerships and investments in R&D will further accelerate market expansion, creating significant opportunities for established players and new entrants alike. The market's future potential is considerable, offering significant returns for companies that can effectively adapt to changing market demands and leverage emerging technologies.
Industrial Sensors Market Segmentation
-
1. Sensor Type
- 1.1. Flow
- 1.2. Pressure
- 1.3. Proximity (Area)
- 1.4. Level Measurement
- 1.5. Temperature
- 1.6. Image
- 1.7. Photoelectric
- 1.8. Other Sensing Types
-
2. End User Vertical
- 2.1. Chemical and Petrochemicals
- 2.2. Mining and Metal
- 2.3. Power
- 2.4. Food and Beverage
- 2.5. Life Sciences
- 2.6. Aerospace and Military
- 2.7. Water and Wastewater
- 2.8. Other End-user Verticals
Industrial Sensors Market Segmentation By Geography
-
1. North America
- 1.1. United States
- 1.2. Canada
-
2. Europe
- 2.1. Germany
- 2.2. United Kingdom
- 2.3. France
-
3. Asia
- 3.1. China
- 3.2. Japan
- 3.3. South Korea
- 4. Australia and New Zealand
- 5. Latin America
- 6. Middle East and Africa

Industrial Sensors Market REPORT HIGHLIGHTS
| Aspects | Details |
|---|---|
| Study Period | 2019-2033 |
| Base Year | 2024 |
| Estimated Year | 2025 |
| Forecast Period | 2025-2033 |
| Historical Period | 2019-2024 |
| Growth Rate | CAGR of 8.69% from 2019-2033 |
| Segmentation |
|
Table of Contents
- 1. Introduction
- 1.1. Research Scope
- 1.2. Market Segmentation
- 1.3. Research Methodology
- 1.4. Definitions and Assumptions
- 2. Executive Summary
- 2.1. Introduction
- 3. Market Dynamics
- 3.1. Introduction
- 3.2. Market Drivers
- 3.2.1. Growing Adoption of IoT Leading to Demand for Sensing Components; Growing Emphasis on the Use of Predictive Maintenance and Remote Monitoring
- 3.3. Market Restrains
- 3.3.1. Cost and Operational Concerns
- 3.4. Market Trends
- 3.4.1. Image Sensors to Hold Significant Share
- 4. Market Factor Analysis
- 4.1. Porters Five Forces
- 4.2. Supply/Value Chain
- 4.3. PESTEL analysis
- 4.4. Market Entropy
- 4.5. Patent/Trademark Analysis
- 5. Global Industrial Sensors Market Analysis, Insights and Forecast, 2019-2031
- 5.1. Market Analysis, Insights and Forecast - by Sensor Type
- 5.1.1. Flow
- 5.1.2. Pressure
- 5.1.3. Proximity (Area)
- 5.1.4. Level Measurement
- 5.1.5. Temperature
- 5.1.6. Image
- 5.1.7. Photoelectric
- 5.1.8. Other Sensing Types
- 5.2. Market Analysis, Insights and Forecast - by End User Vertical
- 5.2.1. Chemical and Petrochemicals
- 5.2.2. Mining and Metal
- 5.2.3. Power
- 5.2.4. Food and Beverage
- 5.2.5. Life Sciences
- 5.2.6. Aerospace and Military
- 5.2.7. Water and Wastewater
- 5.2.8. Other End-user Verticals
- 5.3. Market Analysis, Insights and Forecast - by Region
- 5.3.1. North America
- 5.3.2. Europe
- 5.3.3. Asia
- 5.3.4. Australia and New Zealand
- 5.3.5. Latin America
- 5.3.6. Middle East and Africa
- 5.1. Market Analysis, Insights and Forecast - by Sensor Type
- 6. North America Industrial Sensors Market Analysis, Insights and Forecast, 2019-2031
- 6.1. Market Analysis, Insights and Forecast - by Sensor Type
- 6.1.1. Flow
- 6.1.2. Pressure
- 6.1.3. Proximity (Area)
- 6.1.4. Level Measurement
- 6.1.5. Temperature
- 6.1.6. Image
- 6.1.7. Photoelectric
- 6.1.8. Other Sensing Types
- 6.2. Market Analysis, Insights and Forecast - by End User Vertical
- 6.2.1. Chemical and Petrochemicals
- 6.2.2. Mining and Metal
- 6.2.3. Power
- 6.2.4. Food and Beverage
- 6.2.5. Life Sciences
- 6.2.6. Aerospace and Military
- 6.2.7. Water and Wastewater
- 6.2.8. Other End-user Verticals
- 6.1. Market Analysis, Insights and Forecast - by Sensor Type
- 7. Europe Industrial Sensors Market Analysis, Insights and Forecast, 2019-2031
- 7.1. Market Analysis, Insights and Forecast - by Sensor Type
- 7.1.1. Flow
- 7.1.2. Pressure
- 7.1.3. Proximity (Area)
- 7.1.4. Level Measurement
- 7.1.5. Temperature
- 7.1.6. Image
- 7.1.7. Photoelectric
- 7.1.8. Other Sensing Types
- 7.2. Market Analysis, Insights and Forecast - by End User Vertical
- 7.2.1. Chemical and Petrochemicals
- 7.2.2. Mining and Metal
- 7.2.3. Power
- 7.2.4. Food and Beverage
- 7.2.5. Life Sciences
- 7.2.6. Aerospace and Military
- 7.2.7. Water and Wastewater
- 7.2.8. Other End-user Verticals
- 7.1. Market Analysis, Insights and Forecast - by Sensor Type
- 8. Asia Industrial Sensors Market Analysis, Insights and Forecast, 2019-2031
- 8.1. Market Analysis, Insights and Forecast - by Sensor Type
- 8.1.1. Flow
- 8.1.2. Pressure
- 8.1.3. Proximity (Area)
- 8.1.4. Level Measurement
- 8.1.5. Temperature
- 8.1.6. Image
- 8.1.7. Photoelectric
- 8.1.8. Other Sensing Types
- 8.2. Market Analysis, Insights and Forecast - by End User Vertical
- 8.2.1. Chemical and Petrochemicals
- 8.2.2. Mining and Metal
- 8.2.3. Power
- 8.2.4. Food and Beverage
- 8.2.5. Life Sciences
- 8.2.6. Aerospace and Military
- 8.2.7. Water and Wastewater
- 8.2.8. Other End-user Verticals
- 8.1. Market Analysis, Insights and Forecast - by Sensor Type
- 9. Australia and New Zealand Industrial Sensors Market Analysis, Insights and Forecast, 2019-2031
- 9.1. Market Analysis, Insights and Forecast - by Sensor Type
- 9.1.1. Flow
- 9.1.2. Pressure
- 9.1.3. Proximity (Area)
- 9.1.4. Level Measurement
- 9.1.5. Temperature
- 9.1.6. Image
- 9.1.7. Photoelectric
- 9.1.8. Other Sensing Types
- 9.2. Market Analysis, Insights and Forecast - by End User Vertical
- 9.2.1. Chemical and Petrochemicals
- 9.2.2. Mining and Metal
- 9.2.3. Power
- 9.2.4. Food and Beverage
- 9.2.5. Life Sciences
- 9.2.6. Aerospace and Military
- 9.2.7. Water and Wastewater
- 9.2.8. Other End-user Verticals
- 9.1. Market Analysis, Insights and Forecast - by Sensor Type
- 10. Latin America Industrial Sensors Market Analysis, Insights and Forecast, 2019-2031
- 10.1. Market Analysis, Insights and Forecast - by Sensor Type
- 10.1.1. Flow
- 10.1.2. Pressure
- 10.1.3. Proximity (Area)
- 10.1.4. Level Measurement
- 10.1.5. Temperature
- 10.1.6. Image
- 10.1.7. Photoelectric
- 10.1.8. Other Sensing Types
- 10.2. Market Analysis, Insights and Forecast - by End User Vertical
- 10.2.1. Chemical and Petrochemicals
- 10.2.2. Mining and Metal
- 10.2.3. Power
- 10.2.4. Food and Beverage
- 10.2.5. Life Sciences
- 10.2.6. Aerospace and Military
- 10.2.7. Water and Wastewater
- 10.2.8. Other End-user Verticals
- 10.1. Market Analysis, Insights and Forecast - by Sensor Type
- 11. Middle East and Africa Industrial Sensors Market Analysis, Insights and Forecast, 2019-2031
- 11.1. Market Analysis, Insights and Forecast - by Sensor Type
- 11.1.1. Flow
- 11.1.2. Pressure
- 11.1.3. Proximity (Area)
- 11.1.4. Level Measurement
- 11.1.5. Temperature
- 11.1.6. Image
- 11.1.7. Photoelectric
- 11.1.8. Other Sensing Types
- 11.2. Market Analysis, Insights and Forecast - by End User Vertical
- 11.2.1. Chemical and Petrochemicals
- 11.2.2. Mining and Metal
- 11.2.3. Power
- 11.2.4. Food and Beverage
- 11.2.5. Life Sciences
- 11.2.6. Aerospace and Military
- 11.2.7. Water and Wastewater
- 11.2.8. Other End-user Verticals
- 11.1. Market Analysis, Insights and Forecast - by Sensor Type
- 12. United States Industrial Sensors Market Analysis, Insights and Forecast, 2019-2031
- 12.1. Market Analysis, Insights and Forecast - By Country/Sub-region
- 12.1.1.
- 13. Canada Industrial Sensors Market Analysis, Insights and Forecast, 2019-2031
- 13.1. Market Analysis, Insights and Forecast - By Country/Sub-region
- 13.1.1.
- 14. Germany Industrial Sensors Market Analysis, Insights and Forecast, 2019-2031
- 14.1. Market Analysis, Insights and Forecast - By Country/Sub-region
- 14.1.1.
- 15. United Kingdom Industrial Sensors Market Analysis, Insights and Forecast, 2019-2031
- 15.1. Market Analysis, Insights and Forecast - By Country/Sub-region
- 15.1.1.
- 16. France Industrial Sensors Market Analysis, Insights and Forecast, 2019-2031
- 16.1. Market Analysis, Insights and Forecast - By Country/Sub-region
- 16.1.1.
- 17. Rest of Europe Industrial Sensors Market Analysis, Insights and Forecast, 2019-2031
- 17.1. Market Analysis, Insights and Forecast - By Country/Sub-region
- 17.1.1.
- 18. China Industrial Sensors Market Analysis, Insights and Forecast, 2019-2031
- 18.1. Market Analysis, Insights and Forecast - By Country/Sub-region
- 18.1.1.
- 19. Japan Industrial Sensors Market Analysis, Insights and Forecast, 2019-2031
- 19.1. Market Analysis, Insights and Forecast - By Country/Sub-region
- 19.1.1.
- 20. South Korea Industrial Sensors Market Analysis, Insights and Forecast, 2019-2031
- 20.1. Market Analysis, Insights and Forecast - By Country/Sub-region
- 20.1.1.
- 21. Rest of Asia Pacific Industrial Sensors Market Analysis, Insights and Forecast, 2019-2031
- 21.1. Market Analysis, Insights and Forecast - By Country/Sub-region
- 21.1.1.
- 22. Competitive Analysis
- 22.1. Global Market Share Analysis 2024
- 22.2. Company Profiles
- 22.2.1 Honeywell International Inc
- 22.2.1.1. Overview
- 22.2.1.2. Products
- 22.2.1.3. SWOT Analysis
- 22.2.1.4. Recent Developments
- 22.2.1.5. Financials (Based on Availability)
- 22.2.2 First Sensor AG
- 22.2.2.1. Overview
- 22.2.2.2. Products
- 22.2.2.3. SWOT Analysis
- 22.2.2.4. Recent Developments
- 22.2.2.5. Financials (Based on Availability)
- 22.2.3 NXP Semiconductors NV
- 22.2.3.1. Overview
- 22.2.3.2. Products
- 22.2.3.3. SWOT Analysis
- 22.2.3.4. Recent Developments
- 22.2.3.5. Financials (Based on Availability)
- 22.2.4 ams AG
- 22.2.4.1. Overview
- 22.2.4.2. Products
- 22.2.4.3. SWOT Analysis
- 22.2.4.4. Recent Developments
- 22.2.4.5. Financials (Based on Availability)
- 22.2.5 STMicroelectronics Inc
- 22.2.5.1. Overview
- 22.2.5.2. Products
- 22.2.5.3. SWOT Analysis
- 22.2.5.4. Recent Developments
- 22.2.5.5. Financials (Based on Availability)
- 22.2.6 Bosch Sensortec GmbH
- 22.2.6.1. Overview
- 22.2.6.2. Products
- 22.2.6.3. SWOT Analysis
- 22.2.6.4. Recent Developments
- 22.2.6.5. Financials (Based on Availability)
- 22.2.7 Siemens AG
- 22.2.7.1. Overview
- 22.2.7.2. Products
- 22.2.7.3. SWOT Analysis
- 22.2.7.4. Recent Developments
- 22.2.7.5. Financials (Based on Availability)
- 22.2.8 Omron Corporation*List Not Exhaustive
- 22.2.8.1. Overview
- 22.2.8.2. Products
- 22.2.8.3. SWOT Analysis
- 22.2.8.4. Recent Developments
- 22.2.8.5. Financials (Based on Availability)
- 22.2.9 Omega Engineering Inc
- 22.2.9.1. Overview
- 22.2.9.2. Products
- 22.2.9.3. SWOT Analysis
- 22.2.9.4. Recent Developments
- 22.2.9.5. Financials (Based on Availability)
- 22.2.10 Sick AG
- 22.2.10.1. Overview
- 22.2.10.2. Products
- 22.2.10.3. SWOT Analysis
- 22.2.10.4. Recent Developments
- 22.2.10.5. Financials (Based on Availability)
- 22.2.11 Texas Instruments Incorporated
- 22.2.11.1. Overview
- 22.2.11.2. Products
- 22.2.11.3. SWOT Analysis
- 22.2.11.4. Recent Developments
- 22.2.11.5. Financials (Based on Availability)
- 22.2.12 Rockwell Automation Inc
- 22.2.12.1. Overview
- 22.2.12.2. Products
- 22.2.12.3. SWOT Analysis
- 22.2.12.4. Recent Developments
- 22.2.12.5. Financials (Based on Availability)
- 22.2.13 ABB Limited
- 22.2.13.1. Overview
- 22.2.13.2. Products
- 22.2.13.3. SWOT Analysis
- 22.2.13.4. Recent Developments
- 22.2.13.5. Financials (Based on Availability)
- 22.2.14 TE Connectivity Inc
- 22.2.14.1. Overview
- 22.2.14.2. Products
- 22.2.14.3. SWOT Analysis
- 22.2.14.4. Recent Developments
- 22.2.14.5. Financials (Based on Availability)
- 22.2.1 Honeywell International Inc
List of Figures
- Figure 1: Global Industrial Sensors Market Revenue Breakdown (Million, %) by Region 2024 & 2032
- Figure 2: United States Industrial Sensors Market Revenue (Million), by Country 2024 & 2032
- Figure 3: United States Industrial Sensors Market Revenue Share (%), by Country 2024 & 2032
- Figure 4: Canada Industrial Sensors Market Revenue (Million), by Country 2024 & 2032
- Figure 5: Canada Industrial Sensors Market Revenue Share (%), by Country 2024 & 2032
- Figure 6: Germany Industrial Sensors Market Revenue (Million), by Country 2024 & 2032
- Figure 7: Germany Industrial Sensors Market Revenue Share (%), by Country 2024 & 2032
- Figure 8: United Kingdom Industrial Sensors Market Revenue (Million), by Country 2024 & 2032
- Figure 9: United Kingdom Industrial Sensors Market Revenue Share (%), by Country 2024 & 2032
- Figure 10: France Industrial Sensors Market Revenue (Million), by Country 2024 & 2032
- Figure 11: France Industrial Sensors Market Revenue Share (%), by Country 2024 & 2032
- Figure 12: Rest of Europe Industrial Sensors Market Revenue (Million), by Country 2024 & 2032
- Figure 13: Rest of Europe Industrial Sensors Market Revenue Share (%), by Country 2024 & 2032
- Figure 14: China Industrial Sensors Market Revenue (Million), by Country 2024 & 2032
- Figure 15: China Industrial Sensors Market Revenue Share (%), by Country 2024 & 2032
- Figure 16: Japan Industrial Sensors Market Revenue (Million), by Country 2024 & 2032
- Figure 17: Japan Industrial Sensors Market Revenue Share (%), by Country 2024 & 2032
- Figure 18: South Korea Industrial Sensors Market Revenue (Million), by Country 2024 & 2032
- Figure 19: South Korea Industrial Sensors Market Revenue Share (%), by Country 2024 & 2032
- Figure 20: Rest of Asia Pacific Industrial Sensors Market Revenue (Million), by Country 2024 & 2032
- Figure 21: Rest of Asia Pacific Industrial Sensors Market Revenue Share (%), by Country 2024 & 2032
- Figure 22: North America Industrial Sensors Market Revenue (Million), by Sensor Type 2024 & 2032
- Figure 23: North America Industrial Sensors Market Revenue Share (%), by Sensor Type 2024 & 2032
- Figure 24: North America Industrial Sensors Market Revenue (Million), by End User Vertical 2024 & 2032
- Figure 25: North America Industrial Sensors Market Revenue Share (%), by End User Vertical 2024 & 2032
- Figure 26: North America Industrial Sensors Market Revenue (Million), by Country 2024 & 2032
- Figure 27: North America Industrial Sensors Market Revenue Share (%), by Country 2024 & 2032
- Figure 28: Europe Industrial Sensors Market Revenue (Million), by Sensor Type 2024 & 2032
- Figure 29: Europe Industrial Sensors Market Revenue Share (%), by Sensor Type 2024 & 2032
- Figure 30: Europe Industrial Sensors Market Revenue (Million), by End User Vertical 2024 & 2032
- Figure 31: Europe Industrial Sensors Market Revenue Share (%), by End User Vertical 2024 & 2032
- Figure 32: Europe Industrial Sensors Market Revenue (Million), by Country 2024 & 2032
- Figure 33: Europe Industrial Sensors Market Revenue Share (%), by Country 2024 & 2032
- Figure 34: Asia Industrial Sensors Market Revenue (Million), by Sensor Type 2024 & 2032
- Figure 35: Asia Industrial Sensors Market Revenue Share (%), by Sensor Type 2024 & 2032
- Figure 36: Asia Industrial Sensors Market Revenue (Million), by End User Vertical 2024 & 2032
- Figure 37: Asia Industrial Sensors Market Revenue Share (%), by End User Vertical 2024 & 2032
- Figure 38: Asia Industrial Sensors Market Revenue (Million), by Country 2024 & 2032
- Figure 39: Asia Industrial Sensors Market Revenue Share (%), by Country 2024 & 2032
- Figure 40: Australia and New Zealand Industrial Sensors Market Revenue (Million), by Sensor Type 2024 & 2032
- Figure 41: Australia and New Zealand Industrial Sensors Market Revenue Share (%), by Sensor Type 2024 & 2032
- Figure 42: Australia and New Zealand Industrial Sensors Market Revenue (Million), by End User Vertical 2024 & 2032
- Figure 43: Australia and New Zealand Industrial Sensors Market Revenue Share (%), by End User Vertical 2024 & 2032
- Figure 44: Australia and New Zealand Industrial Sensors Market Revenue (Million), by Country 2024 & 2032
- Figure 45: Australia and New Zealand Industrial Sensors Market Revenue Share (%), by Country 2024 & 2032
- Figure 46: Latin America Industrial Sensors Market Revenue (Million), by Sensor Type 2024 & 2032
- Figure 47: Latin America Industrial Sensors Market Revenue Share (%), by Sensor Type 2024 & 2032
- Figure 48: Latin America Industrial Sensors Market Revenue (Million), by End User Vertical 2024 & 2032
- Figure 49: Latin America Industrial Sensors Market Revenue Share (%), by End User Vertical 2024 & 2032
- Figure 50: Latin America Industrial Sensors Market Revenue (Million), by Country 2024 & 2032
- Figure 51: Latin America Industrial Sensors Market Revenue Share (%), by Country 2024 & 2032
- Figure 52: Middle East and Africa Industrial Sensors Market Revenue (Million), by Sensor Type 2024 & 2032
- Figure 53: Middle East and Africa Industrial Sensors Market Revenue Share (%), by Sensor Type 2024 & 2032
- Figure 54: Middle East and Africa Industrial Sensors Market Revenue (Million), by End User Vertical 2024 & 2032
- Figure 55: Middle East and Africa Industrial Sensors Market Revenue Share (%), by End User Vertical 2024 & 2032
- Figure 56: Middle East and Africa Industrial Sensors Market Revenue (Million), by Country 2024 & 2032
- Figure 57: Middle East and Africa Industrial Sensors Market Revenue Share (%), by Country 2024 & 2032
List of Tables
- Table 1: Global Industrial Sensors Market Revenue Million Forecast, by Region 2019 & 2032
- Table 2: Global Industrial Sensors Market Revenue Million Forecast, by Sensor Type 2019 & 2032
- Table 3: Global Industrial Sensors Market Revenue Million Forecast, by End User Vertical 2019 & 2032
- Table 4: Global Industrial Sensors Market Revenue Million Forecast, by Region 2019 & 2032
- Table 5: Global Industrial Sensors Market Revenue Million Forecast, by Country 2019 & 2032
- Table 6: Industrial Sensors Market Revenue (Million) Forecast, by Application 2019 & 2032
- Table 7: Global Industrial Sensors Market Revenue Million Forecast, by Country 2019 & 2032
- Table 8: Industrial Sensors Market Revenue (Million) Forecast, by Application 2019 & 2032
- Table 9: Global Industrial Sensors Market Revenue Million Forecast, by Country 2019 & 2032
- Table 10: Industrial Sensors Market Revenue (Million) Forecast, by Application 2019 & 2032
- Table 11: Global Industrial Sensors Market Revenue Million Forecast, by Country 2019 & 2032
- Table 12: Industrial Sensors Market Revenue (Million) Forecast, by Application 2019 & 2032
- Table 13: Global Industrial Sensors Market Revenue Million Forecast, by Country 2019 & 2032
- Table 14: Industrial Sensors Market Revenue (Million) Forecast, by Application 2019 & 2032
- Table 15: Global Industrial Sensors Market Revenue Million Forecast, by Country 2019 & 2032
- Table 16: Industrial Sensors Market Revenue (Million) Forecast, by Application 2019 & 2032
- Table 17: Global Industrial Sensors Market Revenue Million Forecast, by Country 2019 & 2032
- Table 18: Industrial Sensors Market Revenue (Million) Forecast, by Application 2019 & 2032
- Table 19: Global Industrial Sensors Market Revenue Million Forecast, by Country 2019 & 2032
- Table 20: Industrial Sensors Market Revenue (Million) Forecast, by Application 2019 & 2032
- Table 21: Global Industrial Sensors Market Revenue Million Forecast, by Country 2019 & 2032
- Table 22: Industrial Sensors Market Revenue (Million) Forecast, by Application 2019 & 2032
- Table 23: Global Industrial Sensors Market Revenue Million Forecast, by Country 2019 & 2032
- Table 24: Industrial Sensors Market Revenue (Million) Forecast, by Application 2019 & 2032
- Table 25: Global Industrial Sensors Market Revenue Million Forecast, by Sensor Type 2019 & 2032
- Table 26: Global Industrial Sensors Market Revenue Million Forecast, by End User Vertical 2019 & 2032
- Table 27: Global Industrial Sensors Market Revenue Million Forecast, by Country 2019 & 2032
- Table 28: United States Industrial Sensors Market Revenue (Million) Forecast, by Application 2019 & 2032
- Table 29: Canada Industrial Sensors Market Revenue (Million) Forecast, by Application 2019 & 2032
- Table 30: Global Industrial Sensors Market Revenue Million Forecast, by Sensor Type 2019 & 2032
- Table 31: Global Industrial Sensors Market Revenue Million Forecast, by End User Vertical 2019 & 2032
- Table 32: Global Industrial Sensors Market Revenue Million Forecast, by Country 2019 & 2032
- Table 33: Germany Industrial Sensors Market Revenue (Million) Forecast, by Application 2019 & 2032
- Table 34: United Kingdom Industrial Sensors Market Revenue (Million) Forecast, by Application 2019 & 2032
- Table 35: France Industrial Sensors Market Revenue (Million) Forecast, by Application 2019 & 2032
- Table 36: Global Industrial Sensors Market Revenue Million Forecast, by Sensor Type 2019 & 2032
- Table 37: Global Industrial Sensors Market Revenue Million Forecast, by End User Vertical 2019 & 2032
- Table 38: Global Industrial Sensors Market Revenue Million Forecast, by Country 2019 & 2032
- Table 39: China Industrial Sensors Market Revenue (Million) Forecast, by Application 2019 & 2032
- Table 40: Japan Industrial Sensors Market Revenue (Million) Forecast, by Application 2019 & 2032
- Table 41: South Korea Industrial Sensors Market Revenue (Million) Forecast, by Application 2019 & 2032
- Table 42: Global Industrial Sensors Market Revenue Million Forecast, by Sensor Type 2019 & 2032
- Table 43: Global Industrial Sensors Market Revenue Million Forecast, by End User Vertical 2019 & 2032
- Table 44: Global Industrial Sensors Market Revenue Million Forecast, by Country 2019 & 2032
- Table 45: Global Industrial Sensors Market Revenue Million Forecast, by Sensor Type 2019 & 2032
- Table 46: Global Industrial Sensors Market Revenue Million Forecast, by End User Vertical 2019 & 2032
- Table 47: Global Industrial Sensors Market Revenue Million Forecast, by Country 2019 & 2032
- Table 48: Global Industrial Sensors Market Revenue Million Forecast, by Sensor Type 2019 & 2032
- Table 49: Global Industrial Sensors Market Revenue Million Forecast, by End User Vertical 2019 & 2032
- Table 50: Global Industrial Sensors Market Revenue Million Forecast, by Country 2019 & 2032
Frequently Asked Questions
1. What is the projected Compound Annual Growth Rate (CAGR) of the Industrial Sensors Market?
The projected CAGR is approximately 8.69%.
2. Which companies are prominent players in the Industrial Sensors Market?
Key companies in the market include Honeywell International Inc, First Sensor AG, NXP Semiconductors NV, ams AG, STMicroelectronics Inc, Bosch Sensortec GmbH, Siemens AG, Omron Corporation*List Not Exhaustive, Omega Engineering Inc, Sick AG, Texas Instruments Incorporated, Rockwell Automation Inc, ABB Limited, TE Connectivity Inc.
3. What are the main segments of the Industrial Sensors Market?
The market segments include Sensor Type, End User Vertical.
4. Can you provide details about the market size?
The market size is estimated to be USD 27.39 Million as of 2022.
5. What are some drivers contributing to market growth?
Growing Adoption of IoT Leading to Demand for Sensing Components; Growing Emphasis on the Use of Predictive Maintenance and Remote Monitoring.
6. What are the notable trends driving market growth?
Image Sensors to Hold Significant Share.
7. Are there any restraints impacting market growth?
Cost and Operational Concerns.
8. Can you provide examples of recent developments in the market?
March 2022 -Rockwell Automation, the world's largest company dedicated to industrial automation and digital transformation, announced exhibiting at MODEX 2022 in Atlanta, Ga., March 28-31. The company demonstrated its proven solutions to help customers' operations be more intelligent, connected, and productive.
9. What pricing options are available for accessing the report?
Pricing options include single-user, multi-user, and enterprise licenses priced at USD 4750, USD 5250, and USD 8750 respectively.
10. Is the market size provided in terms of value or volume?
The market size is provided in terms of value, measured in Million.
11. Are there any specific market keywords associated with the report?
Yes, the market keyword associated with the report is "Industrial Sensors Market," which aids in identifying and referencing the specific market segment covered.
12. How do I determine which pricing option suits my needs best?
The pricing options vary based on user requirements and access needs. Individual users may opt for single-user licenses, while businesses requiring broader access may choose multi-user or enterprise licenses for cost-effective access to the report.
13. Are there any additional resources or data provided in the Industrial Sensors Market report?
While the report offers comprehensive insights, it's advisable to review the specific contents or supplementary materials provided to ascertain if additional resources or data are available.
14. How can I stay updated on further developments or reports in the Industrial Sensors Market?
To stay informed about further developments, trends, and reports in the Industrial Sensors Market, consider subscribing to industry newsletters, following relevant companies and organizations, or regularly checking reputable industry news sources and publications.
Methodology
Step 1 - Identification of Relevant Samples Size from Population Database


Step 2 - Approaches for Defining Global Market Size (Value, Volume* & Price*)

Note*: In applicable scenarios
Step 3 - Data Sources
Primary Research
- Web Analytics
- Survey Reports
- Research Institute
- Latest Research Reports
- Opinion Leaders
Secondary Research
- Annual Reports
- White Paper
- Latest Press Release
- Industry Association
- Paid Database
- Investor Presentations

Step 4 - Data Triangulation
Involves using different sources of information in order to increase the validity of a study
These sources are likely to be stakeholders in a program - participants, other researchers, program staff, other community members, and so on.
Then we put all data in single framework & apply various statistical tools to find out the dynamic on the market.
During the analysis stage, feedback from the stakeholder groups would be compared to determine areas of agreement as well as areas of divergence


