
Key Insights
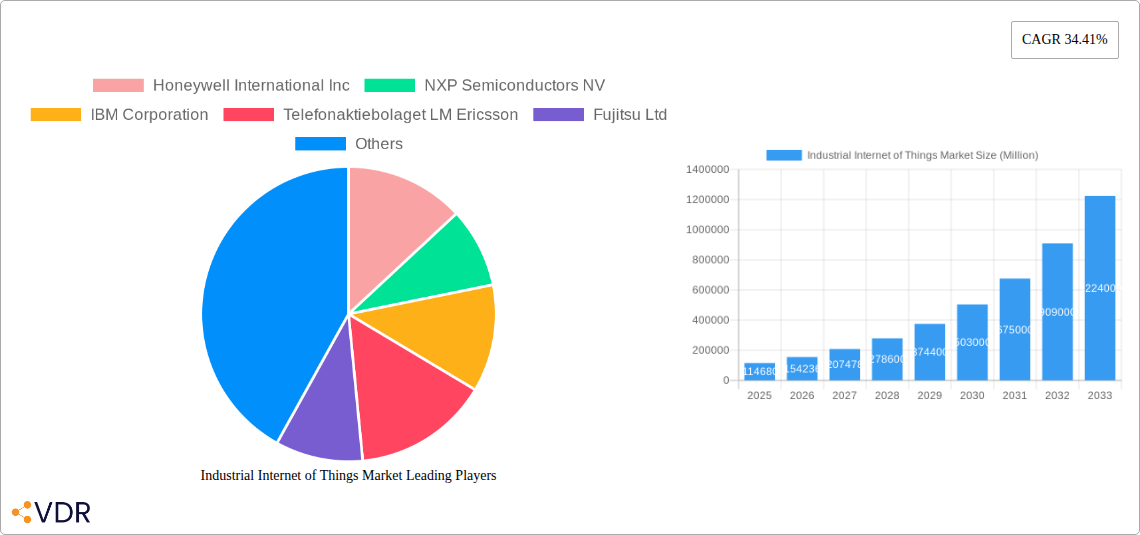
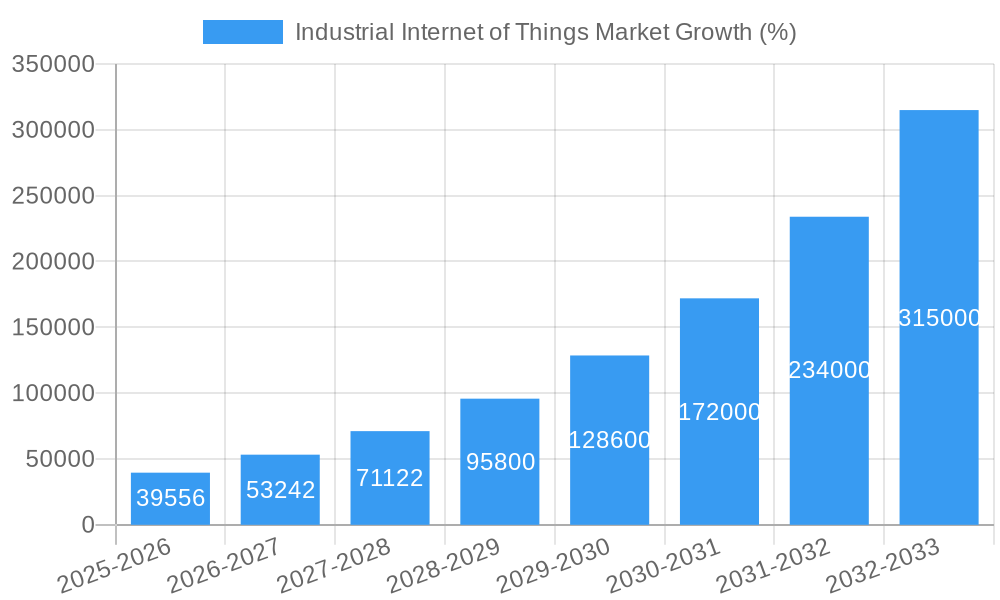
The Industrial Internet of Things (IIoT) market is experiencing robust growth, projected to reach a substantial size with a Compound Annual Growth Rate (CAGR) of 34.41% from 2025 to 2033. This expansion is driven by several key factors. Firstly, the increasing adoption of advanced technologies like artificial intelligence (AI), machine learning (ML), and big data analytics within industrial settings is enabling improved operational efficiency, predictive maintenance, and enhanced decision-making. Secondly, the rising need for automation and digitization across diverse sectors such as manufacturing, transportation, and energy is fueling demand for IIoT solutions. The convergence of operational technology (OT) and information technology (IT) is also a major contributor, allowing for seamless data integration and real-time insights. Furthermore, government initiatives promoting smart manufacturing and digital transformation are creating a favorable environment for IIoT market expansion. Significant investments from major technology companies and industrial players are also driving innovation and broadening the scope of applications.
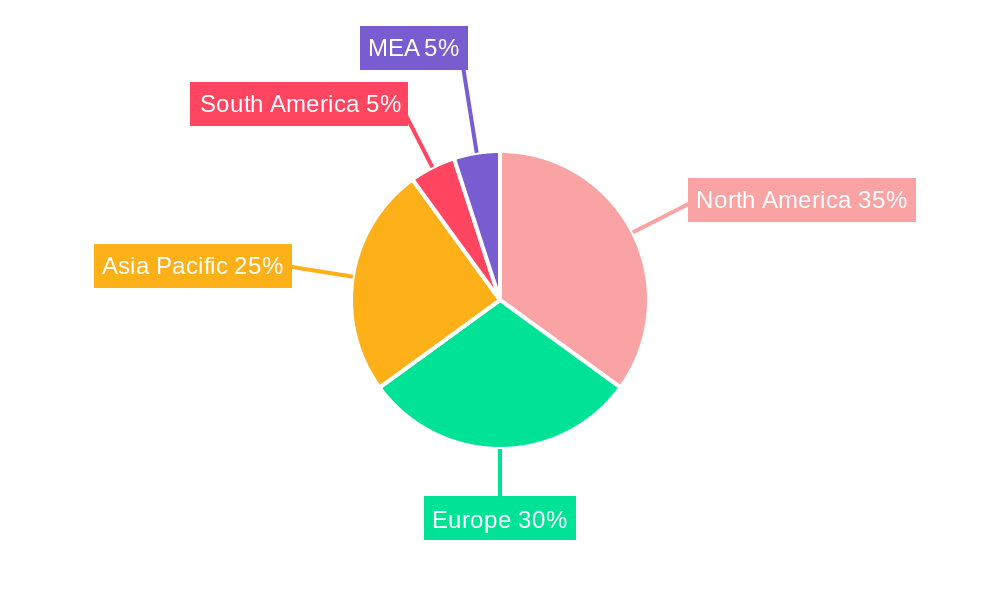
The market segmentation reveals significant opportunities across hardware, software, services & connectivity, and various end-user verticals. While manufacturing currently holds a dominant position, the transportation, oil & gas, and utility sectors are experiencing rapid IIoT adoption, indicating substantial future growth potential in these areas. Geographically, North America and Europe are currently leading the market, but the Asia-Pacific region is poised for rapid expansion due to its growing industrial base and increasing investments in digital infrastructure. Competition is intense, with established players like Honeywell, Siemens, and IBM alongside emerging technology companies vying for market share. The ongoing expansion of 5G networks and the increasing affordability of IIoT solutions are expected to further accelerate market growth in the coming years, presenting both challenges and opportunities for companies operating in this dynamic landscape. Future growth will likely hinge on the ability of companies to innovate, develop robust cybersecurity measures, and address the unique needs of different industries and regions.
Industrial Internet of Things (IIoT) Market: A Comprehensive Report (2019-2033)
This in-depth report provides a comprehensive analysis of the Industrial Internet of Things (IIoT) market, encompassing market dynamics, growth trends, regional dominance, product landscape, key players, and future outlook. The study period covers 2019-2033, with 2025 as the base and estimated year. The forecast period is 2025-2033, and the historical period is 2019-2024. This report is crucial for industry professionals seeking to understand the evolving IIoT landscape and capitalize on emerging opportunities. The market is segmented by Type (Hardware, Software, Services & Connectivity) and End-user Vertical (Manufacturing, Transportation, Oil and Gas, Utility, Other End-user Verticals). The total market size in 2025 is estimated at xx Million units and is projected to reach xx Million units by 2033.
Industrial Internet of Things Market Market Dynamics & Structure
The IIoT market is characterized by a moderately concentrated landscape with key players vying for market share. Technological innovation, driven by advancements in areas such as AI, machine learning, and 5G, is a major growth driver. Regulatory frameworks, particularly concerning data security and privacy, play a significant role in shaping market dynamics. Competitive product substitutes, including traditional industrial automation systems, exert pressure on market growth. End-user demographics, particularly the increasing adoption of IIoT solutions across diverse industries, are driving market expansion. Mergers and acquisitions (M&A) activity is significant, with larger companies acquiring smaller, specialized IIoT firms to enhance their product portfolios and expand market reach.
- Market Concentration: Moderately concentrated, with top 5 players holding approximately xx% market share in 2025.
- Technological Innovation: AI, machine learning, and 5G are key drivers, while interoperability challenges remain a barrier.
- Regulatory Frameworks: Data privacy regulations (e.g., GDPR) and cybersecurity standards are influencing market growth.
- M&A Activity: xx deals recorded in the last 5 years, with an average deal value of xx Million units.
- End-user Demographics: Growing adoption across manufacturing, transportation, and energy sectors.
Industrial Internet of Things Market Growth Trends & Insights
The IIoT market experienced robust growth between 2019 and 2024, with a CAGR of xx%. This growth is driven by increasing digitization across industries, the need for improved operational efficiency, and the rising adoption of smart manufacturing and Industry 4.0 initiatives. Technological disruptions, such as the emergence of edge computing and blockchain technology, are further accelerating market expansion. Shifts in consumer behavior, including increased demand for real-time data analytics and predictive maintenance, are shaping market trends. Market penetration is expected to reach xx% by 2033, driven by increasing adoption across various verticals.
Dominant Regions, Countries, or Segments in Industrial Internet of Things Market
North America currently dominates the IIoT market, driven by early adoption of advanced technologies and a robust industrial base. Within this region, the United States holds the largest market share due to the presence of major technology companies and a high concentration of industrial enterprises. However, Asia-Pacific is projected to experience the fastest growth during the forecast period, driven by rapid industrialization and increasing government support for IIoT initiatives. The Manufacturing segment is currently the largest end-user vertical, followed by Transportation and Oil & Gas. Hardware currently holds the largest share in terms of type, followed by Software and Services & Connectivity.
- North America: Strong presence of major technology companies and high industrial adoption.
- Asia-Pacific: Fastest-growing region, fueled by rapid industrialization and government support.
- Manufacturing: Largest end-user vertical due to the high demand for automation and efficiency improvements.
- Hardware: Largest segment by type, driven by the need for connected devices and sensors.
Industrial Internet of Things Market Product Landscape
The IIoT product landscape is characterized by a wide range of hardware components (sensors, actuators, gateways), software platforms (data analytics, cloud-based solutions), and connectivity solutions (cellular, Wi-Fi, LPWAN). Innovations focus on improving data security, enhancing interoperability, and developing more robust and reliable IIoT solutions. Key selling propositions include improved efficiency, reduced operational costs, and enhanced decision-making capabilities. Technological advancements are focused on reducing latency, increasing data bandwidth, and improving the overall reliability of IIoT networks.
Key Drivers, Barriers & Challenges in Industrial Internet of Things Market
Key Drivers: Increasing demand for automation and efficiency improvements across industries, rising adoption of Industry 4.0 initiatives, and technological advancements in areas such as AI, machine learning, and 5G are major drivers. Government regulations are also creating a favorable environment.
Challenges: High implementation costs, security concerns, integration complexities, and lack of skilled workforce are key barriers. Supply chain disruptions can also lead to significant delays and increased costs.
Emerging Opportunities in Industrial Internet of Things Market
Emerging opportunities include the expansion of IIoT applications into new industries (e.g., agriculture, healthcare), the development of innovative solutions for predictive maintenance and asset management, and the growth of edge computing and AI-powered solutions. Untapped markets in developing economies also present significant opportunities for growth.
Growth Accelerators in the Industrial Internet of Things Market Industry
Technological breakthroughs in areas such as 5G and AI, coupled with strategic partnerships between technology providers and industrial enterprises, are significant growth catalysts. Government initiatives promoting digitalization and IIoT adoption also play a role. Expansion into new geographic markets and the development of new IIoT applications are also key growth accelerators.
Key Players Shaping the Industrial Internet of Things Market Market
- Honeywell International Inc
- NXP Semiconductors NV
- IBM Corporation
- Telefonaktiebolaget LM Ericsson
- Fujitsu Ltd
- Cypress Semiconductor Corporation
- Telit Communications Plc
- Emerson Electric Co
- Mitsubishi Electric Corporation
- Cisco Systems Inc
- Siemens AG
- Amazon Web Services Inc
- PTC Inc
- Robert Bosch GmbH
- OMRON Corporation
- Oracle Corporation
- SAP SE
- General Electric Company
Notable Milestones in Industrial Internet of Things Market Sector
- February 2023: Cisco launched new cloud management tools for industrial IoT (IIoT) applications, enhancing network visibility and control. This improved IT/OT operations dashboards and provides flexible network intelligence.
- February 2023: KORE unveiled MODGo, an IoT asset management software platform, at Mobile World Congress Barcelona, simplifying IoT implementation and management. This streamlined device deployment, network connectivity, and overall lifecycle management.
In-Depth Industrial Internet of Things Market Market Outlook
The IIoT market is poised for continued strong growth, driven by ongoing technological advancements, increasing digitalization across industries, and the growing demand for improved operational efficiency. Strategic partnerships and collaborations among technology providers, industrial enterprises, and government agencies will further fuel market expansion. The focus on data security, interoperability, and the development of innovative IIoT solutions will shape the future of the market, creating significant opportunities for businesses to leverage the power of interconnected devices and data analytics for improved productivity and efficiency.
Industrial Internet of Things Market Segmentation
-
1. Type
- 1.1. Hardware
- 1.2. Software
- 1.3. Services & Connectivity
-
2. End-user Vertical
- 2.1. Manufacturing
- 2.2. Transportation
- 2.3. Oil and Gas
- 2.4. Utility
- 2.5. Other End-user Verticals
Industrial Internet of Things Market Segmentation By Geography
- 1. North America
- 2. Europe
- 3. Asia Pacific
- 4. Rest of the World
Industrial Internet of Things Market REPORT HIGHLIGHTS
| Aspects | Details |
|---|---|
| Study Period | 2019-2033 |
| Base Year | 2024 |
| Estimated Year | 2025 |
| Forecast Period | 2025-2033 |
| Historical Period | 2019-2024 |
| Growth Rate | CAGR of 34.41% from 2019-2033 |
| Segmentation |
|
Table of Contents
- 1. Introduction
- 1.1. Research Scope
- 1.2. Market Segmentation
- 1.3. Research Methodology
- 1.4. Definitions and Assumptions
- 2. Executive Summary
- 2.1. Introduction
- 3. Market Dynamics
- 3.1. Introduction
- 3.2. Market Drivers
- 3.2.1. Proliferation of digitization and adoption of sensors in plants; Growing demand for automated and efficient process
- 3.3. Market Restrains
- 3.3.1. Issues Related to Security and Privacy of Data and Connectivity of Devices and Interoperability
- 3.4. Market Trends
- 3.4.1. Manufacturing to Hold Major Market Share
- 4. Market Factor Analysis
- 4.1. Porters Five Forces
- 4.2. Supply/Value Chain
- 4.3. PESTEL analysis
- 4.4. Market Entropy
- 4.5. Patent/Trademark Analysis
- 5. Global Industrial Internet of Things Market Analysis, Insights and Forecast, 2019-2031
- 5.1. Market Analysis, Insights and Forecast - by Type
- 5.1.1. Hardware
- 5.1.2. Software
- 5.1.3. Services & Connectivity
- 5.2. Market Analysis, Insights and Forecast - by End-user Vertical
- 5.2.1. Manufacturing
- 5.2.2. Transportation
- 5.2.3. Oil and Gas
- 5.2.4. Utility
- 5.2.5. Other End-user Verticals
- 5.3. Market Analysis, Insights and Forecast - by Region
- 5.3.1. North America
- 5.3.2. Europe
- 5.3.3. Asia Pacific
- 5.3.4. Rest of the World
- 5.1. Market Analysis, Insights and Forecast - by Type
- 6. North America Industrial Internet of Things Market Analysis, Insights and Forecast, 2019-2031
- 6.1. Market Analysis, Insights and Forecast - by Type
- 6.1.1. Hardware
- 6.1.2. Software
- 6.1.3. Services & Connectivity
- 6.2. Market Analysis, Insights and Forecast - by End-user Vertical
- 6.2.1. Manufacturing
- 6.2.2. Transportation
- 6.2.3. Oil and Gas
- 6.2.4. Utility
- 6.2.5. Other End-user Verticals
- 6.1. Market Analysis, Insights and Forecast - by Type
- 7. Europe Industrial Internet of Things Market Analysis, Insights and Forecast, 2019-2031
- 7.1. Market Analysis, Insights and Forecast - by Type
- 7.1.1. Hardware
- 7.1.2. Software
- 7.1.3. Services & Connectivity
- 7.2. Market Analysis, Insights and Forecast - by End-user Vertical
- 7.2.1. Manufacturing
- 7.2.2. Transportation
- 7.2.3. Oil and Gas
- 7.2.4. Utility
- 7.2.5. Other End-user Verticals
- 7.1. Market Analysis, Insights and Forecast - by Type
- 8. Asia Pacific Industrial Internet of Things Market Analysis, Insights and Forecast, 2019-2031
- 8.1. Market Analysis, Insights and Forecast - by Type
- 8.1.1. Hardware
- 8.1.2. Software
- 8.1.3. Services & Connectivity
- 8.2. Market Analysis, Insights and Forecast - by End-user Vertical
- 8.2.1. Manufacturing
- 8.2.2. Transportation
- 8.2.3. Oil and Gas
- 8.2.4. Utility
- 8.2.5. Other End-user Verticals
- 8.1. Market Analysis, Insights and Forecast - by Type
- 9. Rest of the World Industrial Internet of Things Market Analysis, Insights and Forecast, 2019-2031
- 9.1. Market Analysis, Insights and Forecast - by Type
- 9.1.1. Hardware
- 9.1.2. Software
- 9.1.3. Services & Connectivity
- 9.2. Market Analysis, Insights and Forecast - by End-user Vertical
- 9.2.1. Manufacturing
- 9.2.2. Transportation
- 9.2.3. Oil and Gas
- 9.2.4. Utility
- 9.2.5. Other End-user Verticals
- 9.1. Market Analysis, Insights and Forecast - by Type
- 10. North America Industrial Internet of Things Market Analysis, Insights and Forecast, 2019-2031
- 10.1. Market Analysis, Insights and Forecast - By Country/Sub-region
- 10.1.1 United States
- 10.1.2 Canada
- 10.1.3 Mexico
- 11. Europe Industrial Internet of Things Market Analysis, Insights and Forecast, 2019-2031
- 11.1. Market Analysis, Insights and Forecast - By Country/Sub-region
- 11.1.1 Germany
- 11.1.2 United Kingdom
- 11.1.3 France
- 11.1.4 Spain
- 11.1.5 Italy
- 11.1.6 Spain
- 11.1.7 Belgium
- 11.1.8 Netherland
- 11.1.9 Nordics
- 11.1.10 Rest of Europe
- 12. Asia Pacific Industrial Internet of Things Market Analysis, Insights and Forecast, 2019-2031
- 12.1. Market Analysis, Insights and Forecast - By Country/Sub-region
- 12.1.1 China
- 12.1.2 Japan
- 12.1.3 India
- 12.1.4 South Korea
- 12.1.5 Southeast Asia
- 12.1.6 Australia
- 12.1.7 Indonesia
- 12.1.8 Phillipes
- 12.1.9 Singapore
- 12.1.10 Thailandc
- 12.1.11 Rest of Asia Pacific
- 13. South America Industrial Internet of Things Market Analysis, Insights and Forecast, 2019-2031
- 13.1. Market Analysis, Insights and Forecast - By Country/Sub-region
- 13.1.1 Brazil
- 13.1.2 Argentina
- 13.1.3 Peru
- 13.1.4 Chile
- 13.1.5 Colombia
- 13.1.6 Ecuador
- 13.1.7 Venezuela
- 13.1.8 Rest of South America
- 14. North America Industrial Internet of Things Market Analysis, Insights and Forecast, 2019-2031
- 14.1. Market Analysis, Insights and Forecast - By Country/Sub-region
- 14.1.1 United States
- 14.1.2 Canada
- 14.1.3 Mexico
- 15. MEA Industrial Internet of Things Market Analysis, Insights and Forecast, 2019-2031
- 15.1. Market Analysis, Insights and Forecast - By Country/Sub-region
- 15.1.1 United Arab Emirates
- 15.1.2 Saudi Arabia
- 15.1.3 South Africa
- 15.1.4 Rest of Middle East and Africa
- 16. Competitive Analysis
- 16.1. Global Market Share Analysis 2024
- 16.2. Company Profiles
- 16.2.1 Honeywell International Inc
- 16.2.1.1. Overview
- 16.2.1.2. Products
- 16.2.1.3. SWOT Analysis
- 16.2.1.4. Recent Developments
- 16.2.1.5. Financials (Based on Availability)
- 16.2.2 NXP Semiconductors NV
- 16.2.2.1. Overview
- 16.2.2.2. Products
- 16.2.2.3. SWOT Analysis
- 16.2.2.4. Recent Developments
- 16.2.2.5. Financials (Based on Availability)
- 16.2.3 IBM Corporation
- 16.2.3.1. Overview
- 16.2.3.2. Products
- 16.2.3.3. SWOT Analysis
- 16.2.3.4. Recent Developments
- 16.2.3.5. Financials (Based on Availability)
- 16.2.4 Telefonaktiebolaget LM Ericsson
- 16.2.4.1. Overview
- 16.2.4.2. Products
- 16.2.4.3. SWOT Analysis
- 16.2.4.4. Recent Developments
- 16.2.4.5. Financials (Based on Availability)
- 16.2.5 Fujitsu Ltd
- 16.2.5.1. Overview
- 16.2.5.2. Products
- 16.2.5.3. SWOT Analysis
- 16.2.5.4. Recent Developments
- 16.2.5.5. Financials (Based on Availability)
- 16.2.6 Cypress Semiconductor Corporation
- 16.2.6.1. Overview
- 16.2.6.2. Products
- 16.2.6.3. SWOT Analysis
- 16.2.6.4. Recent Developments
- 16.2.6.5. Financials (Based on Availability)
- 16.2.7 Telit Communications Plc
- 16.2.7.1. Overview
- 16.2.7.2. Products
- 16.2.7.3. SWOT Analysis
- 16.2.7.4. Recent Developments
- 16.2.7.5. Financials (Based on Availability)
- 16.2.8 Emerson Electric Co
- 16.2.8.1. Overview
- 16.2.8.2. Products
- 16.2.8.3. SWOT Analysis
- 16.2.8.4. Recent Developments
- 16.2.8.5. Financials (Based on Availability)
- 16.2.9 Mitsubishi Electric Corporation
- 16.2.9.1. Overview
- 16.2.9.2. Products
- 16.2.9.3. SWOT Analysis
- 16.2.9.4. Recent Developments
- 16.2.9.5. Financials (Based on Availability)
- 16.2.10 Cisco Systems Inc
- 16.2.10.1. Overview
- 16.2.10.2. Products
- 16.2.10.3. SWOT Analysis
- 16.2.10.4. Recent Developments
- 16.2.10.5. Financials (Based on Availability)
- 16.2.11 Siemens AG
- 16.2.11.1. Overview
- 16.2.11.2. Products
- 16.2.11.3. SWOT Analysis
- 16.2.11.4. Recent Developments
- 16.2.11.5. Financials (Based on Availability)
- 16.2.12 Amazon Web Services Inc
- 16.2.12.1. Overview
- 16.2.12.2. Products
- 16.2.12.3. SWOT Analysis
- 16.2.12.4. Recent Developments
- 16.2.12.5. Financials (Based on Availability)
- 16.2.13 PTC Inc
- 16.2.13.1. Overview
- 16.2.13.2. Products
- 16.2.13.3. SWOT Analysis
- 16.2.13.4. Recent Developments
- 16.2.13.5. Financials (Based on Availability)
- 16.2.14 Robert Bosch GmbH
- 16.2.14.1. Overview
- 16.2.14.2. Products
- 16.2.14.3. SWOT Analysis
- 16.2.14.4. Recent Developments
- 16.2.14.5. Financials (Based on Availability)
- 16.2.15 OMRON Corporation
- 16.2.15.1. Overview
- 16.2.15.2. Products
- 16.2.15.3. SWOT Analysis
- 16.2.15.4. Recent Developments
- 16.2.15.5. Financials (Based on Availability)
- 16.2.16 Oracle Corporation
- 16.2.16.1. Overview
- 16.2.16.2. Products
- 16.2.16.3. SWOT Analysis
- 16.2.16.4. Recent Developments
- 16.2.16.5. Financials (Based on Availability)
- 16.2.17 SAP SE
- 16.2.17.1. Overview
- 16.2.17.2. Products
- 16.2.17.3. SWOT Analysis
- 16.2.17.4. Recent Developments
- 16.2.17.5. Financials (Based on Availability)
- 16.2.18 General Electric Company
- 16.2.18.1. Overview
- 16.2.18.2. Products
- 16.2.18.3. SWOT Analysis
- 16.2.18.4. Recent Developments
- 16.2.18.5. Financials (Based on Availability)
- 16.2.1 Honeywell International Inc
List of Figures
- Figure 1: Global Industrial Internet of Things Market Revenue Breakdown (Million, %) by Region 2024 & 2032
- Figure 2: Global Industrial Internet of Things Market Volume Breakdown (K Unit, %) by Region 2024 & 2032
- Figure 3: North America Industrial Internet of Things Market Revenue (Million), by Country 2024 & 2032
- Figure 4: North America Industrial Internet of Things Market Volume (K Unit), by Country 2024 & 2032
- Figure 5: North America Industrial Internet of Things Market Revenue Share (%), by Country 2024 & 2032
- Figure 6: North America Industrial Internet of Things Market Volume Share (%), by Country 2024 & 2032
- Figure 7: Europe Industrial Internet of Things Market Revenue (Million), by Country 2024 & 2032
- Figure 8: Europe Industrial Internet of Things Market Volume (K Unit), by Country 2024 & 2032
- Figure 9: Europe Industrial Internet of Things Market Revenue Share (%), by Country 2024 & 2032
- Figure 10: Europe Industrial Internet of Things Market Volume Share (%), by Country 2024 & 2032
- Figure 11: Asia Pacific Industrial Internet of Things Market Revenue (Million), by Country 2024 & 2032
- Figure 12: Asia Pacific Industrial Internet of Things Market Volume (K Unit), by Country 2024 & 2032
- Figure 13: Asia Pacific Industrial Internet of Things Market Revenue Share (%), by Country 2024 & 2032
- Figure 14: Asia Pacific Industrial Internet of Things Market Volume Share (%), by Country 2024 & 2032
- Figure 15: South America Industrial Internet of Things Market Revenue (Million), by Country 2024 & 2032
- Figure 16: South America Industrial Internet of Things Market Volume (K Unit), by Country 2024 & 2032
- Figure 17: South America Industrial Internet of Things Market Revenue Share (%), by Country 2024 & 2032
- Figure 18: South America Industrial Internet of Things Market Volume Share (%), by Country 2024 & 2032
- Figure 19: North America Industrial Internet of Things Market Revenue (Million), by Country 2024 & 2032
- Figure 20: North America Industrial Internet of Things Market Volume (K Unit), by Country 2024 & 2032
- Figure 21: North America Industrial Internet of Things Market Revenue Share (%), by Country 2024 & 2032
- Figure 22: North America Industrial Internet of Things Market Volume Share (%), by Country 2024 & 2032
- Figure 23: MEA Industrial Internet of Things Market Revenue (Million), by Country 2024 & 2032
- Figure 24: MEA Industrial Internet of Things Market Volume (K Unit), by Country 2024 & 2032
- Figure 25: MEA Industrial Internet of Things Market Revenue Share (%), by Country 2024 & 2032
- Figure 26: MEA Industrial Internet of Things Market Volume Share (%), by Country 2024 & 2032
- Figure 27: North America Industrial Internet of Things Market Revenue (Million), by Type 2024 & 2032
- Figure 28: North America Industrial Internet of Things Market Volume (K Unit), by Type 2024 & 2032
- Figure 29: North America Industrial Internet of Things Market Revenue Share (%), by Type 2024 & 2032
- Figure 30: North America Industrial Internet of Things Market Volume Share (%), by Type 2024 & 2032
- Figure 31: North America Industrial Internet of Things Market Revenue (Million), by End-user Vertical 2024 & 2032
- Figure 32: North America Industrial Internet of Things Market Volume (K Unit), by End-user Vertical 2024 & 2032
- Figure 33: North America Industrial Internet of Things Market Revenue Share (%), by End-user Vertical 2024 & 2032
- Figure 34: North America Industrial Internet of Things Market Volume Share (%), by End-user Vertical 2024 & 2032
- Figure 35: North America Industrial Internet of Things Market Revenue (Million), by Country 2024 & 2032
- Figure 36: North America Industrial Internet of Things Market Volume (K Unit), by Country 2024 & 2032
- Figure 37: North America Industrial Internet of Things Market Revenue Share (%), by Country 2024 & 2032
- Figure 38: North America Industrial Internet of Things Market Volume Share (%), by Country 2024 & 2032
- Figure 39: Europe Industrial Internet of Things Market Revenue (Million), by Type 2024 & 2032
- Figure 40: Europe Industrial Internet of Things Market Volume (K Unit), by Type 2024 & 2032
- Figure 41: Europe Industrial Internet of Things Market Revenue Share (%), by Type 2024 & 2032
- Figure 42: Europe Industrial Internet of Things Market Volume Share (%), by Type 2024 & 2032
- Figure 43: Europe Industrial Internet of Things Market Revenue (Million), by End-user Vertical 2024 & 2032
- Figure 44: Europe Industrial Internet of Things Market Volume (K Unit), by End-user Vertical 2024 & 2032
- Figure 45: Europe Industrial Internet of Things Market Revenue Share (%), by End-user Vertical 2024 & 2032
- Figure 46: Europe Industrial Internet of Things Market Volume Share (%), by End-user Vertical 2024 & 2032
- Figure 47: Europe Industrial Internet of Things Market Revenue (Million), by Country 2024 & 2032
- Figure 48: Europe Industrial Internet of Things Market Volume (K Unit), by Country 2024 & 2032
- Figure 49: Europe Industrial Internet of Things Market Revenue Share (%), by Country 2024 & 2032
- Figure 50: Europe Industrial Internet of Things Market Volume Share (%), by Country 2024 & 2032
- Figure 51: Asia Pacific Industrial Internet of Things Market Revenue (Million), by Type 2024 & 2032
- Figure 52: Asia Pacific Industrial Internet of Things Market Volume (K Unit), by Type 2024 & 2032
- Figure 53: Asia Pacific Industrial Internet of Things Market Revenue Share (%), by Type 2024 & 2032
- Figure 54: Asia Pacific Industrial Internet of Things Market Volume Share (%), by Type 2024 & 2032
- Figure 55: Asia Pacific Industrial Internet of Things Market Revenue (Million), by End-user Vertical 2024 & 2032
- Figure 56: Asia Pacific Industrial Internet of Things Market Volume (K Unit), by End-user Vertical 2024 & 2032
- Figure 57: Asia Pacific Industrial Internet of Things Market Revenue Share (%), by End-user Vertical 2024 & 2032
- Figure 58: Asia Pacific Industrial Internet of Things Market Volume Share (%), by End-user Vertical 2024 & 2032
- Figure 59: Asia Pacific Industrial Internet of Things Market Revenue (Million), by Country 2024 & 2032
- Figure 60: Asia Pacific Industrial Internet of Things Market Volume (K Unit), by Country 2024 & 2032
- Figure 61: Asia Pacific Industrial Internet of Things Market Revenue Share (%), by Country 2024 & 2032
- Figure 62: Asia Pacific Industrial Internet of Things Market Volume Share (%), by Country 2024 & 2032
- Figure 63: Rest of the World Industrial Internet of Things Market Revenue (Million), by Type 2024 & 2032
- Figure 64: Rest of the World Industrial Internet of Things Market Volume (K Unit), by Type 2024 & 2032
- Figure 65: Rest of the World Industrial Internet of Things Market Revenue Share (%), by Type 2024 & 2032
- Figure 66: Rest of the World Industrial Internet of Things Market Volume Share (%), by Type 2024 & 2032
- Figure 67: Rest of the World Industrial Internet of Things Market Revenue (Million), by End-user Vertical 2024 & 2032
- Figure 68: Rest of the World Industrial Internet of Things Market Volume (K Unit), by End-user Vertical 2024 & 2032
- Figure 69: Rest of the World Industrial Internet of Things Market Revenue Share (%), by End-user Vertical 2024 & 2032
- Figure 70: Rest of the World Industrial Internet of Things Market Volume Share (%), by End-user Vertical 2024 & 2032
- Figure 71: Rest of the World Industrial Internet of Things Market Revenue (Million), by Country 2024 & 2032
- Figure 72: Rest of the World Industrial Internet of Things Market Volume (K Unit), by Country 2024 & 2032
- Figure 73: Rest of the World Industrial Internet of Things Market Revenue Share (%), by Country 2024 & 2032
- Figure 74: Rest of the World Industrial Internet of Things Market Volume Share (%), by Country 2024 & 2032
List of Tables
- Table 1: Global Industrial Internet of Things Market Revenue Million Forecast, by Region 2019 & 2032
- Table 2: Global Industrial Internet of Things Market Volume K Unit Forecast, by Region 2019 & 2032
- Table 3: Global Industrial Internet of Things Market Revenue Million Forecast, by Type 2019 & 2032
- Table 4: Global Industrial Internet of Things Market Volume K Unit Forecast, by Type 2019 & 2032
- Table 5: Global Industrial Internet of Things Market Revenue Million Forecast, by End-user Vertical 2019 & 2032
- Table 6: Global Industrial Internet of Things Market Volume K Unit Forecast, by End-user Vertical 2019 & 2032
- Table 7: Global Industrial Internet of Things Market Revenue Million Forecast, by Region 2019 & 2032
- Table 8: Global Industrial Internet of Things Market Volume K Unit Forecast, by Region 2019 & 2032
- Table 9: Global Industrial Internet of Things Market Revenue Million Forecast, by Country 2019 & 2032
- Table 10: Global Industrial Internet of Things Market Volume K Unit Forecast, by Country 2019 & 2032
- Table 11: United States Industrial Internet of Things Market Revenue (Million) Forecast, by Application 2019 & 2032
- Table 12: United States Industrial Internet of Things Market Volume (K Unit) Forecast, by Application 2019 & 2032
- Table 13: Canada Industrial Internet of Things Market Revenue (Million) Forecast, by Application 2019 & 2032
- Table 14: Canada Industrial Internet of Things Market Volume (K Unit) Forecast, by Application 2019 & 2032
- Table 15: Mexico Industrial Internet of Things Market Revenue (Million) Forecast, by Application 2019 & 2032
- Table 16: Mexico Industrial Internet of Things Market Volume (K Unit) Forecast, by Application 2019 & 2032
- Table 17: Global Industrial Internet of Things Market Revenue Million Forecast, by Country 2019 & 2032
- Table 18: Global Industrial Internet of Things Market Volume K Unit Forecast, by Country 2019 & 2032
- Table 19: Germany Industrial Internet of Things Market Revenue (Million) Forecast, by Application 2019 & 2032
- Table 20: Germany Industrial Internet of Things Market Volume (K Unit) Forecast, by Application 2019 & 2032
- Table 21: United Kingdom Industrial Internet of Things Market Revenue (Million) Forecast, by Application 2019 & 2032
- Table 22: United Kingdom Industrial Internet of Things Market Volume (K Unit) Forecast, by Application 2019 & 2032
- Table 23: France Industrial Internet of Things Market Revenue (Million) Forecast, by Application 2019 & 2032
- Table 24: France Industrial Internet of Things Market Volume (K Unit) Forecast, by Application 2019 & 2032
- Table 25: Spain Industrial Internet of Things Market Revenue (Million) Forecast, by Application 2019 & 2032
- Table 26: Spain Industrial Internet of Things Market Volume (K Unit) Forecast, by Application 2019 & 2032
- Table 27: Italy Industrial Internet of Things Market Revenue (Million) Forecast, by Application 2019 & 2032
- Table 28: Italy Industrial Internet of Things Market Volume (K Unit) Forecast, by Application 2019 & 2032
- Table 29: Spain Industrial Internet of Things Market Revenue (Million) Forecast, by Application 2019 & 2032
- Table 30: Spain Industrial Internet of Things Market Volume (K Unit) Forecast, by Application 2019 & 2032
- Table 31: Belgium Industrial Internet of Things Market Revenue (Million) Forecast, by Application 2019 & 2032
- Table 32: Belgium Industrial Internet of Things Market Volume (K Unit) Forecast, by Application 2019 & 2032
- Table 33: Netherland Industrial Internet of Things Market Revenue (Million) Forecast, by Application 2019 & 2032
- Table 34: Netherland Industrial Internet of Things Market Volume (K Unit) Forecast, by Application 2019 & 2032
- Table 35: Nordics Industrial Internet of Things Market Revenue (Million) Forecast, by Application 2019 & 2032
- Table 36: Nordics Industrial Internet of Things Market Volume (K Unit) Forecast, by Application 2019 & 2032
- Table 37: Rest of Europe Industrial Internet of Things Market Revenue (Million) Forecast, by Application 2019 & 2032
- Table 38: Rest of Europe Industrial Internet of Things Market Volume (K Unit) Forecast, by Application 2019 & 2032
- Table 39: Global Industrial Internet of Things Market Revenue Million Forecast, by Country 2019 & 2032
- Table 40: Global Industrial Internet of Things Market Volume K Unit Forecast, by Country 2019 & 2032
- Table 41: China Industrial Internet of Things Market Revenue (Million) Forecast, by Application 2019 & 2032
- Table 42: China Industrial Internet of Things Market Volume (K Unit) Forecast, by Application 2019 & 2032
- Table 43: Japan Industrial Internet of Things Market Revenue (Million) Forecast, by Application 2019 & 2032
- Table 44: Japan Industrial Internet of Things Market Volume (K Unit) Forecast, by Application 2019 & 2032
- Table 45: India Industrial Internet of Things Market Revenue (Million) Forecast, by Application 2019 & 2032
- Table 46: India Industrial Internet of Things Market Volume (K Unit) Forecast, by Application 2019 & 2032
- Table 47: South Korea Industrial Internet of Things Market Revenue (Million) Forecast, by Application 2019 & 2032
- Table 48: South Korea Industrial Internet of Things Market Volume (K Unit) Forecast, by Application 2019 & 2032
- Table 49: Southeast Asia Industrial Internet of Things Market Revenue (Million) Forecast, by Application 2019 & 2032
- Table 50: Southeast Asia Industrial Internet of Things Market Volume (K Unit) Forecast, by Application 2019 & 2032
- Table 51: Australia Industrial Internet of Things Market Revenue (Million) Forecast, by Application 2019 & 2032
- Table 52: Australia Industrial Internet of Things Market Volume (K Unit) Forecast, by Application 2019 & 2032
- Table 53: Indonesia Industrial Internet of Things Market Revenue (Million) Forecast, by Application 2019 & 2032
- Table 54: Indonesia Industrial Internet of Things Market Volume (K Unit) Forecast, by Application 2019 & 2032
- Table 55: Phillipes Industrial Internet of Things Market Revenue (Million) Forecast, by Application 2019 & 2032
- Table 56: Phillipes Industrial Internet of Things Market Volume (K Unit) Forecast, by Application 2019 & 2032
- Table 57: Singapore Industrial Internet of Things Market Revenue (Million) Forecast, by Application 2019 & 2032
- Table 58: Singapore Industrial Internet of Things Market Volume (K Unit) Forecast, by Application 2019 & 2032
- Table 59: Thailandc Industrial Internet of Things Market Revenue (Million) Forecast, by Application 2019 & 2032
- Table 60: Thailandc Industrial Internet of Things Market Volume (K Unit) Forecast, by Application 2019 & 2032
- Table 61: Rest of Asia Pacific Industrial Internet of Things Market Revenue (Million) Forecast, by Application 2019 & 2032
- Table 62: Rest of Asia Pacific Industrial Internet of Things Market Volume (K Unit) Forecast, by Application 2019 & 2032
- Table 63: Global Industrial Internet of Things Market Revenue Million Forecast, by Country 2019 & 2032
- Table 64: Global Industrial Internet of Things Market Volume K Unit Forecast, by Country 2019 & 2032
- Table 65: Brazil Industrial Internet of Things Market Revenue (Million) Forecast, by Application 2019 & 2032
- Table 66: Brazil Industrial Internet of Things Market Volume (K Unit) Forecast, by Application 2019 & 2032
- Table 67: Argentina Industrial Internet of Things Market Revenue (Million) Forecast, by Application 2019 & 2032
- Table 68: Argentina Industrial Internet of Things Market Volume (K Unit) Forecast, by Application 2019 & 2032
- Table 69: Peru Industrial Internet of Things Market Revenue (Million) Forecast, by Application 2019 & 2032
- Table 70: Peru Industrial Internet of Things Market Volume (K Unit) Forecast, by Application 2019 & 2032
- Table 71: Chile Industrial Internet of Things Market Revenue (Million) Forecast, by Application 2019 & 2032
- Table 72: Chile Industrial Internet of Things Market Volume (K Unit) Forecast, by Application 2019 & 2032
- Table 73: Colombia Industrial Internet of Things Market Revenue (Million) Forecast, by Application 2019 & 2032
- Table 74: Colombia Industrial Internet of Things Market Volume (K Unit) Forecast, by Application 2019 & 2032
- Table 75: Ecuador Industrial Internet of Things Market Revenue (Million) Forecast, by Application 2019 & 2032
- Table 76: Ecuador Industrial Internet of Things Market Volume (K Unit) Forecast, by Application 2019 & 2032
- Table 77: Venezuela Industrial Internet of Things Market Revenue (Million) Forecast, by Application 2019 & 2032
- Table 78: Venezuela Industrial Internet of Things Market Volume (K Unit) Forecast, by Application 2019 & 2032
- Table 79: Rest of South America Industrial Internet of Things Market Revenue (Million) Forecast, by Application 2019 & 2032
- Table 80: Rest of South America Industrial Internet of Things Market Volume (K Unit) Forecast, by Application 2019 & 2032
- Table 81: Global Industrial Internet of Things Market Revenue Million Forecast, by Country 2019 & 2032
- Table 82: Global Industrial Internet of Things Market Volume K Unit Forecast, by Country 2019 & 2032
- Table 83: United States Industrial Internet of Things Market Revenue (Million) Forecast, by Application 2019 & 2032
- Table 84: United States Industrial Internet of Things Market Volume (K Unit) Forecast, by Application 2019 & 2032
- Table 85: Canada Industrial Internet of Things Market Revenue (Million) Forecast, by Application 2019 & 2032
- Table 86: Canada Industrial Internet of Things Market Volume (K Unit) Forecast, by Application 2019 & 2032
- Table 87: Mexico Industrial Internet of Things Market Revenue (Million) Forecast, by Application 2019 & 2032
- Table 88: Mexico Industrial Internet of Things Market Volume (K Unit) Forecast, by Application 2019 & 2032
- Table 89: Global Industrial Internet of Things Market Revenue Million Forecast, by Country 2019 & 2032
- Table 90: Global Industrial Internet of Things Market Volume K Unit Forecast, by Country 2019 & 2032
- Table 91: United Arab Emirates Industrial Internet of Things Market Revenue (Million) Forecast, by Application 2019 & 2032
- Table 92: United Arab Emirates Industrial Internet of Things Market Volume (K Unit) Forecast, by Application 2019 & 2032
- Table 93: Saudi Arabia Industrial Internet of Things Market Revenue (Million) Forecast, by Application 2019 & 2032
- Table 94: Saudi Arabia Industrial Internet of Things Market Volume (K Unit) Forecast, by Application 2019 & 2032
- Table 95: South Africa Industrial Internet of Things Market Revenue (Million) Forecast, by Application 2019 & 2032
- Table 96: South Africa Industrial Internet of Things Market Volume (K Unit) Forecast, by Application 2019 & 2032
- Table 97: Rest of Middle East and Africa Industrial Internet of Things Market Revenue (Million) Forecast, by Application 2019 & 2032
- Table 98: Rest of Middle East and Africa Industrial Internet of Things Market Volume (K Unit) Forecast, by Application 2019 & 2032
- Table 99: Global Industrial Internet of Things Market Revenue Million Forecast, by Type 2019 & 2032
- Table 100: Global Industrial Internet of Things Market Volume K Unit Forecast, by Type 2019 & 2032
- Table 101: Global Industrial Internet of Things Market Revenue Million Forecast, by End-user Vertical 2019 & 2032
- Table 102: Global Industrial Internet of Things Market Volume K Unit Forecast, by End-user Vertical 2019 & 2032
- Table 103: Global Industrial Internet of Things Market Revenue Million Forecast, by Country 2019 & 2032
- Table 104: Global Industrial Internet of Things Market Volume K Unit Forecast, by Country 2019 & 2032
- Table 105: Global Industrial Internet of Things Market Revenue Million Forecast, by Type 2019 & 2032
- Table 106: Global Industrial Internet of Things Market Volume K Unit Forecast, by Type 2019 & 2032
- Table 107: Global Industrial Internet of Things Market Revenue Million Forecast, by End-user Vertical 2019 & 2032
- Table 108: Global Industrial Internet of Things Market Volume K Unit Forecast, by End-user Vertical 2019 & 2032
- Table 109: Global Industrial Internet of Things Market Revenue Million Forecast, by Country 2019 & 2032
- Table 110: Global Industrial Internet of Things Market Volume K Unit Forecast, by Country 2019 & 2032
- Table 111: Global Industrial Internet of Things Market Revenue Million Forecast, by Type 2019 & 2032
- Table 112: Global Industrial Internet of Things Market Volume K Unit Forecast, by Type 2019 & 2032
- Table 113: Global Industrial Internet of Things Market Revenue Million Forecast, by End-user Vertical 2019 & 2032
- Table 114: Global Industrial Internet of Things Market Volume K Unit Forecast, by End-user Vertical 2019 & 2032
- Table 115: Global Industrial Internet of Things Market Revenue Million Forecast, by Country 2019 & 2032
- Table 116: Global Industrial Internet of Things Market Volume K Unit Forecast, by Country 2019 & 2032
- Table 117: Global Industrial Internet of Things Market Revenue Million Forecast, by Type 2019 & 2032
- Table 118: Global Industrial Internet of Things Market Volume K Unit Forecast, by Type 2019 & 2032
- Table 119: Global Industrial Internet of Things Market Revenue Million Forecast, by End-user Vertical 2019 & 2032
- Table 120: Global Industrial Internet of Things Market Volume K Unit Forecast, by End-user Vertical 2019 & 2032
- Table 121: Global Industrial Internet of Things Market Revenue Million Forecast, by Country 2019 & 2032
- Table 122: Global Industrial Internet of Things Market Volume K Unit Forecast, by Country 2019 & 2032
Frequently Asked Questions
1. What is the projected Compound Annual Growth Rate (CAGR) of the Industrial Internet of Things Market?
The projected CAGR is approximately 34.41%.
2. Which companies are prominent players in the Industrial Internet of Things Market?
Key companies in the market include Honeywell International Inc, NXP Semiconductors NV, IBM Corporation, Telefonaktiebolaget LM Ericsson, Fujitsu Ltd, Cypress Semiconductor Corporation, Telit Communications Plc, Emerson Electric Co, Mitsubishi Electric Corporation, Cisco Systems Inc, Siemens AG, Amazon Web Services Inc, PTC Inc, Robert Bosch GmbH, OMRON Corporation, Oracle Corporation, SAP SE, General Electric Company.
3. What are the main segments of the Industrial Internet of Things Market?
The market segments include Type, End-user Vertical.
4. Can you provide details about the market size?
The market size is estimated to be USD 114.68 Million as of 2022.
5. What are some drivers contributing to market growth?
Proliferation of digitization and adoption of sensors in plants; Growing demand for automated and efficient process.
6. What are the notable trends driving market growth?
Manufacturing to Hold Major Market Share.
7. Are there any restraints impacting market growth?
Issues Related to Security and Privacy of Data and Connectivity of Devices and Interoperability.
8. Can you provide examples of recent developments in the market?
February 2023: Cisco, a multinational digital communications technology conglomerate corporation, added new products to its suite of cloud tools to provide further visibility and control over networks. The new cloud management tools are designed for industrial IoT (IIoT) apps to simplify IT and OT operations dashboards and provide flexible network intelligence for industrial assets. The options will be made available through Cisco's IoT Operations Dashboard.
9. What pricing options are available for accessing the report?
Pricing options include single-user, multi-user, and enterprise licenses priced at USD 4750, USD 5250, and USD 8750 respectively.
10. Is the market size provided in terms of value or volume?
The market size is provided in terms of value, measured in Million and volume, measured in K Unit.
11. Are there any specific market keywords associated with the report?
Yes, the market keyword associated with the report is "Industrial Internet of Things Market," which aids in identifying and referencing the specific market segment covered.
12. How do I determine which pricing option suits my needs best?
The pricing options vary based on user requirements and access needs. Individual users may opt for single-user licenses, while businesses requiring broader access may choose multi-user or enterprise licenses for cost-effective access to the report.
13. Are there any additional resources or data provided in the Industrial Internet of Things Market report?
While the report offers comprehensive insights, it's advisable to review the specific contents or supplementary materials provided to ascertain if additional resources or data are available.
14. How can I stay updated on further developments or reports in the Industrial Internet of Things Market?
To stay informed about further developments, trends, and reports in the Industrial Internet of Things Market, consider subscribing to industry newsletters, following relevant companies and organizations, or regularly checking reputable industry news sources and publications.
Methodology
Step 1 - Identification of Relevant Samples Size from Population Database


Step 2 - Approaches for Defining Global Market Size (Value, Volume* & Price*)

Note*: In applicable scenarios
Step 3 - Data Sources
Primary Research
- Web Analytics
- Survey Reports
- Research Institute
- Latest Research Reports
- Opinion Leaders
Secondary Research
- Annual Reports
- White Paper
- Latest Press Release
- Industry Association
- Paid Database
- Investor Presentations

Step 4 - Data Triangulation
Involves using different sources of information in order to increase the validity of a study
These sources are likely to be stakeholders in a program - participants, other researchers, program staff, other community members, and so on.
Then we put all data in single framework & apply various statistical tools to find out the dynamic on the market.
During the analysis stage, feedback from the stakeholder groups would be compared to determine areas of agreement as well as areas of divergence


