
Key Insights
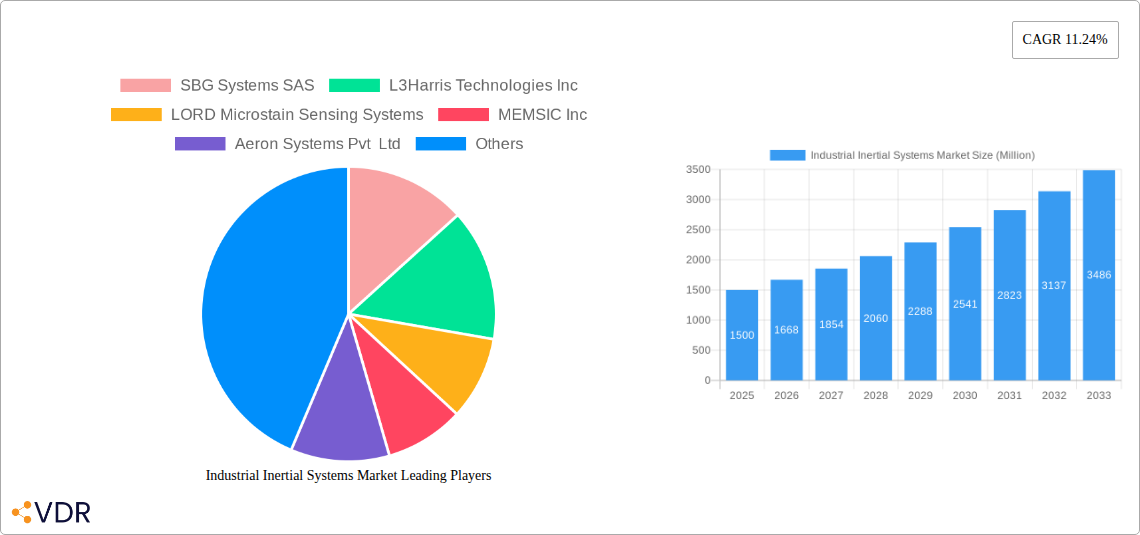
The Industrial Inertial Systems market is experiencing robust growth, projected to reach a substantial market value with a Compound Annual Growth Rate (CAGR) of 11.24% between 2025 and 2033. This expansion is fueled by several key drivers. The increasing automation across various industrial sectors, including manufacturing, logistics, and energy, necessitates precise navigation and positioning systems, driving demand for inertial systems. Furthermore, advancements in sensor technology, particularly in miniaturization and improved accuracy, are making these systems more cost-effective and versatile. Growing adoption of autonomous vehicles and robots across industries is significantly boosting market growth. The development of sophisticated GPS/INS integrated systems that offer superior performance in challenging environments (e.g., GPS-denied areas) further contributes to the market's expansion. However, high initial investment costs associated with implementing these systems and the potential for sensor drift or errors can pose challenges to wider adoption. Segmentation analysis reveals a significant contribution from the aerospace and defense sectors, driven by stringent requirements for precise navigation and guidance systems. The industrial OEM segment is also witnessing significant growth due to increasing integration of inertial systems into advanced machinery.
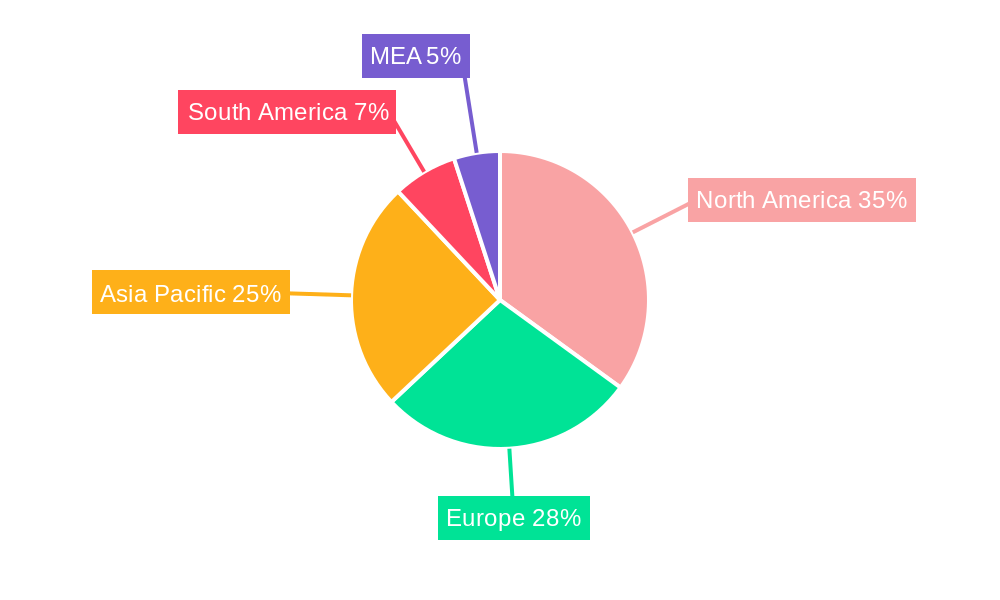
The geographic distribution of the market reveals strong growth in North America and Asia-Pacific regions. North America benefits from a mature industrial sector and robust technological advancements. The Asia-Pacific region, particularly China and India, experiences rapid growth due to substantial investments in infrastructure development and rising industrial output. Europe also holds a significant market share, driven by the presence of key players and a focus on automation in various industries. Competition in the market is intense, with both established players and emerging companies vying for market share. Key players focus on product innovation, strategic partnerships, and geographic expansion to maintain competitiveness. Future market growth will largely depend on continued technological advancements, cost reductions, and increasing integration of inertial systems into a wider range of industrial applications. The increasing emphasis on data analytics and the development of integrated sensor fusion systems are also expected to significantly influence the market's trajectory in the coming years.
Industrial Inertial Systems Market: A Comprehensive Report (2019-2033)
This in-depth report provides a comprehensive analysis of the Industrial Inertial Systems market, encompassing market dynamics, growth trends, regional insights, product landscape, key players, and future outlook. The report covers the parent market of inertial navigation systems and delves into the child market of industrial inertial systems, offering a granular perspective on this critical technology sector. The study period spans 2019-2033, with 2025 as the base and estimated year, and a forecast period of 2025-2033. The historical period analyzed is 2019-2024. The total market size is projected to reach xx Million by 2033.
Industrial Inertial Systems Market Dynamics & Structure
The Industrial Inertial Systems market exhibits a moderately consolidated structure, with key players holding significant market share. Technological innovation, particularly in MEMS (Microelectromechanical Systems) technology and advanced algorithms, is a primary growth driver. Stringent regulatory frameworks concerning safety and precision in various industries (e.g., aviation, defense) influence market dynamics. Competitive substitutes, like GPS-only systems, exist but often lack the precision and reliability of inertial systems, especially in challenging environments. The end-user demographics are diverse, spanning industrial OEMs, defense, energy, transportation, and civil aviation sectors. M&A activity has been moderate, with approximately xx deals recorded in the past five years, primarily focusing on acquiring specialized technology or expanding geographic reach.
- Market Concentration: Moderately consolidated, with top 5 players holding approximately xx% market share in 2024.
- Technological Innovation: MEMS technology advancements and improved algorithm accuracy are key drivers.
- Regulatory Landscape: Stringent safety regulations in aerospace and defense sectors impact market growth.
- Competitive Substitutes: GPS-only systems offer lower cost but reduced precision.
- End-User Demographics: Diverse across industrial OEM, defense, energy, transport, and civil aviation.
- M&A Activity: Approximately xx deals in the past five years, focusing on technology acquisition and geographic expansion.
Industrial Inertial Systems Market Growth Trends & Insights
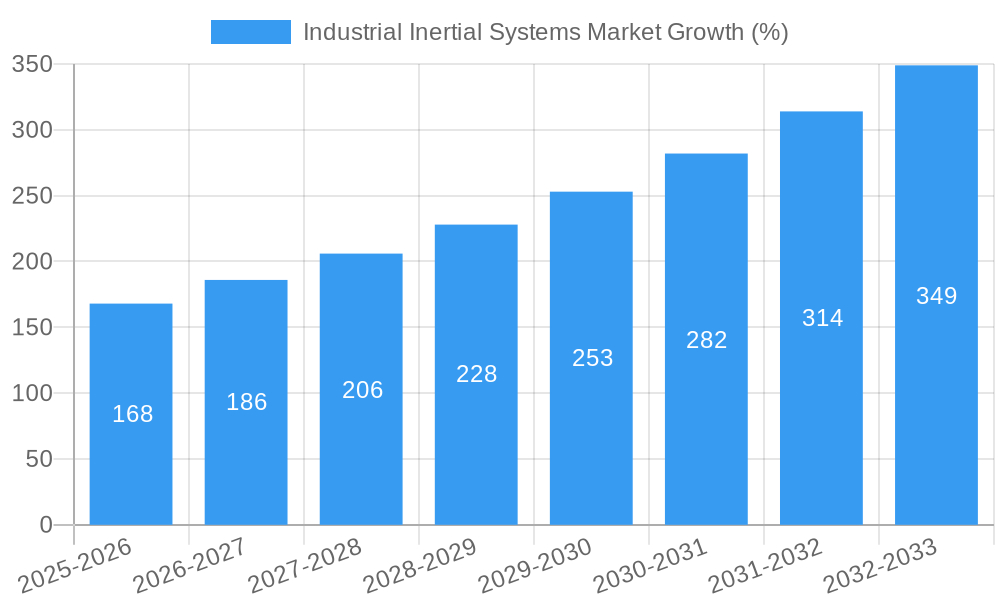
The Industrial Inertial Systems market experienced robust growth during the historical period (2019-2024), driven by increasing demand across various sectors. The market size was valued at xx Million in 2024 and is projected to reach xx Million by 2033, exhibiting a CAGR of xx% during the forecast period (2025-2033). This growth is fueled by factors like the increasing adoption of automation in industrial processes, the growth of the defense sector, and the rising demand for high-precision navigation and positioning systems in various applications. Technological disruptions, such as the miniaturization of inertial sensors and the development of more robust and reliable systems, are further accelerating market growth. Shifts in consumer behavior, particularly toward enhanced safety and efficiency, are also driving demand. Market penetration is expected to increase significantly across various applications over the forecast period.
Dominant Regions, Countries, or Segments in Industrial Inertial Systems Market
North America currently dominates the Industrial Inertial Systems market, followed by Europe and Asia-Pacific. Within the equipment segment, Inertial Measurement Units (IMUs) hold the largest market share, driven by their versatility and wide application across industries. In terms of applications, the aerospace and defense sectors are major contributors, owing to the high demand for precision navigation and guidance systems. The Industrial OEM end-user industry also exhibits significant growth potential due to increasing automation in manufacturing and industrial processes.
- Leading Region: North America (xx% market share in 2024).
- Dominant Equipment Segment: Inertial Measurement Units (IMUs).
- Key Application Sectors: Aerospace and Defense.
- High-Growth End-user Industry: Industrial OEMs.
- Growth Drivers: Increasing automation, robust defense spending, and demand for high-precision navigation.
Industrial Inertial Systems Market Product Landscape
The Industrial Inertial Systems market offers a range of products, including gyroscopes, accelerometers, IMUs, GPS/INS integrated systems, and multi-axis sensors. Recent innovations focus on enhanced precision, miniaturization, lower power consumption, and improved robustness. These advancements enable the integration of inertial systems into a wider range of applications, including smaller, more mobile devices and harsh environments. Unique selling propositions often center on superior accuracy, reliability, and cost-effectiveness compared to alternative navigation technologies. The development of advanced algorithms and sensor fusion techniques continues to drive product innovation.
Key Drivers, Barriers & Challenges in Industrial Inertial Systems Market
Key Drivers:
The increasing demand for precise positioning and navigation across various industries is a primary driver. Technological advancements, particularly in MEMS technology, are enabling smaller, lighter, and more cost-effective inertial systems. Government initiatives and investments in defense and infrastructure projects are also stimulating market growth.
Key Challenges & Restraints:
High initial investment costs can hinder adoption in some sectors. Supply chain disruptions can impact production and availability. Stringent regulatory compliance requirements add to the complexity of market entry. Intense competition from established players and emerging technologies poses a challenge.
Emerging Opportunities in Industrial Inertial Systems Market
Emerging opportunities exist in the integration of inertial systems with other sensor technologies (e.g., LiDAR, vision systems) for enhanced situational awareness. The development of inertial systems for autonomous vehicles and robotics presents significant growth potential. Unmet needs in the subsea and extreme environment applications offer further avenues for market expansion. Expanding into developing economies with burgeoning infrastructure projects offers significant growth potential.
Growth Accelerators in the Industrial Inertial Systems Market Industry
Technological breakthroughs in sensor miniaturization and fusion algorithms are critical growth accelerators. Strategic partnerships and collaborations between inertial system manufacturers and end-user industries are facilitating innovation and market penetration. Expansion into new application areas, such as autonomous vehicles and robotics, is driving long-term growth.
Key Players Shaping the Industrial Inertial Systems Market Market
- SBG Systems SAS
- L3Harris Technologies Inc
- LORD Microstain Sensing Systems
- MEMSIC Inc
- Aeron Systems Pvt Ltd
- Safran SA
- Systron Donner Inertial Inc
- Trimble Inc
- Vectornav Technologies LLC
- Ixblue SAS
Notable Milestones in Industrial Inertial Systems Market Sector
- 2021-Q4: SBG Systems SAS launched a new high-precision IMU.
- 2022-Q2: L3Harris Technologies Inc. acquired a smaller inertial sensor manufacturer.
- 2023-Q1: MEMSIC Inc. introduced a new low-power MEMS gyroscope. (Further milestones need to be added as they occur)
In-Depth Industrial Inertial Systems Market Market Outlook
The Industrial Inertial Systems market is poised for sustained growth, driven by continuous technological advancements, increasing demand across diverse sectors, and strategic partnerships. The focus on miniaturization, improved accuracy, and lower power consumption will further expand the market's reach. Strategic acquisitions and collaborations will reshape the competitive landscape, driving innovation and market expansion. The market presents significant opportunities for players focusing on emerging applications and developing regions.
Industrial Inertial Systems Market Segmentation
-
1. Equipment
- 1.1. Gyroscopes
- 1.2. Accelerometers
- 1.3. Inertial Measurement Units
- 1.4. GPS/INS
- 1.5. Multi-Axis Sensors
-
2. Application
- 2.1. Aerospace
- 2.2. Land
- 2.3. Marine
- 2.4. Subsea
-
3. End-user Industry
- 3.1. Industrial OEM
- 3.2. Defense
- 3.3. Energy & Infrastructure
- 3.4. Transportation
- 3.5. Civil Aviation
Industrial Inertial Systems Market Segmentation By Geography
- 1. North America
- 2. Europe
- 3. Asia Pacific
- 4. Rest of the World
Industrial Inertial Systems Market REPORT HIGHLIGHTS
| Aspects | Details |
|---|---|
| Study Period | 2019-2033 |
| Base Year | 2024 |
| Estimated Year | 2025 |
| Forecast Period | 2025-2033 |
| Historical Period | 2019-2024 |
| Growth Rate | CAGR of 11.24% from 2019-2033 |
| Segmentation |
|
Table of Contents
- 1. Introduction
- 1.1. Research Scope
- 1.2. Market Segmentation
- 1.3. Research Methodology
- 1.4. Definitions and Assumptions
- 2. Executive Summary
- 2.1. Introduction
- 3. Market Dynamics
- 3.1. Introduction
- 3.2. Market Drivers
- 3.2.1. ; Rapid Rise of Unmanned Vehicles in Both Defense and Civilian Applications; Technological Advancement Enabling More Effective Components at a Smaller and Lighter Size
- 3.3. Market Restrains
- 3.3.1. ; Integration Drift Error is a Major Concern in Navigation Systems
- 3.4. Market Trends
- 3.4.1. Inertial Measurement Units are Expected to Hold Significant Share
- 4. Market Factor Analysis
- 4.1. Porters Five Forces
- 4.2. Supply/Value Chain
- 4.3. PESTEL analysis
- 4.4. Market Entropy
- 4.5. Patent/Trademark Analysis
- 5. Global Industrial Inertial Systems Market Analysis, Insights and Forecast, 2019-2031
- 5.1. Market Analysis, Insights and Forecast - by Equipment
- 5.1.1. Gyroscopes
- 5.1.2. Accelerometers
- 5.1.3. Inertial Measurement Units
- 5.1.4. GPS/INS
- 5.1.5. Multi-Axis Sensors
- 5.2. Market Analysis, Insights and Forecast - by Application
- 5.2.1. Aerospace
- 5.2.2. Land
- 5.2.3. Marine
- 5.2.4. Subsea
- 5.3. Market Analysis, Insights and Forecast - by End-user Industry
- 5.3.1. Industrial OEM
- 5.3.2. Defense
- 5.3.3. Energy & Infrastructure
- 5.3.4. Transportation
- 5.3.5. Civil Aviation
- 5.4. Market Analysis, Insights and Forecast - by Region
- 5.4.1. North America
- 5.4.2. Europe
- 5.4.3. Asia Pacific
- 5.4.4. Rest of the World
- 5.1. Market Analysis, Insights and Forecast - by Equipment
- 6. North America Industrial Inertial Systems Market Analysis, Insights and Forecast, 2019-2031
- 6.1. Market Analysis, Insights and Forecast - by Equipment
- 6.1.1. Gyroscopes
- 6.1.2. Accelerometers
- 6.1.3. Inertial Measurement Units
- 6.1.4. GPS/INS
- 6.1.5. Multi-Axis Sensors
- 6.2. Market Analysis, Insights and Forecast - by Application
- 6.2.1. Aerospace
- 6.2.2. Land
- 6.2.3. Marine
- 6.2.4. Subsea
- 6.3. Market Analysis, Insights and Forecast - by End-user Industry
- 6.3.1. Industrial OEM
- 6.3.2. Defense
- 6.3.3. Energy & Infrastructure
- 6.3.4. Transportation
- 6.3.5. Civil Aviation
- 6.1. Market Analysis, Insights and Forecast - by Equipment
- 7. Europe Industrial Inertial Systems Market Analysis, Insights and Forecast, 2019-2031
- 7.1. Market Analysis, Insights and Forecast - by Equipment
- 7.1.1. Gyroscopes
- 7.1.2. Accelerometers
- 7.1.3. Inertial Measurement Units
- 7.1.4. GPS/INS
- 7.1.5. Multi-Axis Sensors
- 7.2. Market Analysis, Insights and Forecast - by Application
- 7.2.1. Aerospace
- 7.2.2. Land
- 7.2.3. Marine
- 7.2.4. Subsea
- 7.3. Market Analysis, Insights and Forecast - by End-user Industry
- 7.3.1. Industrial OEM
- 7.3.2. Defense
- 7.3.3. Energy & Infrastructure
- 7.3.4. Transportation
- 7.3.5. Civil Aviation
- 7.1. Market Analysis, Insights and Forecast - by Equipment
- 8. Asia Pacific Industrial Inertial Systems Market Analysis, Insights and Forecast, 2019-2031
- 8.1. Market Analysis, Insights and Forecast - by Equipment
- 8.1.1. Gyroscopes
- 8.1.2. Accelerometers
- 8.1.3. Inertial Measurement Units
- 8.1.4. GPS/INS
- 8.1.5. Multi-Axis Sensors
- 8.2. Market Analysis, Insights and Forecast - by Application
- 8.2.1. Aerospace
- 8.2.2. Land
- 8.2.3. Marine
- 8.2.4. Subsea
- 8.3. Market Analysis, Insights and Forecast - by End-user Industry
- 8.3.1. Industrial OEM
- 8.3.2. Defense
- 8.3.3. Energy & Infrastructure
- 8.3.4. Transportation
- 8.3.5. Civil Aviation
- 8.1. Market Analysis, Insights and Forecast - by Equipment
- 9. Rest of the World Industrial Inertial Systems Market Analysis, Insights and Forecast, 2019-2031
- 9.1. Market Analysis, Insights and Forecast - by Equipment
- 9.1.1. Gyroscopes
- 9.1.2. Accelerometers
- 9.1.3. Inertial Measurement Units
- 9.1.4. GPS/INS
- 9.1.5. Multi-Axis Sensors
- 9.2. Market Analysis, Insights and Forecast - by Application
- 9.2.1. Aerospace
- 9.2.2. Land
- 9.2.3. Marine
- 9.2.4. Subsea
- 9.3. Market Analysis, Insights and Forecast - by End-user Industry
- 9.3.1. Industrial OEM
- 9.3.2. Defense
- 9.3.3. Energy & Infrastructure
- 9.3.4. Transportation
- 9.3.5. Civil Aviation
- 9.1. Market Analysis, Insights and Forecast - by Equipment
- 10. North America Industrial Inertial Systems Market Analysis, Insights and Forecast, 2019-2031
- 10.1. Market Analysis, Insights and Forecast - By Country/Sub-region
- 10.1.1 United States
- 10.1.2 Canada
- 10.1.3 Mexico
- 11. Europe Industrial Inertial Systems Market Analysis, Insights and Forecast, 2019-2031
- 11.1. Market Analysis, Insights and Forecast - By Country/Sub-region
- 11.1.1 Germany
- 11.1.2 United Kingdom
- 11.1.3 France
- 11.1.4 Spain
- 11.1.5 Italy
- 11.1.6 Spain
- 11.1.7 Belgium
- 11.1.8 Netherland
- 11.1.9 Nordics
- 11.1.10 Rest of Europe
- 12. Asia Pacific Industrial Inertial Systems Market Analysis, Insights and Forecast, 2019-2031
- 12.1. Market Analysis, Insights and Forecast - By Country/Sub-region
- 12.1.1 China
- 12.1.2 Japan
- 12.1.3 India
- 12.1.4 South Korea
- 12.1.5 Southeast Asia
- 12.1.6 Australia
- 12.1.7 Indonesia
- 12.1.8 Phillipes
- 12.1.9 Singapore
- 12.1.10 Thailandc
- 12.1.11 Rest of Asia Pacific
- 13. South America Industrial Inertial Systems Market Analysis, Insights and Forecast, 2019-2031
- 13.1. Market Analysis, Insights and Forecast - By Country/Sub-region
- 13.1.1 Brazil
- 13.1.2 Argentina
- 13.1.3 Peru
- 13.1.4 Chile
- 13.1.5 Colombia
- 13.1.6 Ecuador
- 13.1.7 Venezuela
- 13.1.8 Rest of South America
- 14. North America Industrial Inertial Systems Market Analysis, Insights and Forecast, 2019-2031
- 14.1. Market Analysis, Insights and Forecast - By Country/Sub-region
- 14.1.1 United States
- 14.1.2 Canada
- 14.1.3 Mexico
- 15. MEA Industrial Inertial Systems Market Analysis, Insights and Forecast, 2019-2031
- 15.1. Market Analysis, Insights and Forecast - By Country/Sub-region
- 15.1.1 United Arab Emirates
- 15.1.2 Saudi Arabia
- 15.1.3 South Africa
- 15.1.4 Rest of Middle East and Africa
- 16. Competitive Analysis
- 16.1. Global Market Share Analysis 2024
- 16.2. Company Profiles
- 16.2.1 SBG Systems SAS
- 16.2.1.1. Overview
- 16.2.1.2. Products
- 16.2.1.3. SWOT Analysis
- 16.2.1.4. Recent Developments
- 16.2.1.5. Financials (Based on Availability)
- 16.2.2 L3Harris Technologies Inc
- 16.2.2.1. Overview
- 16.2.2.2. Products
- 16.2.2.3. SWOT Analysis
- 16.2.2.4. Recent Developments
- 16.2.2.5. Financials (Based on Availability)
- 16.2.3 LORD Microstain Sensing Systems
- 16.2.3.1. Overview
- 16.2.3.2. Products
- 16.2.3.3. SWOT Analysis
- 16.2.3.4. Recent Developments
- 16.2.3.5. Financials (Based on Availability)
- 16.2.4 MEMSIC Inc
- 16.2.4.1. Overview
- 16.2.4.2. Products
- 16.2.4.3. SWOT Analysis
- 16.2.4.4. Recent Developments
- 16.2.4.5. Financials (Based on Availability)
- 16.2.5 Aeron Systems Pvt Ltd
- 16.2.5.1. Overview
- 16.2.5.2. Products
- 16.2.5.3. SWOT Analysis
- 16.2.5.4. Recent Developments
- 16.2.5.5. Financials (Based on Availability)
- 16.2.6 Safran SA
- 16.2.6.1. Overview
- 16.2.6.2. Products
- 16.2.6.3. SWOT Analysis
- 16.2.6.4. Recent Developments
- 16.2.6.5. Financials (Based on Availability)
- 16.2.7 Systron Donner Inertial Inc
- 16.2.7.1. Overview
- 16.2.7.2. Products
- 16.2.7.3. SWOT Analysis
- 16.2.7.4. Recent Developments
- 16.2.7.5. Financials (Based on Availability)
- 16.2.8 Trimble Inc
- 16.2.8.1. Overview
- 16.2.8.2. Products
- 16.2.8.3. SWOT Analysis
- 16.2.8.4. Recent Developments
- 16.2.8.5. Financials (Based on Availability)
- 16.2.9 Vectornav Technologies LLC
- 16.2.9.1. Overview
- 16.2.9.2. Products
- 16.2.9.3. SWOT Analysis
- 16.2.9.4. Recent Developments
- 16.2.9.5. Financials (Based on Availability)
- 16.2.10 Ixblue SAS
- 16.2.10.1. Overview
- 16.2.10.2. Products
- 16.2.10.3. SWOT Analysis
- 16.2.10.4. Recent Developments
- 16.2.10.5. Financials (Based on Availability)
- 16.2.1 SBG Systems SAS
List of Figures
- Figure 1: Global Industrial Inertial Systems Market Revenue Breakdown (Million, %) by Region 2024 & 2032
- Figure 2: Global Industrial Inertial Systems Market Volume Breakdown (K Unit, %) by Region 2024 & 2032
- Figure 3: North America Industrial Inertial Systems Market Revenue (Million), by Country 2024 & 2032
- Figure 4: North America Industrial Inertial Systems Market Volume (K Unit), by Country 2024 & 2032
- Figure 5: North America Industrial Inertial Systems Market Revenue Share (%), by Country 2024 & 2032
- Figure 6: North America Industrial Inertial Systems Market Volume Share (%), by Country 2024 & 2032
- Figure 7: Europe Industrial Inertial Systems Market Revenue (Million), by Country 2024 & 2032
- Figure 8: Europe Industrial Inertial Systems Market Volume (K Unit), by Country 2024 & 2032
- Figure 9: Europe Industrial Inertial Systems Market Revenue Share (%), by Country 2024 & 2032
- Figure 10: Europe Industrial Inertial Systems Market Volume Share (%), by Country 2024 & 2032
- Figure 11: Asia Pacific Industrial Inertial Systems Market Revenue (Million), by Country 2024 & 2032
- Figure 12: Asia Pacific Industrial Inertial Systems Market Volume (K Unit), by Country 2024 & 2032
- Figure 13: Asia Pacific Industrial Inertial Systems Market Revenue Share (%), by Country 2024 & 2032
- Figure 14: Asia Pacific Industrial Inertial Systems Market Volume Share (%), by Country 2024 & 2032
- Figure 15: South America Industrial Inertial Systems Market Revenue (Million), by Country 2024 & 2032
- Figure 16: South America Industrial Inertial Systems Market Volume (K Unit), by Country 2024 & 2032
- Figure 17: South America Industrial Inertial Systems Market Revenue Share (%), by Country 2024 & 2032
- Figure 18: South America Industrial Inertial Systems Market Volume Share (%), by Country 2024 & 2032
- Figure 19: North America Industrial Inertial Systems Market Revenue (Million), by Country 2024 & 2032
- Figure 20: North America Industrial Inertial Systems Market Volume (K Unit), by Country 2024 & 2032
- Figure 21: North America Industrial Inertial Systems Market Revenue Share (%), by Country 2024 & 2032
- Figure 22: North America Industrial Inertial Systems Market Volume Share (%), by Country 2024 & 2032
- Figure 23: MEA Industrial Inertial Systems Market Revenue (Million), by Country 2024 & 2032
- Figure 24: MEA Industrial Inertial Systems Market Volume (K Unit), by Country 2024 & 2032
- Figure 25: MEA Industrial Inertial Systems Market Revenue Share (%), by Country 2024 & 2032
- Figure 26: MEA Industrial Inertial Systems Market Volume Share (%), by Country 2024 & 2032
- Figure 27: North America Industrial Inertial Systems Market Revenue (Million), by Equipment 2024 & 2032
- Figure 28: North America Industrial Inertial Systems Market Volume (K Unit), by Equipment 2024 & 2032
- Figure 29: North America Industrial Inertial Systems Market Revenue Share (%), by Equipment 2024 & 2032
- Figure 30: North America Industrial Inertial Systems Market Volume Share (%), by Equipment 2024 & 2032
- Figure 31: North America Industrial Inertial Systems Market Revenue (Million), by Application 2024 & 2032
- Figure 32: North America Industrial Inertial Systems Market Volume (K Unit), by Application 2024 & 2032
- Figure 33: North America Industrial Inertial Systems Market Revenue Share (%), by Application 2024 & 2032
- Figure 34: North America Industrial Inertial Systems Market Volume Share (%), by Application 2024 & 2032
- Figure 35: North America Industrial Inertial Systems Market Revenue (Million), by End-user Industry 2024 & 2032
- Figure 36: North America Industrial Inertial Systems Market Volume (K Unit), by End-user Industry 2024 & 2032
- Figure 37: North America Industrial Inertial Systems Market Revenue Share (%), by End-user Industry 2024 & 2032
- Figure 38: North America Industrial Inertial Systems Market Volume Share (%), by End-user Industry 2024 & 2032
- Figure 39: North America Industrial Inertial Systems Market Revenue (Million), by Country 2024 & 2032
- Figure 40: North America Industrial Inertial Systems Market Volume (K Unit), by Country 2024 & 2032
- Figure 41: North America Industrial Inertial Systems Market Revenue Share (%), by Country 2024 & 2032
- Figure 42: North America Industrial Inertial Systems Market Volume Share (%), by Country 2024 & 2032
- Figure 43: Europe Industrial Inertial Systems Market Revenue (Million), by Equipment 2024 & 2032
- Figure 44: Europe Industrial Inertial Systems Market Volume (K Unit), by Equipment 2024 & 2032
- Figure 45: Europe Industrial Inertial Systems Market Revenue Share (%), by Equipment 2024 & 2032
- Figure 46: Europe Industrial Inertial Systems Market Volume Share (%), by Equipment 2024 & 2032
- Figure 47: Europe Industrial Inertial Systems Market Revenue (Million), by Application 2024 & 2032
- Figure 48: Europe Industrial Inertial Systems Market Volume (K Unit), by Application 2024 & 2032
- Figure 49: Europe Industrial Inertial Systems Market Revenue Share (%), by Application 2024 & 2032
- Figure 50: Europe Industrial Inertial Systems Market Volume Share (%), by Application 2024 & 2032
- Figure 51: Europe Industrial Inertial Systems Market Revenue (Million), by End-user Industry 2024 & 2032
- Figure 52: Europe Industrial Inertial Systems Market Volume (K Unit), by End-user Industry 2024 & 2032
- Figure 53: Europe Industrial Inertial Systems Market Revenue Share (%), by End-user Industry 2024 & 2032
- Figure 54: Europe Industrial Inertial Systems Market Volume Share (%), by End-user Industry 2024 & 2032
- Figure 55: Europe Industrial Inertial Systems Market Revenue (Million), by Country 2024 & 2032
- Figure 56: Europe Industrial Inertial Systems Market Volume (K Unit), by Country 2024 & 2032
- Figure 57: Europe Industrial Inertial Systems Market Revenue Share (%), by Country 2024 & 2032
- Figure 58: Europe Industrial Inertial Systems Market Volume Share (%), by Country 2024 & 2032
- Figure 59: Asia Pacific Industrial Inertial Systems Market Revenue (Million), by Equipment 2024 & 2032
- Figure 60: Asia Pacific Industrial Inertial Systems Market Volume (K Unit), by Equipment 2024 & 2032
- Figure 61: Asia Pacific Industrial Inertial Systems Market Revenue Share (%), by Equipment 2024 & 2032
- Figure 62: Asia Pacific Industrial Inertial Systems Market Volume Share (%), by Equipment 2024 & 2032
- Figure 63: Asia Pacific Industrial Inertial Systems Market Revenue (Million), by Application 2024 & 2032
- Figure 64: Asia Pacific Industrial Inertial Systems Market Volume (K Unit), by Application 2024 & 2032
- Figure 65: Asia Pacific Industrial Inertial Systems Market Revenue Share (%), by Application 2024 & 2032
- Figure 66: Asia Pacific Industrial Inertial Systems Market Volume Share (%), by Application 2024 & 2032
- Figure 67: Asia Pacific Industrial Inertial Systems Market Revenue (Million), by End-user Industry 2024 & 2032
- Figure 68: Asia Pacific Industrial Inertial Systems Market Volume (K Unit), by End-user Industry 2024 & 2032
- Figure 69: Asia Pacific Industrial Inertial Systems Market Revenue Share (%), by End-user Industry 2024 & 2032
- Figure 70: Asia Pacific Industrial Inertial Systems Market Volume Share (%), by End-user Industry 2024 & 2032
- Figure 71: Asia Pacific Industrial Inertial Systems Market Revenue (Million), by Country 2024 & 2032
- Figure 72: Asia Pacific Industrial Inertial Systems Market Volume (K Unit), by Country 2024 & 2032
- Figure 73: Asia Pacific Industrial Inertial Systems Market Revenue Share (%), by Country 2024 & 2032
- Figure 74: Asia Pacific Industrial Inertial Systems Market Volume Share (%), by Country 2024 & 2032
- Figure 75: Rest of the World Industrial Inertial Systems Market Revenue (Million), by Equipment 2024 & 2032
- Figure 76: Rest of the World Industrial Inertial Systems Market Volume (K Unit), by Equipment 2024 & 2032
- Figure 77: Rest of the World Industrial Inertial Systems Market Revenue Share (%), by Equipment 2024 & 2032
- Figure 78: Rest of the World Industrial Inertial Systems Market Volume Share (%), by Equipment 2024 & 2032
- Figure 79: Rest of the World Industrial Inertial Systems Market Revenue (Million), by Application 2024 & 2032
- Figure 80: Rest of the World Industrial Inertial Systems Market Volume (K Unit), by Application 2024 & 2032
- Figure 81: Rest of the World Industrial Inertial Systems Market Revenue Share (%), by Application 2024 & 2032
- Figure 82: Rest of the World Industrial Inertial Systems Market Volume Share (%), by Application 2024 & 2032
- Figure 83: Rest of the World Industrial Inertial Systems Market Revenue (Million), by End-user Industry 2024 & 2032
- Figure 84: Rest of the World Industrial Inertial Systems Market Volume (K Unit), by End-user Industry 2024 & 2032
- Figure 85: Rest of the World Industrial Inertial Systems Market Revenue Share (%), by End-user Industry 2024 & 2032
- Figure 86: Rest of the World Industrial Inertial Systems Market Volume Share (%), by End-user Industry 2024 & 2032
- Figure 87: Rest of the World Industrial Inertial Systems Market Revenue (Million), by Country 2024 & 2032
- Figure 88: Rest of the World Industrial Inertial Systems Market Volume (K Unit), by Country 2024 & 2032
- Figure 89: Rest of the World Industrial Inertial Systems Market Revenue Share (%), by Country 2024 & 2032
- Figure 90: Rest of the World Industrial Inertial Systems Market Volume Share (%), by Country 2024 & 2032
List of Tables
- Table 1: Global Industrial Inertial Systems Market Revenue Million Forecast, by Region 2019 & 2032
- Table 2: Global Industrial Inertial Systems Market Volume K Unit Forecast, by Region 2019 & 2032
- Table 3: Global Industrial Inertial Systems Market Revenue Million Forecast, by Equipment 2019 & 2032
- Table 4: Global Industrial Inertial Systems Market Volume K Unit Forecast, by Equipment 2019 & 2032
- Table 5: Global Industrial Inertial Systems Market Revenue Million Forecast, by Application 2019 & 2032
- Table 6: Global Industrial Inertial Systems Market Volume K Unit Forecast, by Application 2019 & 2032
- Table 7: Global Industrial Inertial Systems Market Revenue Million Forecast, by End-user Industry 2019 & 2032
- Table 8: Global Industrial Inertial Systems Market Volume K Unit Forecast, by End-user Industry 2019 & 2032
- Table 9: Global Industrial Inertial Systems Market Revenue Million Forecast, by Region 2019 & 2032
- Table 10: Global Industrial Inertial Systems Market Volume K Unit Forecast, by Region 2019 & 2032
- Table 11: Global Industrial Inertial Systems Market Revenue Million Forecast, by Country 2019 & 2032
- Table 12: Global Industrial Inertial Systems Market Volume K Unit Forecast, by Country 2019 & 2032
- Table 13: United States Industrial Inertial Systems Market Revenue (Million) Forecast, by Application 2019 & 2032
- Table 14: United States Industrial Inertial Systems Market Volume (K Unit) Forecast, by Application 2019 & 2032
- Table 15: Canada Industrial Inertial Systems Market Revenue (Million) Forecast, by Application 2019 & 2032
- Table 16: Canada Industrial Inertial Systems Market Volume (K Unit) Forecast, by Application 2019 & 2032
- Table 17: Mexico Industrial Inertial Systems Market Revenue (Million) Forecast, by Application 2019 & 2032
- Table 18: Mexico Industrial Inertial Systems Market Volume (K Unit) Forecast, by Application 2019 & 2032
- Table 19: Global Industrial Inertial Systems Market Revenue Million Forecast, by Country 2019 & 2032
- Table 20: Global Industrial Inertial Systems Market Volume K Unit Forecast, by Country 2019 & 2032
- Table 21: Germany Industrial Inertial Systems Market Revenue (Million) Forecast, by Application 2019 & 2032
- Table 22: Germany Industrial Inertial Systems Market Volume (K Unit) Forecast, by Application 2019 & 2032
- Table 23: United Kingdom Industrial Inertial Systems Market Revenue (Million) Forecast, by Application 2019 & 2032
- Table 24: United Kingdom Industrial Inertial Systems Market Volume (K Unit) Forecast, by Application 2019 & 2032
- Table 25: France Industrial Inertial Systems Market Revenue (Million) Forecast, by Application 2019 & 2032
- Table 26: France Industrial Inertial Systems Market Volume (K Unit) Forecast, by Application 2019 & 2032
- Table 27: Spain Industrial Inertial Systems Market Revenue (Million) Forecast, by Application 2019 & 2032
- Table 28: Spain Industrial Inertial Systems Market Volume (K Unit) Forecast, by Application 2019 & 2032
- Table 29: Italy Industrial Inertial Systems Market Revenue (Million) Forecast, by Application 2019 & 2032
- Table 30: Italy Industrial Inertial Systems Market Volume (K Unit) Forecast, by Application 2019 & 2032
- Table 31: Spain Industrial Inertial Systems Market Revenue (Million) Forecast, by Application 2019 & 2032
- Table 32: Spain Industrial Inertial Systems Market Volume (K Unit) Forecast, by Application 2019 & 2032
- Table 33: Belgium Industrial Inertial Systems Market Revenue (Million) Forecast, by Application 2019 & 2032
- Table 34: Belgium Industrial Inertial Systems Market Volume (K Unit) Forecast, by Application 2019 & 2032
- Table 35: Netherland Industrial Inertial Systems Market Revenue (Million) Forecast, by Application 2019 & 2032
- Table 36: Netherland Industrial Inertial Systems Market Volume (K Unit) Forecast, by Application 2019 & 2032
- Table 37: Nordics Industrial Inertial Systems Market Revenue (Million) Forecast, by Application 2019 & 2032
- Table 38: Nordics Industrial Inertial Systems Market Volume (K Unit) Forecast, by Application 2019 & 2032
- Table 39: Rest of Europe Industrial Inertial Systems Market Revenue (Million) Forecast, by Application 2019 & 2032
- Table 40: Rest of Europe Industrial Inertial Systems Market Volume (K Unit) Forecast, by Application 2019 & 2032
- Table 41: Global Industrial Inertial Systems Market Revenue Million Forecast, by Country 2019 & 2032
- Table 42: Global Industrial Inertial Systems Market Volume K Unit Forecast, by Country 2019 & 2032
- Table 43: China Industrial Inertial Systems Market Revenue (Million) Forecast, by Application 2019 & 2032
- Table 44: China Industrial Inertial Systems Market Volume (K Unit) Forecast, by Application 2019 & 2032
- Table 45: Japan Industrial Inertial Systems Market Revenue (Million) Forecast, by Application 2019 & 2032
- Table 46: Japan Industrial Inertial Systems Market Volume (K Unit) Forecast, by Application 2019 & 2032
- Table 47: India Industrial Inertial Systems Market Revenue (Million) Forecast, by Application 2019 & 2032
- Table 48: India Industrial Inertial Systems Market Volume (K Unit) Forecast, by Application 2019 & 2032
- Table 49: South Korea Industrial Inertial Systems Market Revenue (Million) Forecast, by Application 2019 & 2032
- Table 50: South Korea Industrial Inertial Systems Market Volume (K Unit) Forecast, by Application 2019 & 2032
- Table 51: Southeast Asia Industrial Inertial Systems Market Revenue (Million) Forecast, by Application 2019 & 2032
- Table 52: Southeast Asia Industrial Inertial Systems Market Volume (K Unit) Forecast, by Application 2019 & 2032
- Table 53: Australia Industrial Inertial Systems Market Revenue (Million) Forecast, by Application 2019 & 2032
- Table 54: Australia Industrial Inertial Systems Market Volume (K Unit) Forecast, by Application 2019 & 2032
- Table 55: Indonesia Industrial Inertial Systems Market Revenue (Million) Forecast, by Application 2019 & 2032
- Table 56: Indonesia Industrial Inertial Systems Market Volume (K Unit) Forecast, by Application 2019 & 2032
- Table 57: Phillipes Industrial Inertial Systems Market Revenue (Million) Forecast, by Application 2019 & 2032
- Table 58: Phillipes Industrial Inertial Systems Market Volume (K Unit) Forecast, by Application 2019 & 2032
- Table 59: Singapore Industrial Inertial Systems Market Revenue (Million) Forecast, by Application 2019 & 2032
- Table 60: Singapore Industrial Inertial Systems Market Volume (K Unit) Forecast, by Application 2019 & 2032
- Table 61: Thailandc Industrial Inertial Systems Market Revenue (Million) Forecast, by Application 2019 & 2032
- Table 62: Thailandc Industrial Inertial Systems Market Volume (K Unit) Forecast, by Application 2019 & 2032
- Table 63: Rest of Asia Pacific Industrial Inertial Systems Market Revenue (Million) Forecast, by Application 2019 & 2032
- Table 64: Rest of Asia Pacific Industrial Inertial Systems Market Volume (K Unit) Forecast, by Application 2019 & 2032
- Table 65: Global Industrial Inertial Systems Market Revenue Million Forecast, by Country 2019 & 2032
- Table 66: Global Industrial Inertial Systems Market Volume K Unit Forecast, by Country 2019 & 2032
- Table 67: Brazil Industrial Inertial Systems Market Revenue (Million) Forecast, by Application 2019 & 2032
- Table 68: Brazil Industrial Inertial Systems Market Volume (K Unit) Forecast, by Application 2019 & 2032
- Table 69: Argentina Industrial Inertial Systems Market Revenue (Million) Forecast, by Application 2019 & 2032
- Table 70: Argentina Industrial Inertial Systems Market Volume (K Unit) Forecast, by Application 2019 & 2032
- Table 71: Peru Industrial Inertial Systems Market Revenue (Million) Forecast, by Application 2019 & 2032
- Table 72: Peru Industrial Inertial Systems Market Volume (K Unit) Forecast, by Application 2019 & 2032
- Table 73: Chile Industrial Inertial Systems Market Revenue (Million) Forecast, by Application 2019 & 2032
- Table 74: Chile Industrial Inertial Systems Market Volume (K Unit) Forecast, by Application 2019 & 2032
- Table 75: Colombia Industrial Inertial Systems Market Revenue (Million) Forecast, by Application 2019 & 2032
- Table 76: Colombia Industrial Inertial Systems Market Volume (K Unit) Forecast, by Application 2019 & 2032
- Table 77: Ecuador Industrial Inertial Systems Market Revenue (Million) Forecast, by Application 2019 & 2032
- Table 78: Ecuador Industrial Inertial Systems Market Volume (K Unit) Forecast, by Application 2019 & 2032
- Table 79: Venezuela Industrial Inertial Systems Market Revenue (Million) Forecast, by Application 2019 & 2032
- Table 80: Venezuela Industrial Inertial Systems Market Volume (K Unit) Forecast, by Application 2019 & 2032
- Table 81: Rest of South America Industrial Inertial Systems Market Revenue (Million) Forecast, by Application 2019 & 2032
- Table 82: Rest of South America Industrial Inertial Systems Market Volume (K Unit) Forecast, by Application 2019 & 2032
- Table 83: Global Industrial Inertial Systems Market Revenue Million Forecast, by Country 2019 & 2032
- Table 84: Global Industrial Inertial Systems Market Volume K Unit Forecast, by Country 2019 & 2032
- Table 85: United States Industrial Inertial Systems Market Revenue (Million) Forecast, by Application 2019 & 2032
- Table 86: United States Industrial Inertial Systems Market Volume (K Unit) Forecast, by Application 2019 & 2032
- Table 87: Canada Industrial Inertial Systems Market Revenue (Million) Forecast, by Application 2019 & 2032
- Table 88: Canada Industrial Inertial Systems Market Volume (K Unit) Forecast, by Application 2019 & 2032
- Table 89: Mexico Industrial Inertial Systems Market Revenue (Million) Forecast, by Application 2019 & 2032
- Table 90: Mexico Industrial Inertial Systems Market Volume (K Unit) Forecast, by Application 2019 & 2032
- Table 91: Global Industrial Inertial Systems Market Revenue Million Forecast, by Country 2019 & 2032
- Table 92: Global Industrial Inertial Systems Market Volume K Unit Forecast, by Country 2019 & 2032
- Table 93: United Arab Emirates Industrial Inertial Systems Market Revenue (Million) Forecast, by Application 2019 & 2032
- Table 94: United Arab Emirates Industrial Inertial Systems Market Volume (K Unit) Forecast, by Application 2019 & 2032
- Table 95: Saudi Arabia Industrial Inertial Systems Market Revenue (Million) Forecast, by Application 2019 & 2032
- Table 96: Saudi Arabia Industrial Inertial Systems Market Volume (K Unit) Forecast, by Application 2019 & 2032
- Table 97: South Africa Industrial Inertial Systems Market Revenue (Million) Forecast, by Application 2019 & 2032
- Table 98: South Africa Industrial Inertial Systems Market Volume (K Unit) Forecast, by Application 2019 & 2032
- Table 99: Rest of Middle East and Africa Industrial Inertial Systems Market Revenue (Million) Forecast, by Application 2019 & 2032
- Table 100: Rest of Middle East and Africa Industrial Inertial Systems Market Volume (K Unit) Forecast, by Application 2019 & 2032
- Table 101: Global Industrial Inertial Systems Market Revenue Million Forecast, by Equipment 2019 & 2032
- Table 102: Global Industrial Inertial Systems Market Volume K Unit Forecast, by Equipment 2019 & 2032
- Table 103: Global Industrial Inertial Systems Market Revenue Million Forecast, by Application 2019 & 2032
- Table 104: Global Industrial Inertial Systems Market Volume K Unit Forecast, by Application 2019 & 2032
- Table 105: Global Industrial Inertial Systems Market Revenue Million Forecast, by End-user Industry 2019 & 2032
- Table 106: Global Industrial Inertial Systems Market Volume K Unit Forecast, by End-user Industry 2019 & 2032
- Table 107: Global Industrial Inertial Systems Market Revenue Million Forecast, by Country 2019 & 2032
- Table 108: Global Industrial Inertial Systems Market Volume K Unit Forecast, by Country 2019 & 2032
- Table 109: Global Industrial Inertial Systems Market Revenue Million Forecast, by Equipment 2019 & 2032
- Table 110: Global Industrial Inertial Systems Market Volume K Unit Forecast, by Equipment 2019 & 2032
- Table 111: Global Industrial Inertial Systems Market Revenue Million Forecast, by Application 2019 & 2032
- Table 112: Global Industrial Inertial Systems Market Volume K Unit Forecast, by Application 2019 & 2032
- Table 113: Global Industrial Inertial Systems Market Revenue Million Forecast, by End-user Industry 2019 & 2032
- Table 114: Global Industrial Inertial Systems Market Volume K Unit Forecast, by End-user Industry 2019 & 2032
- Table 115: Global Industrial Inertial Systems Market Revenue Million Forecast, by Country 2019 & 2032
- Table 116: Global Industrial Inertial Systems Market Volume K Unit Forecast, by Country 2019 & 2032
- Table 117: Global Industrial Inertial Systems Market Revenue Million Forecast, by Equipment 2019 & 2032
- Table 118: Global Industrial Inertial Systems Market Volume K Unit Forecast, by Equipment 2019 & 2032
- Table 119: Global Industrial Inertial Systems Market Revenue Million Forecast, by Application 2019 & 2032
- Table 120: Global Industrial Inertial Systems Market Volume K Unit Forecast, by Application 2019 & 2032
- Table 121: Global Industrial Inertial Systems Market Revenue Million Forecast, by End-user Industry 2019 & 2032
- Table 122: Global Industrial Inertial Systems Market Volume K Unit Forecast, by End-user Industry 2019 & 2032
- Table 123: Global Industrial Inertial Systems Market Revenue Million Forecast, by Country 2019 & 2032
- Table 124: Global Industrial Inertial Systems Market Volume K Unit Forecast, by Country 2019 & 2032
- Table 125: Global Industrial Inertial Systems Market Revenue Million Forecast, by Equipment 2019 & 2032
- Table 126: Global Industrial Inertial Systems Market Volume K Unit Forecast, by Equipment 2019 & 2032
- Table 127: Global Industrial Inertial Systems Market Revenue Million Forecast, by Application 2019 & 2032
- Table 128: Global Industrial Inertial Systems Market Volume K Unit Forecast, by Application 2019 & 2032
- Table 129: Global Industrial Inertial Systems Market Revenue Million Forecast, by End-user Industry 2019 & 2032
- Table 130: Global Industrial Inertial Systems Market Volume K Unit Forecast, by End-user Industry 2019 & 2032
- Table 131: Global Industrial Inertial Systems Market Revenue Million Forecast, by Country 2019 & 2032
- Table 132: Global Industrial Inertial Systems Market Volume K Unit Forecast, by Country 2019 & 2032
Frequently Asked Questions
1. What is the projected Compound Annual Growth Rate (CAGR) of the Industrial Inertial Systems Market?
The projected CAGR is approximately 11.24%.
2. Which companies are prominent players in the Industrial Inertial Systems Market?
Key companies in the market include SBG Systems SAS, L3Harris Technologies Inc, LORD Microstain Sensing Systems, MEMSIC Inc, Aeron Systems Pvt Ltd, Safran SA, Systron Donner Inertial Inc, Trimble Inc, Vectornav Technologies LLC, Ixblue SAS.
3. What are the main segments of the Industrial Inertial Systems Market?
The market segments include Equipment, Application, End-user Industry.
4. Can you provide details about the market size?
The market size is estimated to be USD XX Million as of 2022.
5. What are some drivers contributing to market growth?
; Rapid Rise of Unmanned Vehicles in Both Defense and Civilian Applications; Technological Advancement Enabling More Effective Components at a Smaller and Lighter Size.
6. What are the notable trends driving market growth?
Inertial Measurement Units are Expected to Hold Significant Share.
7. Are there any restraints impacting market growth?
; Integration Drift Error is a Major Concern in Navigation Systems.
8. Can you provide examples of recent developments in the market?
N/A
9. What pricing options are available for accessing the report?
Pricing options include single-user, multi-user, and enterprise licenses priced at USD 4750, USD 5250, and USD 8750 respectively.
10. Is the market size provided in terms of value or volume?
The market size is provided in terms of value, measured in Million and volume, measured in K Unit.
11. Are there any specific market keywords associated with the report?
Yes, the market keyword associated with the report is "Industrial Inertial Systems Market," which aids in identifying and referencing the specific market segment covered.
12. How do I determine which pricing option suits my needs best?
The pricing options vary based on user requirements and access needs. Individual users may opt for single-user licenses, while businesses requiring broader access may choose multi-user or enterprise licenses for cost-effective access to the report.
13. Are there any additional resources or data provided in the Industrial Inertial Systems Market report?
While the report offers comprehensive insights, it's advisable to review the specific contents or supplementary materials provided to ascertain if additional resources or data are available.
14. How can I stay updated on further developments or reports in the Industrial Inertial Systems Market?
To stay informed about further developments, trends, and reports in the Industrial Inertial Systems Market, consider subscribing to industry newsletters, following relevant companies and organizations, or regularly checking reputable industry news sources and publications.
Methodology
Step 1 - Identification of Relevant Samples Size from Population Database


Step 2 - Approaches for Defining Global Market Size (Value, Volume* & Price*)

Note*: In applicable scenarios
Step 3 - Data Sources
Primary Research
- Web Analytics
- Survey Reports
- Research Institute
- Latest Research Reports
- Opinion Leaders
Secondary Research
- Annual Reports
- White Paper
- Latest Press Release
- Industry Association
- Paid Database
- Investor Presentations

Step 4 - Data Triangulation
Involves using different sources of information in order to increase the validity of a study
These sources are likely to be stakeholders in a program - participants, other researchers, program staff, other community members, and so on.
Then we put all data in single framework & apply various statistical tools to find out the dynamic on the market.
During the analysis stage, feedback from the stakeholder groups would be compared to determine areas of agreement as well as areas of divergence


