
Key Insights
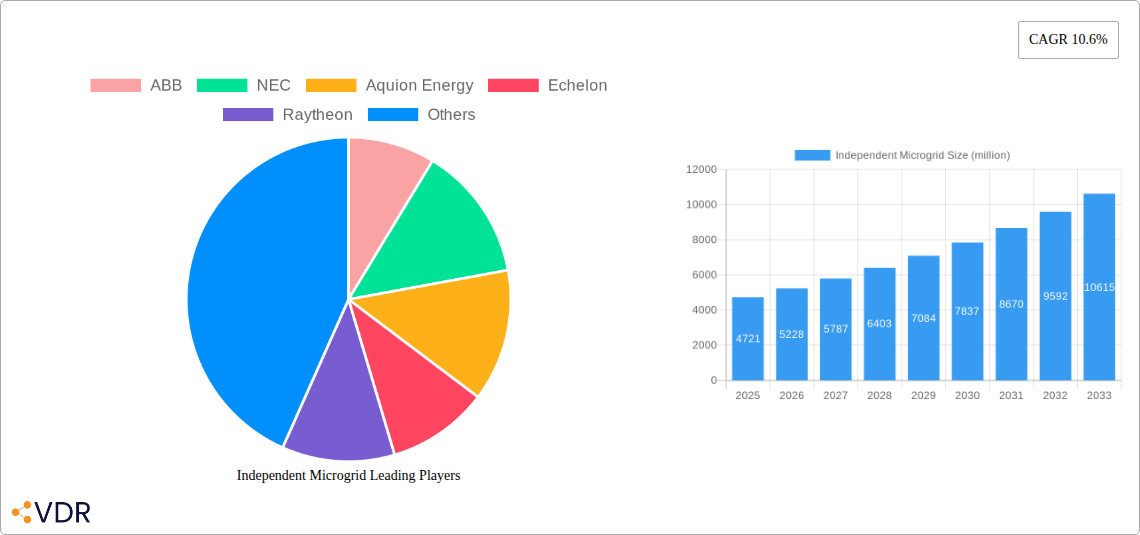
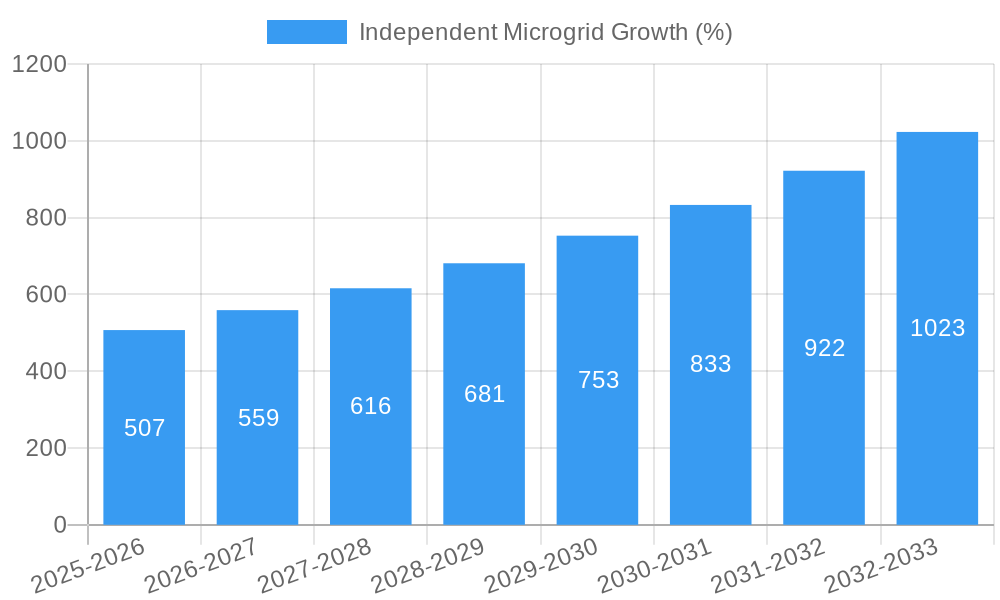
The independent microgrid market, valued at $4721 million in 2025, is poised for substantial growth, exhibiting a Compound Annual Growth Rate (CAGR) of 10.6% from 2025 to 2033. This robust expansion is driven by several key factors. Increasing concerns about grid instability and the need for reliable power supply, particularly in remote areas and critical infrastructure facilities like hospitals and data centers, are major catalysts. Furthermore, the growing adoption of renewable energy sources, coupled with advancements in energy storage technologies, is significantly boosting the market. Government initiatives promoting energy independence and resilience, along with decreasing costs of microgrid components, are further fueling this growth. The market is segmented by various factors including application (residential, commercial, industrial), technology (solar, wind, battery storage), and geography, with North America and Europe currently holding significant market share. Competitive landscape is marked by the presence of both established players like ABB, Siemens, and Eaton Corporation, and emerging companies specializing in innovative microgrid solutions.
The forecast period (2025-2033) anticipates a continued expansion, with the market size projected to exceed $11,000 million by 2033. However, challenges remain. High initial investment costs can act as a barrier to entry for some potential adopters. Regulatory hurdles and integration complexities with existing grids can also slow down market penetration. Nevertheless, ongoing technological advancements, supportive government policies, and the increasing awareness of the benefits of resilience and energy independence are expected to mitigate these challenges and propel the market towards sustained, significant growth over the long term. Strategic partnerships and collaborations amongst technology providers and energy companies will be crucial for successful market expansion and wider adoption of independent microgrid solutions.
Independent Microgrid Market Report: 2019-2033
A comprehensive analysis of the independent microgrid market, encompassing market dynamics, growth trends, regional dominance, product landscape, challenges, opportunities, and key players. This report provides a detailed forecast from 2025 to 2033, with a base year of 2025 and historical data spanning 2019-2024. The independent microgrid market, a key segment within the broader energy storage and smart grid industries, is poised for significant growth. This report will provide invaluable insights for investors, industry professionals, and strategic decision-makers seeking to navigate this dynamic landscape.
Independent Microgrid Market Dynamics & Structure
The independent microgrid market is characterized by moderate concentration, with several key players vying for market share. Technological innovation, driven by advancements in battery storage, power electronics, and smart grid technologies, is a major growth catalyst. However, regulatory frameworks and standardization efforts vary across regions, posing challenges for market expansion. The market witnesses continuous product substitution, with newer, more efficient technologies replacing older ones. M&A activity, although currently moderate (approximately xx deals per year in the historical period), is expected to intensify as companies seek to expand their market reach and technological capabilities. End-user demographics are evolving, with increased adoption by commercial and industrial sectors, as well as residential segments in certain regions.
- Market Concentration: Moderately concentrated, with the top 5 players holding approximately xx% of the market share in 2025.
- Technological Innovation: Rapid advancements in battery storage (e.g., flow batteries) and smart grid technologies are key drivers.
- Regulatory Landscape: Varied across regions, creating both opportunities and challenges for market players.
- Competitive Substitutes: Traditional grid-tied systems, but increasingly being replaced by more resilient microgrid solutions.
- M&A Activity: xx deals annually (2019-2024), projected to increase to xx by 2033.
- End-User Demographics: Expanding beyond residential to encompass commercial and industrial sectors.
Independent Microgrid Growth Trends & Insights
The independent microgrid market is experiencing robust growth, driven by increasing demand for reliable and resilient power supply, coupled with the declining cost of renewable energy and energy storage technologies. The market size, valued at $xx million in 2025, is projected to reach $xx million by 2033, exhibiting a CAGR of xx% during the forecast period. This growth is fueled by rising concerns about grid stability and the increasing adoption of renewable energy sources, leading to higher penetration of microgrid systems, especially in remote and off-grid locations. Technological disruptions, such as the advancement of AI-powered energy management systems, further enhance the appeal of independent microgrids. Consumer behavior is also shifting, with a growing preference for sustainable and resilient energy solutions.
Dominant Regions, Countries, or Segments in Independent Microgrid
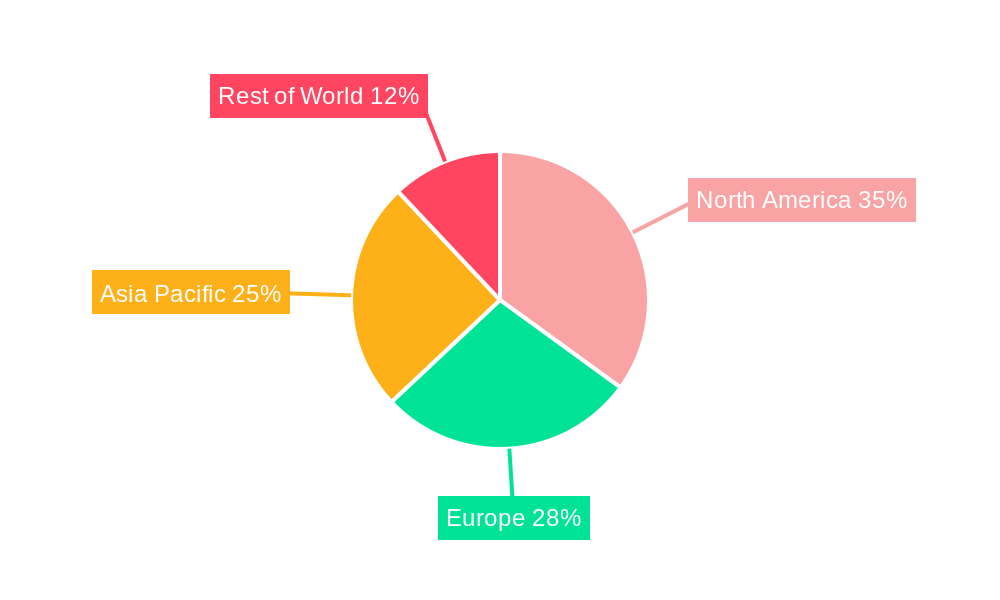
North America currently holds the dominant position in the independent microgrid market, driven by supportive government policies, robust investments in renewable energy, and a strong focus on grid modernization. Europe and Asia Pacific are also experiencing significant growth, albeit at a slightly slower pace. Key drivers for growth in these regions include:
- North America: Strong regulatory support, high adoption of renewables, and grid modernization initiatives.
- Europe: Focus on energy independence and decarbonization, increasing investments in smart grids.
- Asia Pacific: Rapid economic growth, rising energy demand, and government incentives for renewable energy.
The commercial and industrial segments are leading the growth, with increasing adoption of independent microgrids for critical facilities and industrial operations, where high reliability and resilience are essential.
Independent Microgrid Product Landscape
The independent microgrid product landscape is characterized by a wide range of solutions, including various power generation technologies (solar PV, wind, diesel generators), energy storage systems (batteries, fuel cells), and advanced control and monitoring systems. Key product innovations are focused on enhancing efficiency, scalability, and integration with smart grid technologies. The unique selling propositions include improved resilience, reduced reliance on the main grid, and enhanced operational flexibility. Technological advancements such as AI-powered energy management systems and advanced power electronic converters are driving performance improvements.
Key Drivers, Barriers & Challenges in Independent Microgrid
Key Drivers:
- Increasing demand for reliable power: Concerns over grid stability and outages are driving adoption.
- Declining cost of renewable energy: Makes independent microgrids economically viable.
- Government incentives and policies: Support for renewable energy integration and grid modernization.
Key Challenges:
- High initial investment costs: Remains a significant barrier for adoption, especially for residential consumers.
- Regulatory complexities: Varying regulations and standards across regions create hurdles.
- Supply chain disruptions: Can impact the availability and cost of components. This resulted in a xx% increase in project costs in 2022.
Emerging Opportunities in Independent Microgrid
Significant opportunities exist in untapped markets, including remote communities and developing economies, where access to reliable electricity is limited. Innovative applications, such as microgrids for electric vehicle charging infrastructure, data centers, and disaster relief efforts, are gaining traction. Evolving consumer preferences towards sustainable and resilient energy solutions present further growth opportunities.
Growth Accelerators in the Independent Microgrid Industry
Technological breakthroughs in battery storage, power electronics, and AI-powered energy management systems are fueling long-term growth. Strategic partnerships between energy companies, technology providers, and system integrators are accelerating market expansion. Government policies promoting renewable energy integration and grid modernization are crucial catalysts.
Key Players Shaping the Independent Microgrid Market
- ABB
- NEC
- Aquion Energy
- Echelon
- Raytheon
- S&C Electric Co
- Eaton Corporation
- Sunverge Energy
- Siemens
- Toshiba
- General Microgrids
- Lockheed Martin
Notable Milestones in Independent Microgrid Sector
- 2020: Significant increase in government funding for microgrid projects in several countries.
- 2021: Launch of several innovative microgrid solutions incorporating advanced energy storage technologies.
- 2022: Several major M&A deals shaping the industry landscape.
- 2023: Increased focus on microgrid resilience and cybersecurity.
In-Depth Independent Microgrid Market Outlook
The independent microgrid market is poised for continued robust growth, driven by compelling market drivers and emerging opportunities. The focus on enhancing grid resilience, integrating renewable energy, and improving energy efficiency will propel market expansion. Strategic partnerships, technological innovation, and supportive government policies will play crucial roles in shaping the future of the independent microgrid sector. The long-term outlook is extremely positive, with substantial potential for growth across various regions and market segments.
Independent Microgrid Segmentation
-
1. Application
- 1.1. Commercial/Industrial Microgrid
- 1.2. Community/Utility Microgrid
- 1.3. Campus/Institutional Microgrid
- 1.4. Military Microgrid
- 1.5. Remote Microgrid
-
2. Types
- 2.1. DC Microgrid
- 2.2. AC Microgrid
Independent Microgrid Segmentation By Geography
-
1. North America
- 1.1. United States
- 1.2. Canada
- 1.3. Mexico
-
2. South America
- 2.1. Brazil
- 2.2. Argentina
- 2.3. Rest of South America
-
3. Europe
- 3.1. United Kingdom
- 3.2. Germany
- 3.3. France
- 3.4. Italy
- 3.5. Spain
- 3.6. Russia
- 3.7. Benelux
- 3.8. Nordics
- 3.9. Rest of Europe
-
4. Middle East & Africa
- 4.1. Turkey
- 4.2. Israel
- 4.3. GCC
- 4.4. North Africa
- 4.5. South Africa
- 4.6. Rest of Middle East & Africa
-
5. Asia Pacific
- 5.1. China
- 5.2. India
- 5.3. Japan
- 5.4. South Korea
- 5.5. ASEAN
- 5.6. Oceania
- 5.7. Rest of Asia Pacific
Independent Microgrid REPORT HIGHLIGHTS
| Aspects | Details |
|---|---|
| Study Period | 2019-2033 |
| Base Year | 2024 |
| Estimated Year | 2025 |
| Forecast Period | 2025-2033 |
| Historical Period | 2019-2024 |
| Growth Rate | CAGR of 10.6% from 2019-2033 |
| Segmentation |
|
Table of Contents
- 1. Introduction
- 1.1. Research Scope
- 1.2. Market Segmentation
- 1.3. Research Methodology
- 1.4. Definitions and Assumptions
- 2. Executive Summary
- 2.1. Introduction
- 3. Market Dynamics
- 3.1. Introduction
- 3.2. Market Drivers
- 3.3. Market Restrains
- 3.4. Market Trends
- 4. Market Factor Analysis
- 4.1. Porters Five Forces
- 4.2. Supply/Value Chain
- 4.3. PESTEL analysis
- 4.4. Market Entropy
- 4.5. Patent/Trademark Analysis
- 5. Global Independent Microgrid Analysis, Insights and Forecast, 2019-2031
- 5.1. Market Analysis, Insights and Forecast - by Application
- 5.1.1. Commercial/Industrial Microgrid
- 5.1.2. Community/Utility Microgrid
- 5.1.3. Campus/Institutional Microgrid
- 5.1.4. Military Microgrid
- 5.1.5. Remote Microgrid
- 5.2. Market Analysis, Insights and Forecast - by Types
- 5.2.1. DC Microgrid
- 5.2.2. AC Microgrid
- 5.3. Market Analysis, Insights and Forecast - by Region
- 5.3.1. North America
- 5.3.2. South America
- 5.3.3. Europe
- 5.3.4. Middle East & Africa
- 5.3.5. Asia Pacific
- 5.1. Market Analysis, Insights and Forecast - by Application
- 6. North America Independent Microgrid Analysis, Insights and Forecast, 2019-2031
- 6.1. Market Analysis, Insights and Forecast - by Application
- 6.1.1. Commercial/Industrial Microgrid
- 6.1.2. Community/Utility Microgrid
- 6.1.3. Campus/Institutional Microgrid
- 6.1.4. Military Microgrid
- 6.1.5. Remote Microgrid
- 6.2. Market Analysis, Insights and Forecast - by Types
- 6.2.1. DC Microgrid
- 6.2.2. AC Microgrid
- 6.1. Market Analysis, Insights and Forecast - by Application
- 7. South America Independent Microgrid Analysis, Insights and Forecast, 2019-2031
- 7.1. Market Analysis, Insights and Forecast - by Application
- 7.1.1. Commercial/Industrial Microgrid
- 7.1.2. Community/Utility Microgrid
- 7.1.3. Campus/Institutional Microgrid
- 7.1.4. Military Microgrid
- 7.1.5. Remote Microgrid
- 7.2. Market Analysis, Insights and Forecast - by Types
- 7.2.1. DC Microgrid
- 7.2.2. AC Microgrid
- 7.1. Market Analysis, Insights and Forecast - by Application
- 8. Europe Independent Microgrid Analysis, Insights and Forecast, 2019-2031
- 8.1. Market Analysis, Insights and Forecast - by Application
- 8.1.1. Commercial/Industrial Microgrid
- 8.1.2. Community/Utility Microgrid
- 8.1.3. Campus/Institutional Microgrid
- 8.1.4. Military Microgrid
- 8.1.5. Remote Microgrid
- 8.2. Market Analysis, Insights and Forecast - by Types
- 8.2.1. DC Microgrid
- 8.2.2. AC Microgrid
- 8.1. Market Analysis, Insights and Forecast - by Application
- 9. Middle East & Africa Independent Microgrid Analysis, Insights and Forecast, 2019-2031
- 9.1. Market Analysis, Insights and Forecast - by Application
- 9.1.1. Commercial/Industrial Microgrid
- 9.1.2. Community/Utility Microgrid
- 9.1.3. Campus/Institutional Microgrid
- 9.1.4. Military Microgrid
- 9.1.5. Remote Microgrid
- 9.2. Market Analysis, Insights and Forecast - by Types
- 9.2.1. DC Microgrid
- 9.2.2. AC Microgrid
- 9.1. Market Analysis, Insights and Forecast - by Application
- 10. Asia Pacific Independent Microgrid Analysis, Insights and Forecast, 2019-2031
- 10.1. Market Analysis, Insights and Forecast - by Application
- 10.1.1. Commercial/Industrial Microgrid
- 10.1.2. Community/Utility Microgrid
- 10.1.3. Campus/Institutional Microgrid
- 10.1.4. Military Microgrid
- 10.1.5. Remote Microgrid
- 10.2. Market Analysis, Insights and Forecast - by Types
- 10.2.1. DC Microgrid
- 10.2.2. AC Microgrid
- 10.1. Market Analysis, Insights and Forecast - by Application
- 11. Competitive Analysis
- 11.1. Global Market Share Analysis 2024
- 11.2. Company Profiles
- 11.2.1 ABB
- 11.2.1.1. Overview
- 11.2.1.2. Products
- 11.2.1.3. SWOT Analysis
- 11.2.1.4. Recent Developments
- 11.2.1.5. Financials (Based on Availability)
- 11.2.2 NEC
- 11.2.2.1. Overview
- 11.2.2.2. Products
- 11.2.2.3. SWOT Analysis
- 11.2.2.4. Recent Developments
- 11.2.2.5. Financials (Based on Availability)
- 11.2.3 Aquion Energy
- 11.2.3.1. Overview
- 11.2.3.2. Products
- 11.2.3.3. SWOT Analysis
- 11.2.3.4. Recent Developments
- 11.2.3.5. Financials (Based on Availability)
- 11.2.4 Echelon
- 11.2.4.1. Overview
- 11.2.4.2. Products
- 11.2.4.3. SWOT Analysis
- 11.2.4.4. Recent Developments
- 11.2.4.5. Financials (Based on Availability)
- 11.2.5 Raytheon
- 11.2.5.1. Overview
- 11.2.5.2. Products
- 11.2.5.3. SWOT Analysis
- 11.2.5.4. Recent Developments
- 11.2.5.5. Financials (Based on Availability)
- 11.2.6 S&C Electric Co
- 11.2.6.1. Overview
- 11.2.6.2. Products
- 11.2.6.3. SWOT Analysis
- 11.2.6.4. Recent Developments
- 11.2.6.5. Financials (Based on Availability)
- 11.2.7 Eaton Corporation
- 11.2.7.1. Overview
- 11.2.7.2. Products
- 11.2.7.3. SWOT Analysis
- 11.2.7.4. Recent Developments
- 11.2.7.5. Financials (Based on Availability)
- 11.2.8 Sunverge Energy
- 11.2.8.1. Overview
- 11.2.8.2. Products
- 11.2.8.3. SWOT Analysis
- 11.2.8.4. Recent Developments
- 11.2.8.5. Financials (Based on Availability)
- 11.2.9 Siemens
- 11.2.9.1. Overview
- 11.2.9.2. Products
- 11.2.9.3. SWOT Analysis
- 11.2.9.4. Recent Developments
- 11.2.9.5. Financials (Based on Availability)
- 11.2.10 Toshiba
- 11.2.10.1. Overview
- 11.2.10.2. Products
- 11.2.10.3. SWOT Analysis
- 11.2.10.4. Recent Developments
- 11.2.10.5. Financials (Based on Availability)
- 11.2.11 General Microgrids
- 11.2.11.1. Overview
- 11.2.11.2. Products
- 11.2.11.3. SWOT Analysis
- 11.2.11.4. Recent Developments
- 11.2.11.5. Financials (Based on Availability)
- 11.2.12 Lockheed Martin
- 11.2.12.1. Overview
- 11.2.12.2. Products
- 11.2.12.3. SWOT Analysis
- 11.2.12.4. Recent Developments
- 11.2.12.5. Financials (Based on Availability)
- 11.2.1 ABB
List of Figures
- Figure 1: Global Independent Microgrid Revenue Breakdown (million, %) by Region 2024 & 2032
- Figure 2: North America Independent Microgrid Revenue (million), by Application 2024 & 2032
- Figure 3: North America Independent Microgrid Revenue Share (%), by Application 2024 & 2032
- Figure 4: North America Independent Microgrid Revenue (million), by Types 2024 & 2032
- Figure 5: North America Independent Microgrid Revenue Share (%), by Types 2024 & 2032
- Figure 6: North America Independent Microgrid Revenue (million), by Country 2024 & 2032
- Figure 7: North America Independent Microgrid Revenue Share (%), by Country 2024 & 2032
- Figure 8: South America Independent Microgrid Revenue (million), by Application 2024 & 2032
- Figure 9: South America Independent Microgrid Revenue Share (%), by Application 2024 & 2032
- Figure 10: South America Independent Microgrid Revenue (million), by Types 2024 & 2032
- Figure 11: South America Independent Microgrid Revenue Share (%), by Types 2024 & 2032
- Figure 12: South America Independent Microgrid Revenue (million), by Country 2024 & 2032
- Figure 13: South America Independent Microgrid Revenue Share (%), by Country 2024 & 2032
- Figure 14: Europe Independent Microgrid Revenue (million), by Application 2024 & 2032
- Figure 15: Europe Independent Microgrid Revenue Share (%), by Application 2024 & 2032
- Figure 16: Europe Independent Microgrid Revenue (million), by Types 2024 & 2032
- Figure 17: Europe Independent Microgrid Revenue Share (%), by Types 2024 & 2032
- Figure 18: Europe Independent Microgrid Revenue (million), by Country 2024 & 2032
- Figure 19: Europe Independent Microgrid Revenue Share (%), by Country 2024 & 2032
- Figure 20: Middle East & Africa Independent Microgrid Revenue (million), by Application 2024 & 2032
- Figure 21: Middle East & Africa Independent Microgrid Revenue Share (%), by Application 2024 & 2032
- Figure 22: Middle East & Africa Independent Microgrid Revenue (million), by Types 2024 & 2032
- Figure 23: Middle East & Africa Independent Microgrid Revenue Share (%), by Types 2024 & 2032
- Figure 24: Middle East & Africa Independent Microgrid Revenue (million), by Country 2024 & 2032
- Figure 25: Middle East & Africa Independent Microgrid Revenue Share (%), by Country 2024 & 2032
- Figure 26: Asia Pacific Independent Microgrid Revenue (million), by Application 2024 & 2032
- Figure 27: Asia Pacific Independent Microgrid Revenue Share (%), by Application 2024 & 2032
- Figure 28: Asia Pacific Independent Microgrid Revenue (million), by Types 2024 & 2032
- Figure 29: Asia Pacific Independent Microgrid Revenue Share (%), by Types 2024 & 2032
- Figure 30: Asia Pacific Independent Microgrid Revenue (million), by Country 2024 & 2032
- Figure 31: Asia Pacific Independent Microgrid Revenue Share (%), by Country 2024 & 2032
List of Tables
- Table 1: Global Independent Microgrid Revenue million Forecast, by Region 2019 & 2032
- Table 2: Global Independent Microgrid Revenue million Forecast, by Application 2019 & 2032
- Table 3: Global Independent Microgrid Revenue million Forecast, by Types 2019 & 2032
- Table 4: Global Independent Microgrid Revenue million Forecast, by Region 2019 & 2032
- Table 5: Global Independent Microgrid Revenue million Forecast, by Application 2019 & 2032
- Table 6: Global Independent Microgrid Revenue million Forecast, by Types 2019 & 2032
- Table 7: Global Independent Microgrid Revenue million Forecast, by Country 2019 & 2032
- Table 8: United States Independent Microgrid Revenue (million) Forecast, by Application 2019 & 2032
- Table 9: Canada Independent Microgrid Revenue (million) Forecast, by Application 2019 & 2032
- Table 10: Mexico Independent Microgrid Revenue (million) Forecast, by Application 2019 & 2032
- Table 11: Global Independent Microgrid Revenue million Forecast, by Application 2019 & 2032
- Table 12: Global Independent Microgrid Revenue million Forecast, by Types 2019 & 2032
- Table 13: Global Independent Microgrid Revenue million Forecast, by Country 2019 & 2032
- Table 14: Brazil Independent Microgrid Revenue (million) Forecast, by Application 2019 & 2032
- Table 15: Argentina Independent Microgrid Revenue (million) Forecast, by Application 2019 & 2032
- Table 16: Rest of South America Independent Microgrid Revenue (million) Forecast, by Application 2019 & 2032
- Table 17: Global Independent Microgrid Revenue million Forecast, by Application 2019 & 2032
- Table 18: Global Independent Microgrid Revenue million Forecast, by Types 2019 & 2032
- Table 19: Global Independent Microgrid Revenue million Forecast, by Country 2019 & 2032
- Table 20: United Kingdom Independent Microgrid Revenue (million) Forecast, by Application 2019 & 2032
- Table 21: Germany Independent Microgrid Revenue (million) Forecast, by Application 2019 & 2032
- Table 22: France Independent Microgrid Revenue (million) Forecast, by Application 2019 & 2032
- Table 23: Italy Independent Microgrid Revenue (million) Forecast, by Application 2019 & 2032
- Table 24: Spain Independent Microgrid Revenue (million) Forecast, by Application 2019 & 2032
- Table 25: Russia Independent Microgrid Revenue (million) Forecast, by Application 2019 & 2032
- Table 26: Benelux Independent Microgrid Revenue (million) Forecast, by Application 2019 & 2032
- Table 27: Nordics Independent Microgrid Revenue (million) Forecast, by Application 2019 & 2032
- Table 28: Rest of Europe Independent Microgrid Revenue (million) Forecast, by Application 2019 & 2032
- Table 29: Global Independent Microgrid Revenue million Forecast, by Application 2019 & 2032
- Table 30: Global Independent Microgrid Revenue million Forecast, by Types 2019 & 2032
- Table 31: Global Independent Microgrid Revenue million Forecast, by Country 2019 & 2032
- Table 32: Turkey Independent Microgrid Revenue (million) Forecast, by Application 2019 & 2032
- Table 33: Israel Independent Microgrid Revenue (million) Forecast, by Application 2019 & 2032
- Table 34: GCC Independent Microgrid Revenue (million) Forecast, by Application 2019 & 2032
- Table 35: North Africa Independent Microgrid Revenue (million) Forecast, by Application 2019 & 2032
- Table 36: South Africa Independent Microgrid Revenue (million) Forecast, by Application 2019 & 2032
- Table 37: Rest of Middle East & Africa Independent Microgrid Revenue (million) Forecast, by Application 2019 & 2032
- Table 38: Global Independent Microgrid Revenue million Forecast, by Application 2019 & 2032
- Table 39: Global Independent Microgrid Revenue million Forecast, by Types 2019 & 2032
- Table 40: Global Independent Microgrid Revenue million Forecast, by Country 2019 & 2032
- Table 41: China Independent Microgrid Revenue (million) Forecast, by Application 2019 & 2032
- Table 42: India Independent Microgrid Revenue (million) Forecast, by Application 2019 & 2032
- Table 43: Japan Independent Microgrid Revenue (million) Forecast, by Application 2019 & 2032
- Table 44: South Korea Independent Microgrid Revenue (million) Forecast, by Application 2019 & 2032
- Table 45: ASEAN Independent Microgrid Revenue (million) Forecast, by Application 2019 & 2032
- Table 46: Oceania Independent Microgrid Revenue (million) Forecast, by Application 2019 & 2032
- Table 47: Rest of Asia Pacific Independent Microgrid Revenue (million) Forecast, by Application 2019 & 2032
Frequently Asked Questions
1. What is the projected Compound Annual Growth Rate (CAGR) of the Independent Microgrid?
The projected CAGR is approximately 10.6%.
2. Which companies are prominent players in the Independent Microgrid?
Key companies in the market include ABB, NEC, Aquion Energy, Echelon, Raytheon, S&C Electric Co, Eaton Corporation, Sunverge Energy, Siemens, Toshiba, General Microgrids, Lockheed Martin.
3. What are the main segments of the Independent Microgrid?
The market segments include Application, Types.
4. Can you provide details about the market size?
The market size is estimated to be USD 4721 million as of 2022.
5. What are some drivers contributing to market growth?
N/A
6. What are the notable trends driving market growth?
N/A
7. Are there any restraints impacting market growth?
N/A
8. Can you provide examples of recent developments in the market?
N/A
9. What pricing options are available for accessing the report?
Pricing options include single-user, multi-user, and enterprise licenses priced at USD 3950.00, USD 5925.00, and USD 7900.00 respectively.
10. Is the market size provided in terms of value or volume?
The market size is provided in terms of value, measured in million.
11. Are there any specific market keywords associated with the report?
Yes, the market keyword associated with the report is "Independent Microgrid," which aids in identifying and referencing the specific market segment covered.
12. How do I determine which pricing option suits my needs best?
The pricing options vary based on user requirements and access needs. Individual users may opt for single-user licenses, while businesses requiring broader access may choose multi-user or enterprise licenses for cost-effective access to the report.
13. Are there any additional resources or data provided in the Independent Microgrid report?
While the report offers comprehensive insights, it's advisable to review the specific contents or supplementary materials provided to ascertain if additional resources or data are available.
14. How can I stay updated on further developments or reports in the Independent Microgrid?
To stay informed about further developments, trends, and reports in the Independent Microgrid, consider subscribing to industry newsletters, following relevant companies and organizations, or regularly checking reputable industry news sources and publications.
Methodology
Step 1 - Identification of Relevant Samples Size from Population Database


Step 2 - Approaches for Defining Global Market Size (Value, Volume* & Price*)

Note*: In applicable scenarios
Step 3 - Data Sources
Primary Research
- Web Analytics
- Survey Reports
- Research Institute
- Latest Research Reports
- Opinion Leaders
Secondary Research
- Annual Reports
- White Paper
- Latest Press Release
- Industry Association
- Paid Database
- Investor Presentations

Step 4 - Data Triangulation
Involves using different sources of information in order to increase the validity of a study
These sources are likely to be stakeholders in a program - participants, other researchers, program staff, other community members, and so on.
Then we put all data in single framework & apply various statistical tools to find out the dynamic on the market.
During the analysis stage, feedback from the stakeholder groups would be compared to determine areas of agreement as well as areas of divergence


