
Key Insights
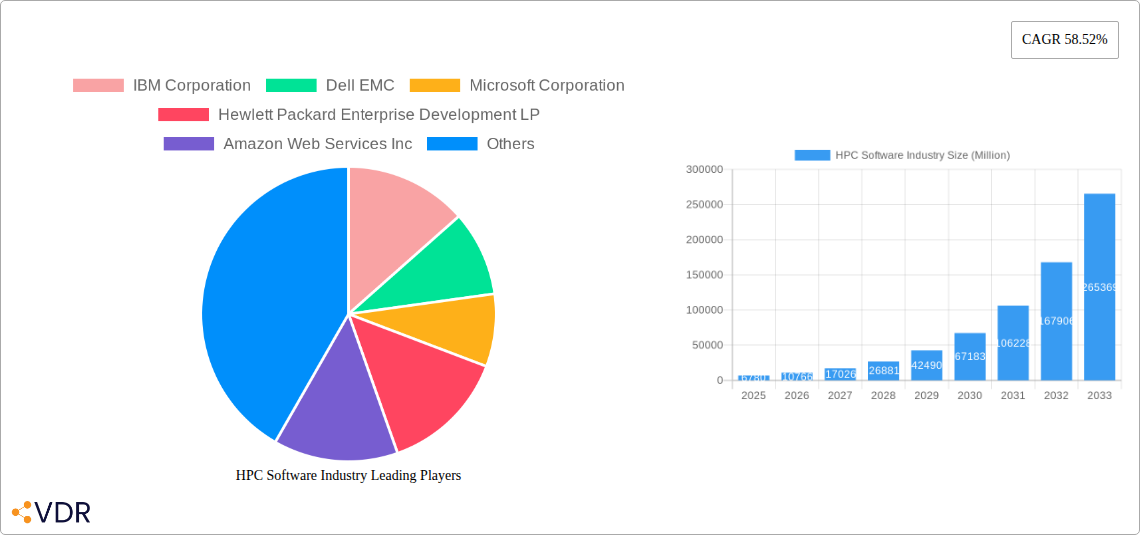
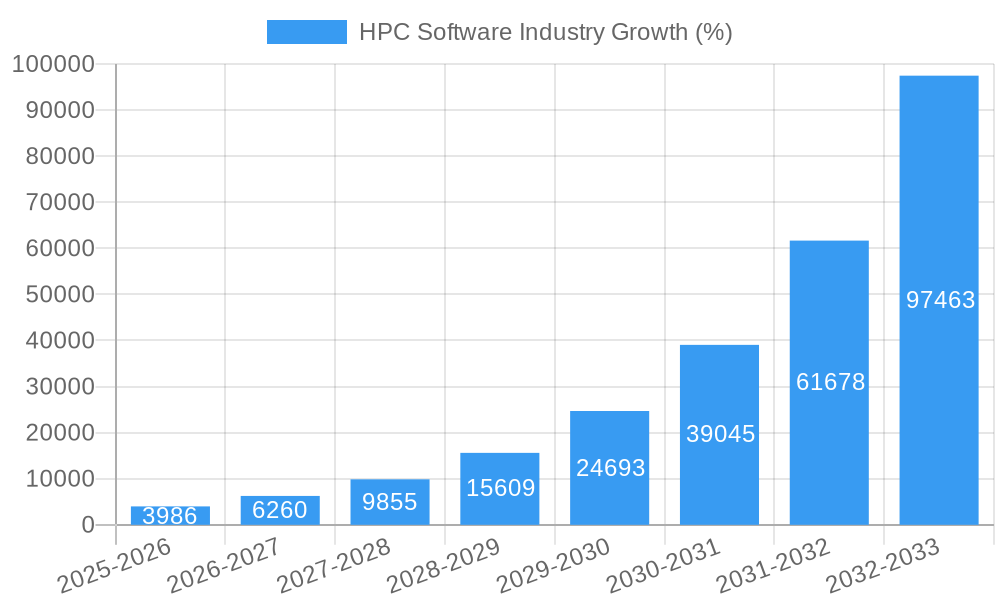
The High-Performance Computing (HPC) software market is experiencing explosive growth, projected to reach \$6.78 billion in 2025 and exhibiting a remarkable Compound Annual Growth Rate (CAGR) of 58.52% from 2025 to 2033. This surge is driven by several key factors. The increasing demand for complex simulations and data analysis across diverse sectors, including aerospace & defense (requiring sophisticated modeling for aircraft design and national security applications), energy & utilities (optimizing power grids and resource management), and life sciences & healthcare (accelerating drug discovery and personalized medicine), fuels market expansion. Furthermore, the shift towards cloud-based HPC solutions offers scalability and cost-effectiveness, attracting a wider range of users. While the on-premise deployment model continues to hold significant market share due to stringent data security and regulatory requirements in some sectors, cloud adoption is rapidly accelerating, particularly among smaller businesses and research institutions. The integration of Artificial Intelligence (AI) and Machine Learning (ML) within HPC software is also a major catalyst, enhancing analytical capabilities and driving innovation.
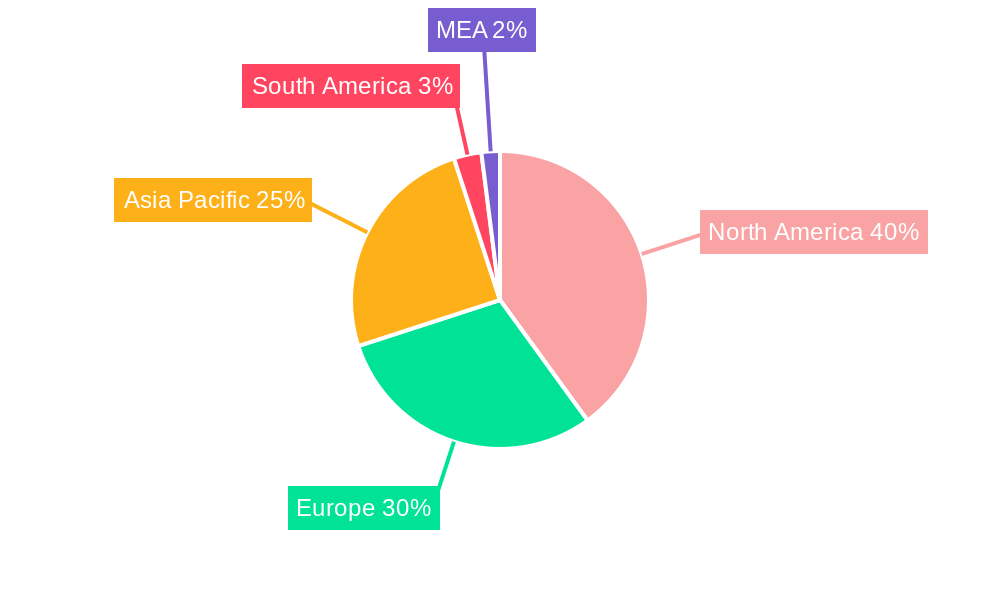
However, the market faces certain challenges. High initial investment costs for both hardware and software can be a barrier to entry for some organizations. The need for specialized expertise to effectively utilize HPC software represents another restraint. Nevertheless, the ongoing advancements in processing power, coupled with the decreasing cost of cloud computing resources, are expected to mitigate these challenges over the forecast period. The market is segmented by industrial application and deployment type, reflecting the diverse needs and capabilities of different users. Leading players like IBM, Dell EMC, Microsoft, and AWS are actively shaping market dynamics through technological advancements and strategic partnerships, furthering innovation and competition within this dynamic sector. The geographical distribution of the market showcases strong growth in North America and Asia-Pacific, fueled by substantial investments in research and development and the presence of major technology hubs.
HPC Software Industry Market Report: 2019-2033
This comprehensive report provides an in-depth analysis of the High-Performance Computing (HPC) software market, encompassing market dynamics, growth trends, regional analysis, competitive landscape, and future outlook. The study period covers 2019-2033, with 2025 as the base and estimated year. The market is segmented by industrial application (Aerospace & Defense, Energy & Utilities, BFSI, Media & Entertainment, Manufacturing, Life-science & Healthcare, Design & Engineering, Other Industrial Applications) and deployment type (On-premise, Cloud). Key players include IBM Corporation, Dell EMC, Microsoft Corporation, Hewlett Packard Enterprise Development LP, Amazon Web Services Inc, ANSYS Inc, Oracle Corporation, Google Inc, Intel Corporation, and Dassault Systemes. The report projects a market value of xx Million in 2025, with a CAGR of xx% during the forecast period (2025-2033).
HPC Software Industry Market Dynamics & Structure
The HPC software market is characterized by a moderately concentrated structure, with a few dominant players holding significant market share. Technological innovation, particularly in areas like AI, machine learning, and cloud computing, is a primary growth driver. Stringent data privacy regulations and cybersecurity concerns influence market dynamics, while the emergence of open-source alternatives creates competitive pressure. Market consolidation is evident through mergers and acquisitions (M&A), with an estimated xx M&A deals in the historical period (2019-2024), indicating a trend towards market consolidation. End-user demographics are shifting towards increased adoption across diverse industries, driven by the need for enhanced computational capabilities.
- Market Concentration: The top 5 players hold approximately xx% of the market share in 2025.
- Innovation Drivers: AI/ML integration, cloud-native architectures, and advancements in parallel processing.
- Regulatory Landscape: Compliance with data privacy regulations (GDPR, CCPA) is a key factor.
- Competitive Substitutes: Open-source software solutions and alternative cloud platforms.
- M&A Activity: An average of xx M&A deals per year during 2019-2024.
- Innovation Barriers: High development costs, specialized skills shortage, and complex integration challenges.
HPC Software Industry Growth Trends & Insights
The HPC software market experienced significant growth during the historical period (2019-2024), driven by increased demand across various sectors. The market size expanded from xx Million in 2019 to xx Million in 2024, exhibiting a CAGR of xx%. The adoption rate of HPC software is increasing, particularly in cloud-based deployments, due to scalability and cost-effectiveness. Technological disruptions, such as the rise of quantum computing and specialized hardware accelerators, are reshaping the market landscape. Consumer behavior is shifting towards subscription-based models and demand for integrated solutions. The forecast period (2025-2033) is expected to witness continued growth, driven by sustained technological advancements and expanding applications across diverse industries. Market penetration is expected to reach xx% by 2033.
Dominant Regions, Countries, or Segments in HPC Software Industry
North America currently holds the largest market share in the HPC software industry, driven by strong technological advancements, robust R&D investments, and the presence of major technology players. Within industrial applications, the Manufacturing, Aerospace & Defense, and Life-science & Healthcare sectors exhibit high growth potential, due to increasing data volumes and complex simulations required for product development and research. Cloud-based deployments are gaining significant traction, driven by its scalability and cost efficiency.
- Key Drivers: Strong government funding in R&D, technological advancements, and industry-specific initiatives (e.g., smart manufacturing).
- Dominance Factors: High technology adoption rate, well-established infrastructure, and presence of major HPC software vendors.
- Growth Potential: Asia-Pacific and Europe are expected to show significant growth, driven by rising adoption rates across diverse industrial sectors. The cloud segment shows the highest growth potential.
HPC Software Industry Product Landscape
The HPC software market offers a wide range of products, including high-performance computing frameworks (e.g., MPI, OpenMP), parallel programming tools, data analytics platforms, and simulation software. Product innovations focus on improved scalability, performance optimization, and enhanced user experience. Unique selling propositions include seamless integration with cloud platforms, AI/ML capabilities, and advanced visualization tools. Technological advancements are driven by advancements in parallel processing techniques, hardware acceleration, and specialized algorithms.
Key Drivers, Barriers & Challenges in HPC Software Industry
Key Drivers:
- Rising demand for data analytics and simulation in various industries.
- Increasing adoption of cloud computing for HPC workloads.
- Advancements in AI/ML and their integration with HPC software.
Challenges & Restraints:
- High costs associated with HPC infrastructure and software.
- Complexity of deploying and managing HPC systems.
- Shortage of skilled professionals in HPC technologies.
Emerging Opportunities in HPC Software Industry
- Growth in the adoption of HPC in emerging markets.
- Development of specialized HPC solutions for specific industry needs.
- Increasing demand for HPC-as-a-service models.
Growth Accelerators in the HPC Software Industry
Technological advancements, strategic partnerships between hardware and software providers, and expansion into new geographical markets are major growth catalysts for the HPC software industry. Government initiatives promoting digital transformation and investment in high-performance computing infrastructure are also driving market expansion.
Key Players Shaping the HPC Software Industry Market
- IBM Corporation
- Dell EMC
- Microsoft Corporation
- Hewlett Packard Enterprise Development LP
- Amazon Web Services Inc
- ANSYS Inc
- Oracle Corporation
- Google Inc
- Intel Corporation
- Dassault Systemes
Notable Milestones in HPC Software Industry Sector
- June 2022: The U.S. Army awarded a USD 699 million contract to BAE Systems for the High-Performance Computing Modernization Program (HPCMP). This highlights the significant investment in HPC infrastructure by government organizations.
- May 2023: BlackBerry QNX launched QNX SDP 8.0, an ultra-scalable, HPC-ready operating system for next-generation vehicles and IoT systems. This signifies the expanding application of HPC in embedded systems.
In-Depth HPC Software Industry Market Outlook
The HPC software market is poised for sustained growth driven by technological breakthroughs in areas like quantum computing and AI/ML. Strategic partnerships and collaborations are becoming increasingly crucial for market players to leverage expertise and expand their reach. The focus on cloud-based HPC solutions and the rising adoption across diverse sectors will drive significant market expansion in the forecast period. Opportunities exist for players who can effectively address the challenges of cost optimization, skills gaps, and complex system integration.
HPC Software Industry Segmentation
-
1. Deployment Type
- 1.1. On-premise
- 1.2. Cloud
-
2. Industrial Application
- 2.1. Aerospace & Defense
- 2.2. Energy & Utilities
- 2.3. BFSI
- 2.4. Media & Entertainment
- 2.5. Manufacturing
- 2.6. Life-science & Healthcare
- 2.7. Design & Engineering
- 2.8. Other Industrial Applications
HPC Software Industry Segmentation By Geography
- 1. North America
- 2. Europe
- 3. Asia Pacific
- 4. Latin America
- 5. Middle East
HPC Software Industry REPORT HIGHLIGHTS
| Aspects | Details |
|---|---|
| Study Period | 2019-2033 |
| Base Year | 2024 |
| Estimated Year | 2025 |
| Forecast Period | 2025-2033 |
| Historical Period | 2019-2024 |
| Growth Rate | CAGR of 58.52% from 2019-2033 |
| Segmentation |
|
Table of Contents
- 1. Introduction
- 1.1. Research Scope
- 1.2. Market Segmentation
- 1.3. Research Methodology
- 1.4. Definitions and Assumptions
- 2. Executive Summary
- 2.1. Introduction
- 3. Market Dynamics
- 3.1. Introduction
- 3.2. Market Drivers
- 3.2.1. Cloud Based High-Performance Computing Software is Driving the Growth; Innovation in Virtualization Technology; Expansion and Diversification of IT Industry
- 3.3. Market Restrains
- 3.3.1. Data Security Concerns in High Availability Cloud Model
- 3.4. Market Trends
- 3.4.1. Cloud Based High-Performance Computing Software is Driving the Growth
- 4. Market Factor Analysis
- 4.1. Porters Five Forces
- 4.2. Supply/Value Chain
- 4.3. PESTEL analysis
- 4.4. Market Entropy
- 4.5. Patent/Trademark Analysis
- 5. Global HPC Software Industry Analysis, Insights and Forecast, 2019-2031
- 5.1. Market Analysis, Insights and Forecast - by Deployment Type
- 5.1.1. On-premise
- 5.1.2. Cloud
- 5.2. Market Analysis, Insights and Forecast - by Industrial Application
- 5.2.1. Aerospace & Defense
- 5.2.2. Energy & Utilities
- 5.2.3. BFSI
- 5.2.4. Media & Entertainment
- 5.2.5. Manufacturing
- 5.2.6. Life-science & Healthcare
- 5.2.7. Design & Engineering
- 5.2.8. Other Industrial Applications
- 5.3. Market Analysis, Insights and Forecast - by Region
- 5.3.1. North America
- 5.3.2. Europe
- 5.3.3. Asia Pacific
- 5.3.4. Latin America
- 5.3.5. Middle East
- 5.1. Market Analysis, Insights and Forecast - by Deployment Type
- 6. North America HPC Software Industry Analysis, Insights and Forecast, 2019-2031
- 6.1. Market Analysis, Insights and Forecast - by Deployment Type
- 6.1.1. On-premise
- 6.1.2. Cloud
- 6.2. Market Analysis, Insights and Forecast - by Industrial Application
- 6.2.1. Aerospace & Defense
- 6.2.2. Energy & Utilities
- 6.2.3. BFSI
- 6.2.4. Media & Entertainment
- 6.2.5. Manufacturing
- 6.2.6. Life-science & Healthcare
- 6.2.7. Design & Engineering
- 6.2.8. Other Industrial Applications
- 6.1. Market Analysis, Insights and Forecast - by Deployment Type
- 7. Europe HPC Software Industry Analysis, Insights and Forecast, 2019-2031
- 7.1. Market Analysis, Insights and Forecast - by Deployment Type
- 7.1.1. On-premise
- 7.1.2. Cloud
- 7.2. Market Analysis, Insights and Forecast - by Industrial Application
- 7.2.1. Aerospace & Defense
- 7.2.2. Energy & Utilities
- 7.2.3. BFSI
- 7.2.4. Media & Entertainment
- 7.2.5. Manufacturing
- 7.2.6. Life-science & Healthcare
- 7.2.7. Design & Engineering
- 7.2.8. Other Industrial Applications
- 7.1. Market Analysis, Insights and Forecast - by Deployment Type
- 8. Asia Pacific HPC Software Industry Analysis, Insights and Forecast, 2019-2031
- 8.1. Market Analysis, Insights and Forecast - by Deployment Type
- 8.1.1. On-premise
- 8.1.2. Cloud
- 8.2. Market Analysis, Insights and Forecast - by Industrial Application
- 8.2.1. Aerospace & Defense
- 8.2.2. Energy & Utilities
- 8.2.3. BFSI
- 8.2.4. Media & Entertainment
- 8.2.5. Manufacturing
- 8.2.6. Life-science & Healthcare
- 8.2.7. Design & Engineering
- 8.2.8. Other Industrial Applications
- 8.1. Market Analysis, Insights and Forecast - by Deployment Type
- 9. Latin America HPC Software Industry Analysis, Insights and Forecast, 2019-2031
- 9.1. Market Analysis, Insights and Forecast - by Deployment Type
- 9.1.1. On-premise
- 9.1.2. Cloud
- 9.2. Market Analysis, Insights and Forecast - by Industrial Application
- 9.2.1. Aerospace & Defense
- 9.2.2. Energy & Utilities
- 9.2.3. BFSI
- 9.2.4. Media & Entertainment
- 9.2.5. Manufacturing
- 9.2.6. Life-science & Healthcare
- 9.2.7. Design & Engineering
- 9.2.8. Other Industrial Applications
- 9.1. Market Analysis, Insights and Forecast - by Deployment Type
- 10. Middle East HPC Software Industry Analysis, Insights and Forecast, 2019-2031
- 10.1. Market Analysis, Insights and Forecast - by Deployment Type
- 10.1.1. On-premise
- 10.1.2. Cloud
- 10.2. Market Analysis, Insights and Forecast - by Industrial Application
- 10.2.1. Aerospace & Defense
- 10.2.2. Energy & Utilities
- 10.2.3. BFSI
- 10.2.4. Media & Entertainment
- 10.2.5. Manufacturing
- 10.2.6. Life-science & Healthcare
- 10.2.7. Design & Engineering
- 10.2.8. Other Industrial Applications
- 10.1. Market Analysis, Insights and Forecast - by Deployment Type
- 11. North America HPC Software Industry Analysis, Insights and Forecast, 2019-2031
- 11.1. Market Analysis, Insights and Forecast - By Country/Sub-region
- 11.1.1 United States
- 11.1.2 Canada
- 11.1.3 Mexico
- 12. Europe HPC Software Industry Analysis, Insights and Forecast, 2019-2031
- 12.1. Market Analysis, Insights and Forecast - By Country/Sub-region
- 12.1.1 Germany
- 12.1.2 United Kingdom
- 12.1.3 France
- 12.1.4 Spain
- 12.1.5 Italy
- 12.1.6 Spain
- 12.1.7 Belgium
- 12.1.8 Netherland
- 12.1.9 Nordics
- 12.1.10 Rest of Europe
- 13. Asia Pacific HPC Software Industry Analysis, Insights and Forecast, 2019-2031
- 13.1. Market Analysis, Insights and Forecast - By Country/Sub-region
- 13.1.1 China
- 13.1.2 Japan
- 13.1.3 India
- 13.1.4 South Korea
- 13.1.5 Southeast Asia
- 13.1.6 Australia
- 13.1.7 Indonesia
- 13.1.8 Phillipes
- 13.1.9 Singapore
- 13.1.10 Thailandc
- 13.1.11 Rest of Asia Pacific
- 14. South America HPC Software Industry Analysis, Insights and Forecast, 2019-2031
- 14.1. Market Analysis, Insights and Forecast - By Country/Sub-region
- 14.1.1 Brazil
- 14.1.2 Argentina
- 14.1.3 Peru
- 14.1.4 Chile
- 14.1.5 Colombia
- 14.1.6 Ecuador
- 14.1.7 Venezuela
- 14.1.8 Rest of South America
- 15. North America HPC Software Industry Analysis, Insights and Forecast, 2019-2031
- 15.1. Market Analysis, Insights and Forecast - By Country/Sub-region
- 15.1.1 United States
- 15.1.2 Canada
- 15.1.3 Mexico
- 16. MEA HPC Software Industry Analysis, Insights and Forecast, 2019-2031
- 16.1. Market Analysis, Insights and Forecast - By Country/Sub-region
- 16.1.1 United Arab Emirates
- 16.1.2 Saudi Arabia
- 16.1.3 South Africa
- 16.1.4 Rest of Middle East and Africa
- 17. Competitive Analysis
- 17.1. Global Market Share Analysis 2024
- 17.2. Company Profiles
- 17.2.1 IBM Corporation
- 17.2.1.1. Overview
- 17.2.1.2. Products
- 17.2.1.3. SWOT Analysis
- 17.2.1.4. Recent Developments
- 17.2.1.5. Financials (Based on Availability)
- 17.2.2 Dell EMC
- 17.2.2.1. Overview
- 17.2.2.2. Products
- 17.2.2.3. SWOT Analysis
- 17.2.2.4. Recent Developments
- 17.2.2.5. Financials (Based on Availability)
- 17.2.3 Microsoft Corporation
- 17.2.3.1. Overview
- 17.2.3.2. Products
- 17.2.3.3. SWOT Analysis
- 17.2.3.4. Recent Developments
- 17.2.3.5. Financials (Based on Availability)
- 17.2.4 Hewlett Packard Enterprise Development LP
- 17.2.4.1. Overview
- 17.2.4.2. Products
- 17.2.4.3. SWOT Analysis
- 17.2.4.4. Recent Developments
- 17.2.4.5. Financials (Based on Availability)
- 17.2.5 Amazon Web Services Inc
- 17.2.5.1. Overview
- 17.2.5.2. Products
- 17.2.5.3. SWOT Analysis
- 17.2.5.4. Recent Developments
- 17.2.5.5. Financials (Based on Availability)
- 17.2.6 ANSYS Inc
- 17.2.6.1. Overview
- 17.2.6.2. Products
- 17.2.6.3. SWOT Analysis
- 17.2.6.4. Recent Developments
- 17.2.6.5. Financials (Based on Availability)
- 17.2.7 Oracle Corporation
- 17.2.7.1. Overview
- 17.2.7.2. Products
- 17.2.7.3. SWOT Analysis
- 17.2.7.4. Recent Developments
- 17.2.7.5. Financials (Based on Availability)
- 17.2.8 Google Inc
- 17.2.8.1. Overview
- 17.2.8.2. Products
- 17.2.8.3. SWOT Analysis
- 17.2.8.4. Recent Developments
- 17.2.8.5. Financials (Based on Availability)
- 17.2.9 Intel Corporation
- 17.2.9.1. Overview
- 17.2.9.2. Products
- 17.2.9.3. SWOT Analysis
- 17.2.9.4. Recent Developments
- 17.2.9.5. Financials (Based on Availability)
- 17.2.10 Dassault Systemes
- 17.2.10.1. Overview
- 17.2.10.2. Products
- 17.2.10.3. SWOT Analysis
- 17.2.10.4. Recent Developments
- 17.2.10.5. Financials (Based on Availability)
- 17.2.1 IBM Corporation
List of Figures
- Figure 1: Global HPC Software Industry Revenue Breakdown (Million, %) by Region 2024 & 2032
- Figure 2: Global HPC Software Industry Volume Breakdown (K Unit, %) by Region 2024 & 2032
- Figure 3: North America HPC Software Industry Revenue (Million), by Country 2024 & 2032
- Figure 4: North America HPC Software Industry Volume (K Unit), by Country 2024 & 2032
- Figure 5: North America HPC Software Industry Revenue Share (%), by Country 2024 & 2032
- Figure 6: North America HPC Software Industry Volume Share (%), by Country 2024 & 2032
- Figure 7: Europe HPC Software Industry Revenue (Million), by Country 2024 & 2032
- Figure 8: Europe HPC Software Industry Volume (K Unit), by Country 2024 & 2032
- Figure 9: Europe HPC Software Industry Revenue Share (%), by Country 2024 & 2032
- Figure 10: Europe HPC Software Industry Volume Share (%), by Country 2024 & 2032
- Figure 11: Asia Pacific HPC Software Industry Revenue (Million), by Country 2024 & 2032
- Figure 12: Asia Pacific HPC Software Industry Volume (K Unit), by Country 2024 & 2032
- Figure 13: Asia Pacific HPC Software Industry Revenue Share (%), by Country 2024 & 2032
- Figure 14: Asia Pacific HPC Software Industry Volume Share (%), by Country 2024 & 2032
- Figure 15: South America HPC Software Industry Revenue (Million), by Country 2024 & 2032
- Figure 16: South America HPC Software Industry Volume (K Unit), by Country 2024 & 2032
- Figure 17: South America HPC Software Industry Revenue Share (%), by Country 2024 & 2032
- Figure 18: South America HPC Software Industry Volume Share (%), by Country 2024 & 2032
- Figure 19: North America HPC Software Industry Revenue (Million), by Country 2024 & 2032
- Figure 20: North America HPC Software Industry Volume (K Unit), by Country 2024 & 2032
- Figure 21: North America HPC Software Industry Revenue Share (%), by Country 2024 & 2032
- Figure 22: North America HPC Software Industry Volume Share (%), by Country 2024 & 2032
- Figure 23: MEA HPC Software Industry Revenue (Million), by Country 2024 & 2032
- Figure 24: MEA HPC Software Industry Volume (K Unit), by Country 2024 & 2032
- Figure 25: MEA HPC Software Industry Revenue Share (%), by Country 2024 & 2032
- Figure 26: MEA HPC Software Industry Volume Share (%), by Country 2024 & 2032
- Figure 27: North America HPC Software Industry Revenue (Million), by Deployment Type 2024 & 2032
- Figure 28: North America HPC Software Industry Volume (K Unit), by Deployment Type 2024 & 2032
- Figure 29: North America HPC Software Industry Revenue Share (%), by Deployment Type 2024 & 2032
- Figure 30: North America HPC Software Industry Volume Share (%), by Deployment Type 2024 & 2032
- Figure 31: North America HPC Software Industry Revenue (Million), by Industrial Application 2024 & 2032
- Figure 32: North America HPC Software Industry Volume (K Unit), by Industrial Application 2024 & 2032
- Figure 33: North America HPC Software Industry Revenue Share (%), by Industrial Application 2024 & 2032
- Figure 34: North America HPC Software Industry Volume Share (%), by Industrial Application 2024 & 2032
- Figure 35: North America HPC Software Industry Revenue (Million), by Country 2024 & 2032
- Figure 36: North America HPC Software Industry Volume (K Unit), by Country 2024 & 2032
- Figure 37: North America HPC Software Industry Revenue Share (%), by Country 2024 & 2032
- Figure 38: North America HPC Software Industry Volume Share (%), by Country 2024 & 2032
- Figure 39: Europe HPC Software Industry Revenue (Million), by Deployment Type 2024 & 2032
- Figure 40: Europe HPC Software Industry Volume (K Unit), by Deployment Type 2024 & 2032
- Figure 41: Europe HPC Software Industry Revenue Share (%), by Deployment Type 2024 & 2032
- Figure 42: Europe HPC Software Industry Volume Share (%), by Deployment Type 2024 & 2032
- Figure 43: Europe HPC Software Industry Revenue (Million), by Industrial Application 2024 & 2032
- Figure 44: Europe HPC Software Industry Volume (K Unit), by Industrial Application 2024 & 2032
- Figure 45: Europe HPC Software Industry Revenue Share (%), by Industrial Application 2024 & 2032
- Figure 46: Europe HPC Software Industry Volume Share (%), by Industrial Application 2024 & 2032
- Figure 47: Europe HPC Software Industry Revenue (Million), by Country 2024 & 2032
- Figure 48: Europe HPC Software Industry Volume (K Unit), by Country 2024 & 2032
- Figure 49: Europe HPC Software Industry Revenue Share (%), by Country 2024 & 2032
- Figure 50: Europe HPC Software Industry Volume Share (%), by Country 2024 & 2032
- Figure 51: Asia Pacific HPC Software Industry Revenue (Million), by Deployment Type 2024 & 2032
- Figure 52: Asia Pacific HPC Software Industry Volume (K Unit), by Deployment Type 2024 & 2032
- Figure 53: Asia Pacific HPC Software Industry Revenue Share (%), by Deployment Type 2024 & 2032
- Figure 54: Asia Pacific HPC Software Industry Volume Share (%), by Deployment Type 2024 & 2032
- Figure 55: Asia Pacific HPC Software Industry Revenue (Million), by Industrial Application 2024 & 2032
- Figure 56: Asia Pacific HPC Software Industry Volume (K Unit), by Industrial Application 2024 & 2032
- Figure 57: Asia Pacific HPC Software Industry Revenue Share (%), by Industrial Application 2024 & 2032
- Figure 58: Asia Pacific HPC Software Industry Volume Share (%), by Industrial Application 2024 & 2032
- Figure 59: Asia Pacific HPC Software Industry Revenue (Million), by Country 2024 & 2032
- Figure 60: Asia Pacific HPC Software Industry Volume (K Unit), by Country 2024 & 2032
- Figure 61: Asia Pacific HPC Software Industry Revenue Share (%), by Country 2024 & 2032
- Figure 62: Asia Pacific HPC Software Industry Volume Share (%), by Country 2024 & 2032
- Figure 63: Latin America HPC Software Industry Revenue (Million), by Deployment Type 2024 & 2032
- Figure 64: Latin America HPC Software Industry Volume (K Unit), by Deployment Type 2024 & 2032
- Figure 65: Latin America HPC Software Industry Revenue Share (%), by Deployment Type 2024 & 2032
- Figure 66: Latin America HPC Software Industry Volume Share (%), by Deployment Type 2024 & 2032
- Figure 67: Latin America HPC Software Industry Revenue (Million), by Industrial Application 2024 & 2032
- Figure 68: Latin America HPC Software Industry Volume (K Unit), by Industrial Application 2024 & 2032
- Figure 69: Latin America HPC Software Industry Revenue Share (%), by Industrial Application 2024 & 2032
- Figure 70: Latin America HPC Software Industry Volume Share (%), by Industrial Application 2024 & 2032
- Figure 71: Latin America HPC Software Industry Revenue (Million), by Country 2024 & 2032
- Figure 72: Latin America HPC Software Industry Volume (K Unit), by Country 2024 & 2032
- Figure 73: Latin America HPC Software Industry Revenue Share (%), by Country 2024 & 2032
- Figure 74: Latin America HPC Software Industry Volume Share (%), by Country 2024 & 2032
- Figure 75: Middle East HPC Software Industry Revenue (Million), by Deployment Type 2024 & 2032
- Figure 76: Middle East HPC Software Industry Volume (K Unit), by Deployment Type 2024 & 2032
- Figure 77: Middle East HPC Software Industry Revenue Share (%), by Deployment Type 2024 & 2032
- Figure 78: Middle East HPC Software Industry Volume Share (%), by Deployment Type 2024 & 2032
- Figure 79: Middle East HPC Software Industry Revenue (Million), by Industrial Application 2024 & 2032
- Figure 80: Middle East HPC Software Industry Volume (K Unit), by Industrial Application 2024 & 2032
- Figure 81: Middle East HPC Software Industry Revenue Share (%), by Industrial Application 2024 & 2032
- Figure 82: Middle East HPC Software Industry Volume Share (%), by Industrial Application 2024 & 2032
- Figure 83: Middle East HPC Software Industry Revenue (Million), by Country 2024 & 2032
- Figure 84: Middle East HPC Software Industry Volume (K Unit), by Country 2024 & 2032
- Figure 85: Middle East HPC Software Industry Revenue Share (%), by Country 2024 & 2032
- Figure 86: Middle East HPC Software Industry Volume Share (%), by Country 2024 & 2032
List of Tables
- Table 1: Global HPC Software Industry Revenue Million Forecast, by Region 2019 & 2032
- Table 2: Global HPC Software Industry Volume K Unit Forecast, by Region 2019 & 2032
- Table 3: Global HPC Software Industry Revenue Million Forecast, by Deployment Type 2019 & 2032
- Table 4: Global HPC Software Industry Volume K Unit Forecast, by Deployment Type 2019 & 2032
- Table 5: Global HPC Software Industry Revenue Million Forecast, by Industrial Application 2019 & 2032
- Table 6: Global HPC Software Industry Volume K Unit Forecast, by Industrial Application 2019 & 2032
- Table 7: Global HPC Software Industry Revenue Million Forecast, by Region 2019 & 2032
- Table 8: Global HPC Software Industry Volume K Unit Forecast, by Region 2019 & 2032
- Table 9: Global HPC Software Industry Revenue Million Forecast, by Country 2019 & 2032
- Table 10: Global HPC Software Industry Volume K Unit Forecast, by Country 2019 & 2032
- Table 11: United States HPC Software Industry Revenue (Million) Forecast, by Application 2019 & 2032
- Table 12: United States HPC Software Industry Volume (K Unit) Forecast, by Application 2019 & 2032
- Table 13: Canada HPC Software Industry Revenue (Million) Forecast, by Application 2019 & 2032
- Table 14: Canada HPC Software Industry Volume (K Unit) Forecast, by Application 2019 & 2032
- Table 15: Mexico HPC Software Industry Revenue (Million) Forecast, by Application 2019 & 2032
- Table 16: Mexico HPC Software Industry Volume (K Unit) Forecast, by Application 2019 & 2032
- Table 17: Global HPC Software Industry Revenue Million Forecast, by Country 2019 & 2032
- Table 18: Global HPC Software Industry Volume K Unit Forecast, by Country 2019 & 2032
- Table 19: Germany HPC Software Industry Revenue (Million) Forecast, by Application 2019 & 2032
- Table 20: Germany HPC Software Industry Volume (K Unit) Forecast, by Application 2019 & 2032
- Table 21: United Kingdom HPC Software Industry Revenue (Million) Forecast, by Application 2019 & 2032
- Table 22: United Kingdom HPC Software Industry Volume (K Unit) Forecast, by Application 2019 & 2032
- Table 23: France HPC Software Industry Revenue (Million) Forecast, by Application 2019 & 2032
- Table 24: France HPC Software Industry Volume (K Unit) Forecast, by Application 2019 & 2032
- Table 25: Spain HPC Software Industry Revenue (Million) Forecast, by Application 2019 & 2032
- Table 26: Spain HPC Software Industry Volume (K Unit) Forecast, by Application 2019 & 2032
- Table 27: Italy HPC Software Industry Revenue (Million) Forecast, by Application 2019 & 2032
- Table 28: Italy HPC Software Industry Volume (K Unit) Forecast, by Application 2019 & 2032
- Table 29: Spain HPC Software Industry Revenue (Million) Forecast, by Application 2019 & 2032
- Table 30: Spain HPC Software Industry Volume (K Unit) Forecast, by Application 2019 & 2032
- Table 31: Belgium HPC Software Industry Revenue (Million) Forecast, by Application 2019 & 2032
- Table 32: Belgium HPC Software Industry Volume (K Unit) Forecast, by Application 2019 & 2032
- Table 33: Netherland HPC Software Industry Revenue (Million) Forecast, by Application 2019 & 2032
- Table 34: Netherland HPC Software Industry Volume (K Unit) Forecast, by Application 2019 & 2032
- Table 35: Nordics HPC Software Industry Revenue (Million) Forecast, by Application 2019 & 2032
- Table 36: Nordics HPC Software Industry Volume (K Unit) Forecast, by Application 2019 & 2032
- Table 37: Rest of Europe HPC Software Industry Revenue (Million) Forecast, by Application 2019 & 2032
- Table 38: Rest of Europe HPC Software Industry Volume (K Unit) Forecast, by Application 2019 & 2032
- Table 39: Global HPC Software Industry Revenue Million Forecast, by Country 2019 & 2032
- Table 40: Global HPC Software Industry Volume K Unit Forecast, by Country 2019 & 2032
- Table 41: China HPC Software Industry Revenue (Million) Forecast, by Application 2019 & 2032
- Table 42: China HPC Software Industry Volume (K Unit) Forecast, by Application 2019 & 2032
- Table 43: Japan HPC Software Industry Revenue (Million) Forecast, by Application 2019 & 2032
- Table 44: Japan HPC Software Industry Volume (K Unit) Forecast, by Application 2019 & 2032
- Table 45: India HPC Software Industry Revenue (Million) Forecast, by Application 2019 & 2032
- Table 46: India HPC Software Industry Volume (K Unit) Forecast, by Application 2019 & 2032
- Table 47: South Korea HPC Software Industry Revenue (Million) Forecast, by Application 2019 & 2032
- Table 48: South Korea HPC Software Industry Volume (K Unit) Forecast, by Application 2019 & 2032
- Table 49: Southeast Asia HPC Software Industry Revenue (Million) Forecast, by Application 2019 & 2032
- Table 50: Southeast Asia HPC Software Industry Volume (K Unit) Forecast, by Application 2019 & 2032
- Table 51: Australia HPC Software Industry Revenue (Million) Forecast, by Application 2019 & 2032
- Table 52: Australia HPC Software Industry Volume (K Unit) Forecast, by Application 2019 & 2032
- Table 53: Indonesia HPC Software Industry Revenue (Million) Forecast, by Application 2019 & 2032
- Table 54: Indonesia HPC Software Industry Volume (K Unit) Forecast, by Application 2019 & 2032
- Table 55: Phillipes HPC Software Industry Revenue (Million) Forecast, by Application 2019 & 2032
- Table 56: Phillipes HPC Software Industry Volume (K Unit) Forecast, by Application 2019 & 2032
- Table 57: Singapore HPC Software Industry Revenue (Million) Forecast, by Application 2019 & 2032
- Table 58: Singapore HPC Software Industry Volume (K Unit) Forecast, by Application 2019 & 2032
- Table 59: Thailandc HPC Software Industry Revenue (Million) Forecast, by Application 2019 & 2032
- Table 60: Thailandc HPC Software Industry Volume (K Unit) Forecast, by Application 2019 & 2032
- Table 61: Rest of Asia Pacific HPC Software Industry Revenue (Million) Forecast, by Application 2019 & 2032
- Table 62: Rest of Asia Pacific HPC Software Industry Volume (K Unit) Forecast, by Application 2019 & 2032
- Table 63: Global HPC Software Industry Revenue Million Forecast, by Country 2019 & 2032
- Table 64: Global HPC Software Industry Volume K Unit Forecast, by Country 2019 & 2032
- Table 65: Brazil HPC Software Industry Revenue (Million) Forecast, by Application 2019 & 2032
- Table 66: Brazil HPC Software Industry Volume (K Unit) Forecast, by Application 2019 & 2032
- Table 67: Argentina HPC Software Industry Revenue (Million) Forecast, by Application 2019 & 2032
- Table 68: Argentina HPC Software Industry Volume (K Unit) Forecast, by Application 2019 & 2032
- Table 69: Peru HPC Software Industry Revenue (Million) Forecast, by Application 2019 & 2032
- Table 70: Peru HPC Software Industry Volume (K Unit) Forecast, by Application 2019 & 2032
- Table 71: Chile HPC Software Industry Revenue (Million) Forecast, by Application 2019 & 2032
- Table 72: Chile HPC Software Industry Volume (K Unit) Forecast, by Application 2019 & 2032
- Table 73: Colombia HPC Software Industry Revenue (Million) Forecast, by Application 2019 & 2032
- Table 74: Colombia HPC Software Industry Volume (K Unit) Forecast, by Application 2019 & 2032
- Table 75: Ecuador HPC Software Industry Revenue (Million) Forecast, by Application 2019 & 2032
- Table 76: Ecuador HPC Software Industry Volume (K Unit) Forecast, by Application 2019 & 2032
- Table 77: Venezuela HPC Software Industry Revenue (Million) Forecast, by Application 2019 & 2032
- Table 78: Venezuela HPC Software Industry Volume (K Unit) Forecast, by Application 2019 & 2032
- Table 79: Rest of South America HPC Software Industry Revenue (Million) Forecast, by Application 2019 & 2032
- Table 80: Rest of South America HPC Software Industry Volume (K Unit) Forecast, by Application 2019 & 2032
- Table 81: Global HPC Software Industry Revenue Million Forecast, by Country 2019 & 2032
- Table 82: Global HPC Software Industry Volume K Unit Forecast, by Country 2019 & 2032
- Table 83: United States HPC Software Industry Revenue (Million) Forecast, by Application 2019 & 2032
- Table 84: United States HPC Software Industry Volume (K Unit) Forecast, by Application 2019 & 2032
- Table 85: Canada HPC Software Industry Revenue (Million) Forecast, by Application 2019 & 2032
- Table 86: Canada HPC Software Industry Volume (K Unit) Forecast, by Application 2019 & 2032
- Table 87: Mexico HPC Software Industry Revenue (Million) Forecast, by Application 2019 & 2032
- Table 88: Mexico HPC Software Industry Volume (K Unit) Forecast, by Application 2019 & 2032
- Table 89: Global HPC Software Industry Revenue Million Forecast, by Country 2019 & 2032
- Table 90: Global HPC Software Industry Volume K Unit Forecast, by Country 2019 & 2032
- Table 91: United Arab Emirates HPC Software Industry Revenue (Million) Forecast, by Application 2019 & 2032
- Table 92: United Arab Emirates HPC Software Industry Volume (K Unit) Forecast, by Application 2019 & 2032
- Table 93: Saudi Arabia HPC Software Industry Revenue (Million) Forecast, by Application 2019 & 2032
- Table 94: Saudi Arabia HPC Software Industry Volume (K Unit) Forecast, by Application 2019 & 2032
- Table 95: South Africa HPC Software Industry Revenue (Million) Forecast, by Application 2019 & 2032
- Table 96: South Africa HPC Software Industry Volume (K Unit) Forecast, by Application 2019 & 2032
- Table 97: Rest of Middle East and Africa HPC Software Industry Revenue (Million) Forecast, by Application 2019 & 2032
- Table 98: Rest of Middle East and Africa HPC Software Industry Volume (K Unit) Forecast, by Application 2019 & 2032
- Table 99: Global HPC Software Industry Revenue Million Forecast, by Deployment Type 2019 & 2032
- Table 100: Global HPC Software Industry Volume K Unit Forecast, by Deployment Type 2019 & 2032
- Table 101: Global HPC Software Industry Revenue Million Forecast, by Industrial Application 2019 & 2032
- Table 102: Global HPC Software Industry Volume K Unit Forecast, by Industrial Application 2019 & 2032
- Table 103: Global HPC Software Industry Revenue Million Forecast, by Country 2019 & 2032
- Table 104: Global HPC Software Industry Volume K Unit Forecast, by Country 2019 & 2032
- Table 105: Global HPC Software Industry Revenue Million Forecast, by Deployment Type 2019 & 2032
- Table 106: Global HPC Software Industry Volume K Unit Forecast, by Deployment Type 2019 & 2032
- Table 107: Global HPC Software Industry Revenue Million Forecast, by Industrial Application 2019 & 2032
- Table 108: Global HPC Software Industry Volume K Unit Forecast, by Industrial Application 2019 & 2032
- Table 109: Global HPC Software Industry Revenue Million Forecast, by Country 2019 & 2032
- Table 110: Global HPC Software Industry Volume K Unit Forecast, by Country 2019 & 2032
- Table 111: Global HPC Software Industry Revenue Million Forecast, by Deployment Type 2019 & 2032
- Table 112: Global HPC Software Industry Volume K Unit Forecast, by Deployment Type 2019 & 2032
- Table 113: Global HPC Software Industry Revenue Million Forecast, by Industrial Application 2019 & 2032
- Table 114: Global HPC Software Industry Volume K Unit Forecast, by Industrial Application 2019 & 2032
- Table 115: Global HPC Software Industry Revenue Million Forecast, by Country 2019 & 2032
- Table 116: Global HPC Software Industry Volume K Unit Forecast, by Country 2019 & 2032
- Table 117: Global HPC Software Industry Revenue Million Forecast, by Deployment Type 2019 & 2032
- Table 118: Global HPC Software Industry Volume K Unit Forecast, by Deployment Type 2019 & 2032
- Table 119: Global HPC Software Industry Revenue Million Forecast, by Industrial Application 2019 & 2032
- Table 120: Global HPC Software Industry Volume K Unit Forecast, by Industrial Application 2019 & 2032
- Table 121: Global HPC Software Industry Revenue Million Forecast, by Country 2019 & 2032
- Table 122: Global HPC Software Industry Volume K Unit Forecast, by Country 2019 & 2032
- Table 123: Global HPC Software Industry Revenue Million Forecast, by Deployment Type 2019 & 2032
- Table 124: Global HPC Software Industry Volume K Unit Forecast, by Deployment Type 2019 & 2032
- Table 125: Global HPC Software Industry Revenue Million Forecast, by Industrial Application 2019 & 2032
- Table 126: Global HPC Software Industry Volume K Unit Forecast, by Industrial Application 2019 & 2032
- Table 127: Global HPC Software Industry Revenue Million Forecast, by Country 2019 & 2032
- Table 128: Global HPC Software Industry Volume K Unit Forecast, by Country 2019 & 2032
Frequently Asked Questions
1. What is the projected Compound Annual Growth Rate (CAGR) of the HPC Software Industry?
The projected CAGR is approximately 58.52%.
2. Which companies are prominent players in the HPC Software Industry?
Key companies in the market include IBM Corporation, Dell EMC, Microsoft Corporation, Hewlett Packard Enterprise Development LP, Amazon Web Services Inc, ANSYS Inc, Oracle Corporation, Google Inc, Intel Corporation, Dassault Systemes.
3. What are the main segments of the HPC Software Industry?
The market segments include Deployment Type, Industrial Application.
4. Can you provide details about the market size?
The market size is estimated to be USD 6.78 Million as of 2022.
5. What are some drivers contributing to market growth?
Cloud Based High-Performance Computing Software is Driving the Growth; Innovation in Virtualization Technology; Expansion and Diversification of IT Industry.
6. What are the notable trends driving market growth?
Cloud Based High-Performance Computing Software is Driving the Growth.
7. Are there any restraints impacting market growth?
Data Security Concerns in High Availability Cloud Model.
8. Can you provide examples of recent developments in the market?
May 2023: BlackBerry QNX announced the launch of an ultra-scalable, High-Performance compute-ready operating system, QNX Software Development Platform (SDP) 8.0, to advance software development efforts for next-generation vehicles and IoT systems.
9. What pricing options are available for accessing the report?
Pricing options include single-user, multi-user, and enterprise licenses priced at USD 4750, USD 5250, and USD 8750 respectively.
10. Is the market size provided in terms of value or volume?
The market size is provided in terms of value, measured in Million and volume, measured in K Unit.
11. Are there any specific market keywords associated with the report?
Yes, the market keyword associated with the report is "HPC Software Industry," which aids in identifying and referencing the specific market segment covered.
12. How do I determine which pricing option suits my needs best?
The pricing options vary based on user requirements and access needs. Individual users may opt for single-user licenses, while businesses requiring broader access may choose multi-user or enterprise licenses for cost-effective access to the report.
13. Are there any additional resources or data provided in the HPC Software Industry report?
While the report offers comprehensive insights, it's advisable to review the specific contents or supplementary materials provided to ascertain if additional resources or data are available.
14. How can I stay updated on further developments or reports in the HPC Software Industry?
To stay informed about further developments, trends, and reports in the HPC Software Industry, consider subscribing to industry newsletters, following relevant companies and organizations, or regularly checking reputable industry news sources and publications.
Methodology
Step 1 - Identification of Relevant Samples Size from Population Database


Step 2 - Approaches for Defining Global Market Size (Value, Volume* & Price*)

Note*: In applicable scenarios
Step 3 - Data Sources
Primary Research
- Web Analytics
- Survey Reports
- Research Institute
- Latest Research Reports
- Opinion Leaders
Secondary Research
- Annual Reports
- White Paper
- Latest Press Release
- Industry Association
- Paid Database
- Investor Presentations

Step 4 - Data Triangulation
Involves using different sources of information in order to increase the validity of a study
These sources are likely to be stakeholders in a program - participants, other researchers, program staff, other community members, and so on.
Then we put all data in single framework & apply various statistical tools to find out the dynamic on the market.
During the analysis stage, feedback from the stakeholder groups would be compared to determine areas of agreement as well as areas of divergence


