
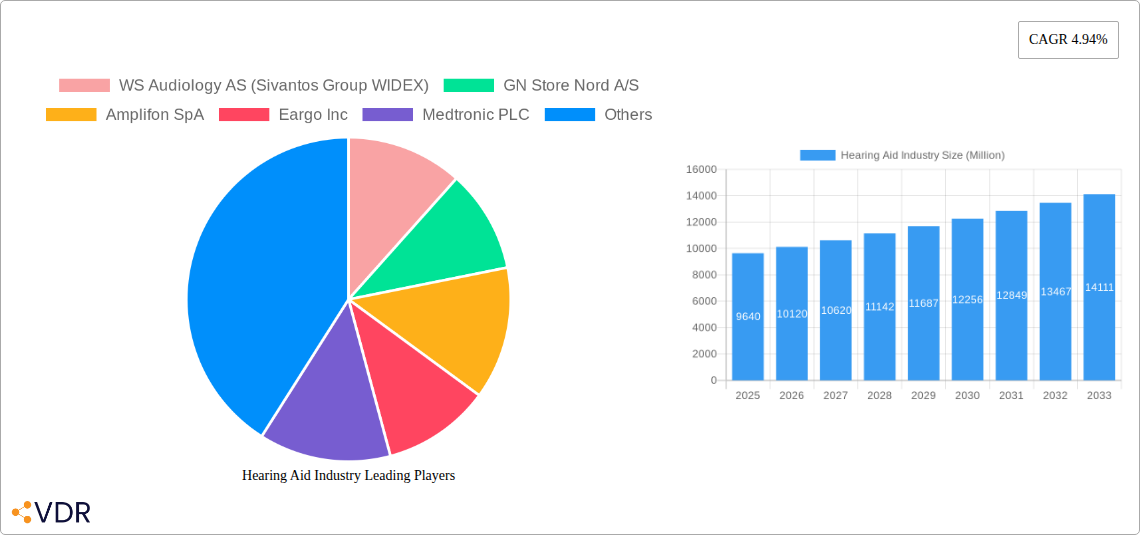
Key Insights
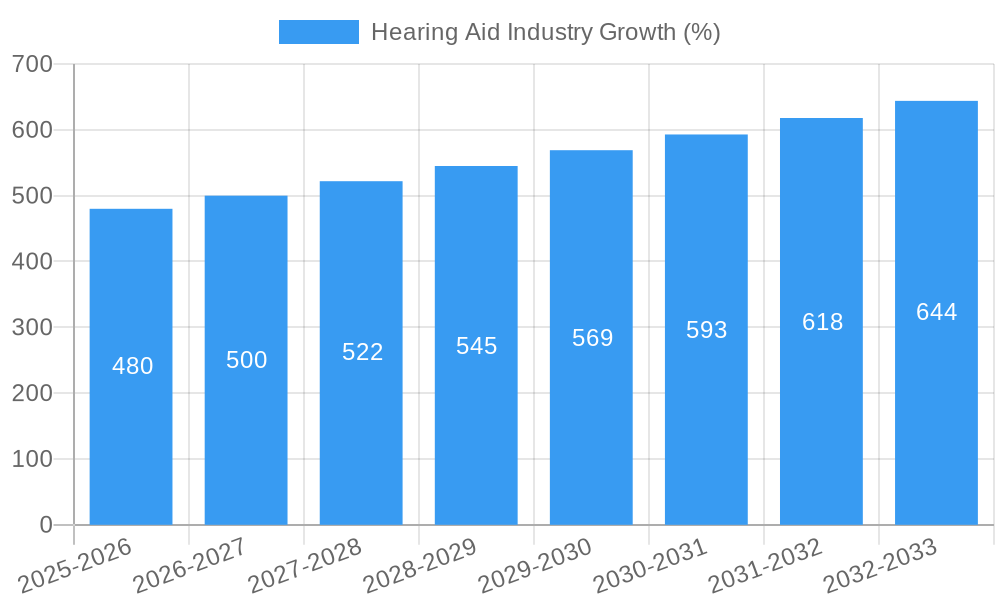
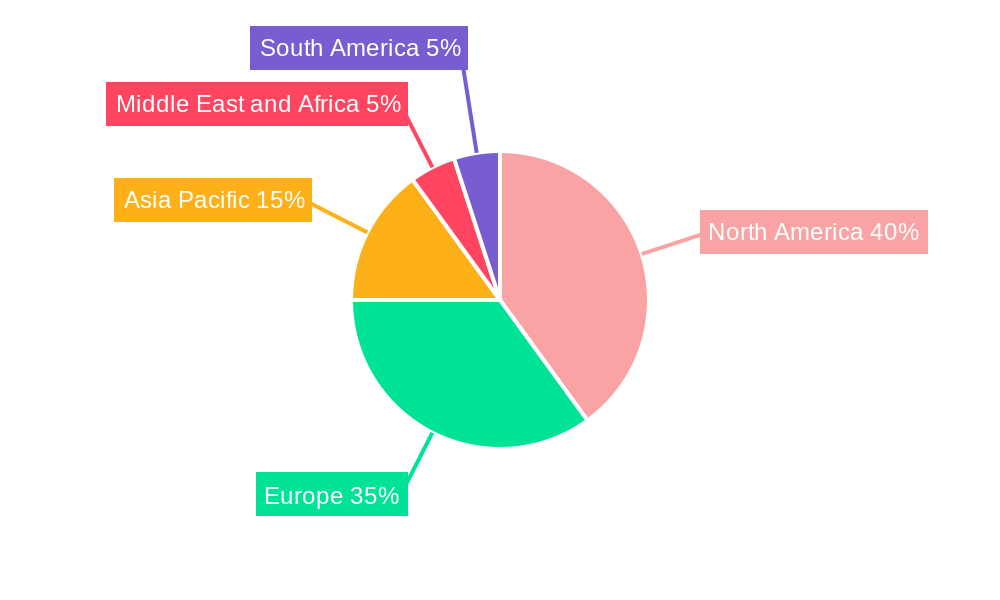
The global hearing aid market, valued at $9.64 billion in 2025, is projected to experience robust growth, driven by a rising geriatric population, increasing awareness about hearing loss, and advancements in hearing aid technology. The market's Compound Annual Growth Rate (CAGR) of 4.94% from 2019 to 2024 indicates a steady upward trajectory, expected to continue through 2033. Key growth drivers include the miniaturization and sophistication of digital hearing aids, offering improved sound quality, connectivity features (like Bluetooth), and discreet designs catering to user preferences. Technological advancements such as rechargeable batteries and artificial intelligence-powered noise reduction are further fueling market expansion. The market is segmented by product type (BTE, RITE/RIC, ITE, CIC, others), type of hearing loss (sensorineural, conductive), technology (conventional, digital), and patient type (adults, pediatrics). The digital hearing aid segment holds significant market share due to its superior features and growing affordability. North America and Europe currently dominate the market, driven by higher healthcare spending and greater awareness; however, Asia-Pacific is poised for substantial growth due to its expanding elderly population and rising disposable incomes.
Market restraints include the high cost of advanced hearing aids, particularly in developing economies, and the lack of universal healthcare coverage for hearing aids in many regions. This necessitates the development of cost-effective solutions and greater advocacy for accessibility. Competitive intensity is high, with major players like WS Audiology, GN Store Nord, Amplifon, Sonova, and Starkey continually investing in research and development, product innovation, and strategic acquisitions to enhance their market position. The industry is expected to witness consolidation and strategic partnerships in the coming years, further shaping the competitive landscape. Future growth will be contingent upon addressing affordability issues, expanding access to hearing care services, particularly in underserved regions, and continuing to develop innovative technologies that improve hearing aid efficacy and user experience.
Hearing Aid Industry Market Report: 2019-2033
This comprehensive report provides a detailed analysis of the global hearing aid market, encompassing market dynamics, growth trends, regional segmentation, product landscape, challenges, opportunities, and key players. The study period covers 2019-2033, with 2025 as the base and estimated year. The report leverages extensive data and analysis to provide actionable insights for industry professionals, investors, and stakeholders. The market is segmented by product type (Behind the Ear (BTE), Receiver in the Ear (RITE)/Receiver in Canal (RIC), In the Ear (ITE), Completely-in canal (CIC), Other Hearing Aid Devices), type of hearing loss (Sensorineural Hearing Loss, Conductive Hearing Loss), technology (Conventional Hearing Aids, Digital Hearing Aids), and patient type (Adults, Pediatrics/Children). The parent market is the medical device industry, with the hearing aid sector being a key child market.
Hearing Aid Industry Market Dynamics & Structure
The global hearing aid market is characterized by moderate concentration, with key players holding significant market share. Technological innovation, particularly in digital hearing aids and connectivity features, is a major driver. Stringent regulatory frameworks concerning safety and efficacy influence market access and product development. Competitive pressures from substitute products like personal sound amplification products (PSAPs) and emerging over-the-counter (OTC) hearing aids are also significant factors. The aging global population is a major driver of market growth, particularly in the adult patient segment. M&A activity in the past five years has been significant, with xx deals recorded, contributing to market consolidation.
- Market Concentration: Highly concentrated, with top 5 players holding approximately xx% market share in 2024.
- Technological Innovation: Focus on smaller, smarter, and more connected devices; AI-powered features are gaining traction.
- Regulatory Framework: Varying regulations across countries create complexities for market entry and product approval.
- Competitive Substitutes: PSAPs offer a low-cost alternative, impacting the lower end of the market.
- End-User Demographics: Aging population driving demand, with adults >65 years representing the largest segment.
- M&A Trends: Consolidation through mergers and acquisitions to enhance market reach and product portfolio.
Hearing Aid Industry Growth Trends & Insights
The global hearing aid market experienced significant growth during the historical period (2019-2024), with a CAGR of xx%. This growth is attributed to factors such as rising prevalence of hearing loss, increasing awareness about hearing health, technological advancements, and improved accessibility. The market is expected to maintain steady growth during the forecast period (2025-2033), driven by the aging population, increasing disposable incomes in developing countries, and the rising adoption of digital hearing aids. Market penetration, especially in emerging markets, remains relatively low, presenting substantial growth opportunities. Technological disruptions, such as the emergence of OTC hearing aids, are likely to reshape the competitive landscape. Consumer behavior shifts towards personalized and connected devices further fuel market growth. The market size is projected to reach xx million units by 2033.
Dominant Regions, Countries, or Segments in Hearing Aid Industry
North America and Western Europe currently dominate the hearing aid market, driven by high healthcare expenditure, strong regulatory frameworks supporting advanced medical devices and high awareness. However, Asia-Pacific is projected to exhibit the highest growth rate during the forecast period due to a rapidly aging population, improving healthcare infrastructure, and rising disposable incomes. Within product types, the Behind-the-Ear (BTE) and Receiver-in-the-Canal (RIC) segments hold the largest market shares due to their versatility and fitting options. Sensorineural hearing loss is the dominant type of hearing loss addressed by hearing aids, accounting for the majority of the market. Digital hearing aids currently dominate, although the market for conventional hearing aids remains a niche segment. The adult segment is the largest market by patient type.
- Key Drivers: High healthcare expenditure in developed regions, rising awareness of hearing loss, technological advancements.
- Dominance Factors: Established healthcare infrastructure, high per capita income, strong regulatory support.
- Growth Potential: Untapped market potential in developing economies, particularly in Asia-Pacific and Latin America.
Hearing Aid Industry Product Landscape
The hearing aid market features a diverse range of products, categorized primarily by style (BTE, RITE/RIC, ITE, CIC), technology (analog, digital), and features (connectivity, noise reduction, directional microphones). Continuous innovation focuses on improving sound quality, reducing size and enhancing user comfort and convenience. Technological advancements, including Bluetooth connectivity, rechargeable batteries, and artificial intelligence-driven features, are driving product differentiation and market expansion. Unique selling propositions include personalized sound processing, seamless smartphone integration, and improved noise cancellation capabilities.
Key Drivers, Barriers & Challenges in Hearing Aid Industry
Key Drivers:
- The aging global population is the primary driver of market growth.
- Technological advancements, such as smaller, smarter, and more connected hearing aids.
- Rising awareness and improved accessibility of hearing care services.
Key Challenges and Restraints:
- High cost of hearing aids limits access, especially in developing countries. This affects the market penetration rate and limits growth potential.
- Stringent regulatory approvals can delay product launches and increase development costs, hindering rapid innovation.
- Intense competition among established players and new entrants increases pressure on margins and pricing strategies.
Emerging Opportunities in Hearing Aid Industry
- Growing demand for discreet and personalized hearing solutions.
- Expansion of telehealth platforms to improve access to hearing care.
- Integration of AI and machine learning for improved sound processing and personalized user experience.
- Penetration into underserved markets in developing countries.
Growth Accelerators in the Hearing Aid Industry
Technological breakthroughs in miniaturization, sound processing, and connectivity will be crucial. Strategic partnerships between hearing aid manufacturers and technology companies can lead to innovative solutions. Market expansion strategies focusing on emerging markets and underserved populations will also drive significant growth.
Key Players Shaping the Hearing Aid Market
- WS Audiology AS (Sivantos Group WIDEX)
- GN Store Nord A/S
- Amplifon SpA
- Eargo Inc
- Medtronic PLC
- Sonova Holding AG
- Starkey Hearing Technologies
- Cochlear Ltd
- Demant AS
- Audina Hearing Instruments Inc
- MED-EL
- Horentek Hearing Diagnostics
Notable Milestones in Hearing Aid Industry Sector
- October 2022: Sony Electronics launched its first OTC hearing aids in the US market, marking a significant shift towards wider accessibility.
- July 2022: LINNER introduced NOVA, an antibacterial hearing aid, addressing hygiene concerns and potentially expanding the market to users with specific needs.
In-Depth Hearing Aid Industry Market Outlook
The hearing aid market is poised for robust growth, driven by continued technological advancements, an aging global population, and increasing awareness of hearing loss. Strategic opportunities lie in expanding into underserved markets, developing innovative products with enhanced connectivity and personalization, and leveraging telehealth to improve access to hearing care services. The market's future trajectory is positive, with significant potential for growth and innovation.
Hearing Aid Industry Segmentation
-
1. Product Type
- 1.1. Behind the Ear (BTE)
- 1.2. Receiver
- 1.3. In the Ear (ITE)
- 1.4. Completely-in canal (CIC)
- 1.5. Other Hearing Aid Devices
-
2. Type of Hearing Loss
- 2.1. Sensorineural Hearing Loss
- 2.2. Conductive Hearing Loss
-
3. Technology
- 3.1. Conventional Hearing Aids
- 3.2. Digital Hearing Aids
-
4. Patient Type
- 4.1. Adults
- 4.2. Pediatrics/Children
Hearing Aid Industry Segmentation By Geography
-
1. North America
- 1.1. United States
- 1.2. Canada
- 1.3. Mexico
-
2. Europe
- 2.1. Germany
- 2.2. United Kingdom
- 2.3. France
- 2.4. Italy
- 2.5. Spain
- 2.6. Rest of Europe
-
3. Asia Pacific
- 3.1. China
- 3.2. Japan
- 3.3. India
- 3.4. Australia
- 3.5. South Korea
- 3.6. Rest of Asia Pacific
-
4. Middle East and Africa
- 4.1. GCC
- 4.2. South Africa
- 4.3. Rest of Middle East and Africa
-
5. South America
- 5.1. Brazil
- 5.2. Argentina
- 5.3. Rest of South America
Hearing Aid Industry REPORT HIGHLIGHTS
| Aspects | Details |
|---|---|
| Study Period | 2019-2033 |
| Base Year | 2024 |
| Estimated Year | 2025 |
| Forecast Period | 2025-2033 |
| Historical Period | 2019-2024 |
| Growth Rate | CAGR of 4.94% from 2019-2033 |
| Segmentation |
|
Table of Contents
- 1. Introduction
- 1.1. Research Scope
- 1.2. Market Segmentation
- 1.3. Research Methodology
- 1.4. Definitions and Assumptions
- 2. Executive Summary
- 2.1. Introduction
- 3. Market Dynamics
- 3.1. Introduction
- 3.2. Market Drivers
- 3.2.1. Rising Burden of Hearing Loss; Technological Advancements in Hearing Aid Devices; Rising Awareness and Initiatives about Hearing Aid Devices
- 3.3. Market Restrains
- 3.3.1. High Cost of Hearing Aid Devices and the Presence of Substitute Products
- 3.4. Market Trends
- 3.4.1. Behind the Ear (BTE) Segment is Expected to Hold a Significant Market Share in the Product Type Segment Over the Forecast Period
- 4. Market Factor Analysis
- 4.1. Porters Five Forces
- 4.2. Supply/Value Chain
- 4.3. PESTEL analysis
- 4.4. Market Entropy
- 4.5. Patent/Trademark Analysis
- 5. Global Hearing Aid Industry Analysis, Insights and Forecast, 2019-2031
- 5.1. Market Analysis, Insights and Forecast - by Product Type
- 5.1.1. Behind the Ear (BTE)
- 5.1.2. Receiver
- 5.1.3. In the Ear (ITE)
- 5.1.4. Completely-in canal (CIC)
- 5.1.5. Other Hearing Aid Devices
- 5.2. Market Analysis, Insights and Forecast - by Type of Hearing Loss
- 5.2.1. Sensorineural Hearing Loss
- 5.2.2. Conductive Hearing Loss
- 5.3. Market Analysis, Insights and Forecast - by Technology
- 5.3.1. Conventional Hearing Aids
- 5.3.2. Digital Hearing Aids
- 5.4. Market Analysis, Insights and Forecast - by Patient Type
- 5.4.1. Adults
- 5.4.2. Pediatrics/Children
- 5.5. Market Analysis, Insights and Forecast - by Region
- 5.5.1. North America
- 5.5.2. Europe
- 5.5.3. Asia Pacific
- 5.5.4. Middle East and Africa
- 5.5.5. South America
- 5.1. Market Analysis, Insights and Forecast - by Product Type
- 6. North America Hearing Aid Industry Analysis, Insights and Forecast, 2019-2031
- 6.1. Market Analysis, Insights and Forecast - by Product Type
- 6.1.1. Behind the Ear (BTE)
- 6.1.2. Receiver
- 6.1.3. In the Ear (ITE)
- 6.1.4. Completely-in canal (CIC)
- 6.1.5. Other Hearing Aid Devices
- 6.2. Market Analysis, Insights and Forecast - by Type of Hearing Loss
- 6.2.1. Sensorineural Hearing Loss
- 6.2.2. Conductive Hearing Loss
- 6.3. Market Analysis, Insights and Forecast - by Technology
- 6.3.1. Conventional Hearing Aids
- 6.3.2. Digital Hearing Aids
- 6.4. Market Analysis, Insights and Forecast - by Patient Type
- 6.4.1. Adults
- 6.4.2. Pediatrics/Children
- 6.1. Market Analysis, Insights and Forecast - by Product Type
- 7. Europe Hearing Aid Industry Analysis, Insights and Forecast, 2019-2031
- 7.1. Market Analysis, Insights and Forecast - by Product Type
- 7.1.1. Behind the Ear (BTE)
- 7.1.2. Receiver
- 7.1.3. In the Ear (ITE)
- 7.1.4. Completely-in canal (CIC)
- 7.1.5. Other Hearing Aid Devices
- 7.2. Market Analysis, Insights and Forecast - by Type of Hearing Loss
- 7.2.1. Sensorineural Hearing Loss
- 7.2.2. Conductive Hearing Loss
- 7.3. Market Analysis, Insights and Forecast - by Technology
- 7.3.1. Conventional Hearing Aids
- 7.3.2. Digital Hearing Aids
- 7.4. Market Analysis, Insights and Forecast - by Patient Type
- 7.4.1. Adults
- 7.4.2. Pediatrics/Children
- 7.1. Market Analysis, Insights and Forecast - by Product Type
- 8. Asia Pacific Hearing Aid Industry Analysis, Insights and Forecast, 2019-2031
- 8.1. Market Analysis, Insights and Forecast - by Product Type
- 8.1.1. Behind the Ear (BTE)
- 8.1.2. Receiver
- 8.1.3. In the Ear (ITE)
- 8.1.4. Completely-in canal (CIC)
- 8.1.5. Other Hearing Aid Devices
- 8.2. Market Analysis, Insights and Forecast - by Type of Hearing Loss
- 8.2.1. Sensorineural Hearing Loss
- 8.2.2. Conductive Hearing Loss
- 8.3. Market Analysis, Insights and Forecast - by Technology
- 8.3.1. Conventional Hearing Aids
- 8.3.2. Digital Hearing Aids
- 8.4. Market Analysis, Insights and Forecast - by Patient Type
- 8.4.1. Adults
- 8.4.2. Pediatrics/Children
- 8.1. Market Analysis, Insights and Forecast - by Product Type
- 9. Middle East and Africa Hearing Aid Industry Analysis, Insights and Forecast, 2019-2031
- 9.1. Market Analysis, Insights and Forecast - by Product Type
- 9.1.1. Behind the Ear (BTE)
- 9.1.2. Receiver
- 9.1.3. In the Ear (ITE)
- 9.1.4. Completely-in canal (CIC)
- 9.1.5. Other Hearing Aid Devices
- 9.2. Market Analysis, Insights and Forecast - by Type of Hearing Loss
- 9.2.1. Sensorineural Hearing Loss
- 9.2.2. Conductive Hearing Loss
- 9.3. Market Analysis, Insights and Forecast - by Technology
- 9.3.1. Conventional Hearing Aids
- 9.3.2. Digital Hearing Aids
- 9.4. Market Analysis, Insights and Forecast - by Patient Type
- 9.4.1. Adults
- 9.4.2. Pediatrics/Children
- 9.1. Market Analysis, Insights and Forecast - by Product Type
- 10. South America Hearing Aid Industry Analysis, Insights and Forecast, 2019-2031
- 10.1. Market Analysis, Insights and Forecast - by Product Type
- 10.1.1. Behind the Ear (BTE)
- 10.1.2. Receiver
- 10.1.3. In the Ear (ITE)
- 10.1.4. Completely-in canal (CIC)
- 10.1.5. Other Hearing Aid Devices
- 10.2. Market Analysis, Insights and Forecast - by Type of Hearing Loss
- 10.2.1. Sensorineural Hearing Loss
- 10.2.2. Conductive Hearing Loss
- 10.3. Market Analysis, Insights and Forecast - by Technology
- 10.3.1. Conventional Hearing Aids
- 10.3.2. Digital Hearing Aids
- 10.4. Market Analysis, Insights and Forecast - by Patient Type
- 10.4.1. Adults
- 10.4.2. Pediatrics/Children
- 10.1. Market Analysis, Insights and Forecast - by Product Type
- 11. North America Hearing Aid Industry Analysis, Insights and Forecast, 2019-2031
- 11.1. Market Analysis, Insights and Forecast - By Country/Sub-region
- 11.1.1 United States
- 11.1.2 Canada
- 11.1.3 Mexico
- 12. Europe Hearing Aid Industry Analysis, Insights and Forecast, 2019-2031
- 12.1. Market Analysis, Insights and Forecast - By Country/Sub-region
- 12.1.1 Germany
- 12.1.2 United Kingdom
- 12.1.3 France
- 12.1.4 Italy
- 12.1.5 Spain
- 12.1.6 Rest of Europe
- 13. Asia Pacific Hearing Aid Industry Analysis, Insights and Forecast, 2019-2031
- 13.1. Market Analysis, Insights and Forecast - By Country/Sub-region
- 13.1.1 China
- 13.1.2 Japan
- 13.1.3 India
- 13.1.4 Australia
- 13.1.5 South Korea
- 13.1.6 Rest of Asia Pacific
- 14. Middle East and Africa Hearing Aid Industry Analysis, Insights and Forecast, 2019-2031
- 14.1. Market Analysis, Insights and Forecast - By Country/Sub-region
- 14.1.1 GCC
- 14.1.2 South Africa
- 14.1.3 Rest of Middle East and Africa
- 15. South America Hearing Aid Industry Analysis, Insights and Forecast, 2019-2031
- 15.1. Market Analysis, Insights and Forecast - By Country/Sub-region
- 15.1.1 Brazil
- 15.1.2 Argentina
- 15.1.3 Rest of South America
- 16. Competitive Analysis
- 16.1. Global Market Share Analysis 2024
- 16.2. Company Profiles
- 16.2.1 WS Audiology AS (Sivantos Group WIDEX)
- 16.2.1.1. Overview
- 16.2.1.2. Products
- 16.2.1.3. SWOT Analysis
- 16.2.1.4. Recent Developments
- 16.2.1.5. Financials (Based on Availability)
- 16.2.2 GN Store Nord A/S
- 16.2.2.1. Overview
- 16.2.2.2. Products
- 16.2.2.3. SWOT Analysis
- 16.2.2.4. Recent Developments
- 16.2.2.5. Financials (Based on Availability)
- 16.2.3 Amplifon SpA
- 16.2.3.1. Overview
- 16.2.3.2. Products
- 16.2.3.3. SWOT Analysis
- 16.2.3.4. Recent Developments
- 16.2.3.5. Financials (Based on Availability)
- 16.2.4 Eargo Inc
- 16.2.4.1. Overview
- 16.2.4.2. Products
- 16.2.4.3. SWOT Analysis
- 16.2.4.4. Recent Developments
- 16.2.4.5. Financials (Based on Availability)
- 16.2.5 Medtronic PLC
- 16.2.5.1. Overview
- 16.2.5.2. Products
- 16.2.5.3. SWOT Analysis
- 16.2.5.4. Recent Developments
- 16.2.5.5. Financials (Based on Availability)
- 16.2.6 Sonova Holding AG
- 16.2.6.1. Overview
- 16.2.6.2. Products
- 16.2.6.3. SWOT Analysis
- 16.2.6.4. Recent Developments
- 16.2.6.5. Financials (Based on Availability)
- 16.2.7 Starkey Hearing Technologies
- 16.2.7.1. Overview
- 16.2.7.2. Products
- 16.2.7.3. SWOT Analysis
- 16.2.7.4. Recent Developments
- 16.2.7.5. Financials (Based on Availability)
- 16.2.8 Cochlear Ltd
- 16.2.8.1. Overview
- 16.2.8.2. Products
- 16.2.8.3. SWOT Analysis
- 16.2.8.4. Recent Developments
- 16.2.8.5. Financials (Based on Availability)
- 16.2.9 Demant AS
- 16.2.9.1. Overview
- 16.2.9.2. Products
- 16.2.9.3. SWOT Analysis
- 16.2.9.4. Recent Developments
- 16.2.9.5. Financials (Based on Availability)
- 16.2.10 Audina Hearing Instruments Inc
- 16.2.10.1. Overview
- 16.2.10.2. Products
- 16.2.10.3. SWOT Analysis
- 16.2.10.4. Recent Developments
- 16.2.10.5. Financials (Based on Availability)
- 16.2.11 MED-EL
- 16.2.11.1. Overview
- 16.2.11.2. Products
- 16.2.11.3. SWOT Analysis
- 16.2.11.4. Recent Developments
- 16.2.11.5. Financials (Based on Availability)
- 16.2.12 Horentek Hearing Diagnostics
- 16.2.12.1. Overview
- 16.2.12.2. Products
- 16.2.12.3. SWOT Analysis
- 16.2.12.4. Recent Developments
- 16.2.12.5. Financials (Based on Availability)
- 16.2.1 WS Audiology AS (Sivantos Group WIDEX)
List of Figures
- Figure 1: Global Hearing Aid Industry Revenue Breakdown (Million, %) by Region 2024 & 2032
- Figure 2: Global Hearing Aid Industry Volume Breakdown (K Unit, %) by Region 2024 & 2032
- Figure 3: North America Hearing Aid Industry Revenue (Million), by Country 2024 & 2032
- Figure 4: North America Hearing Aid Industry Volume (K Unit), by Country 2024 & 2032
- Figure 5: North America Hearing Aid Industry Revenue Share (%), by Country 2024 & 2032
- Figure 6: North America Hearing Aid Industry Volume Share (%), by Country 2024 & 2032
- Figure 7: Europe Hearing Aid Industry Revenue (Million), by Country 2024 & 2032
- Figure 8: Europe Hearing Aid Industry Volume (K Unit), by Country 2024 & 2032
- Figure 9: Europe Hearing Aid Industry Revenue Share (%), by Country 2024 & 2032
- Figure 10: Europe Hearing Aid Industry Volume Share (%), by Country 2024 & 2032
- Figure 11: Asia Pacific Hearing Aid Industry Revenue (Million), by Country 2024 & 2032
- Figure 12: Asia Pacific Hearing Aid Industry Volume (K Unit), by Country 2024 & 2032
- Figure 13: Asia Pacific Hearing Aid Industry Revenue Share (%), by Country 2024 & 2032
- Figure 14: Asia Pacific Hearing Aid Industry Volume Share (%), by Country 2024 & 2032
- Figure 15: Middle East and Africa Hearing Aid Industry Revenue (Million), by Country 2024 & 2032
- Figure 16: Middle East and Africa Hearing Aid Industry Volume (K Unit), by Country 2024 & 2032
- Figure 17: Middle East and Africa Hearing Aid Industry Revenue Share (%), by Country 2024 & 2032
- Figure 18: Middle East and Africa Hearing Aid Industry Volume Share (%), by Country 2024 & 2032
- Figure 19: South America Hearing Aid Industry Revenue (Million), by Country 2024 & 2032
- Figure 20: South America Hearing Aid Industry Volume (K Unit), by Country 2024 & 2032
- Figure 21: South America Hearing Aid Industry Revenue Share (%), by Country 2024 & 2032
- Figure 22: South America Hearing Aid Industry Volume Share (%), by Country 2024 & 2032
- Figure 23: North America Hearing Aid Industry Revenue (Million), by Product Type 2024 & 2032
- Figure 24: North America Hearing Aid Industry Volume (K Unit), by Product Type 2024 & 2032
- Figure 25: North America Hearing Aid Industry Revenue Share (%), by Product Type 2024 & 2032
- Figure 26: North America Hearing Aid Industry Volume Share (%), by Product Type 2024 & 2032
- Figure 27: North America Hearing Aid Industry Revenue (Million), by Type of Hearing Loss 2024 & 2032
- Figure 28: North America Hearing Aid Industry Volume (K Unit), by Type of Hearing Loss 2024 & 2032
- Figure 29: North America Hearing Aid Industry Revenue Share (%), by Type of Hearing Loss 2024 & 2032
- Figure 30: North America Hearing Aid Industry Volume Share (%), by Type of Hearing Loss 2024 & 2032
- Figure 31: North America Hearing Aid Industry Revenue (Million), by Technology 2024 & 2032
- Figure 32: North America Hearing Aid Industry Volume (K Unit), by Technology 2024 & 2032
- Figure 33: North America Hearing Aid Industry Revenue Share (%), by Technology 2024 & 2032
- Figure 34: North America Hearing Aid Industry Volume Share (%), by Technology 2024 & 2032
- Figure 35: North America Hearing Aid Industry Revenue (Million), by Patient Type 2024 & 2032
- Figure 36: North America Hearing Aid Industry Volume (K Unit), by Patient Type 2024 & 2032
- Figure 37: North America Hearing Aid Industry Revenue Share (%), by Patient Type 2024 & 2032
- Figure 38: North America Hearing Aid Industry Volume Share (%), by Patient Type 2024 & 2032
- Figure 39: North America Hearing Aid Industry Revenue (Million), by Country 2024 & 2032
- Figure 40: North America Hearing Aid Industry Volume (K Unit), by Country 2024 & 2032
- Figure 41: North America Hearing Aid Industry Revenue Share (%), by Country 2024 & 2032
- Figure 42: North America Hearing Aid Industry Volume Share (%), by Country 2024 & 2032
- Figure 43: Europe Hearing Aid Industry Revenue (Million), by Product Type 2024 & 2032
- Figure 44: Europe Hearing Aid Industry Volume (K Unit), by Product Type 2024 & 2032
- Figure 45: Europe Hearing Aid Industry Revenue Share (%), by Product Type 2024 & 2032
- Figure 46: Europe Hearing Aid Industry Volume Share (%), by Product Type 2024 & 2032
- Figure 47: Europe Hearing Aid Industry Revenue (Million), by Type of Hearing Loss 2024 & 2032
- Figure 48: Europe Hearing Aid Industry Volume (K Unit), by Type of Hearing Loss 2024 & 2032
- Figure 49: Europe Hearing Aid Industry Revenue Share (%), by Type of Hearing Loss 2024 & 2032
- Figure 50: Europe Hearing Aid Industry Volume Share (%), by Type of Hearing Loss 2024 & 2032
- Figure 51: Europe Hearing Aid Industry Revenue (Million), by Technology 2024 & 2032
- Figure 52: Europe Hearing Aid Industry Volume (K Unit), by Technology 2024 & 2032
- Figure 53: Europe Hearing Aid Industry Revenue Share (%), by Technology 2024 & 2032
- Figure 54: Europe Hearing Aid Industry Volume Share (%), by Technology 2024 & 2032
- Figure 55: Europe Hearing Aid Industry Revenue (Million), by Patient Type 2024 & 2032
- Figure 56: Europe Hearing Aid Industry Volume (K Unit), by Patient Type 2024 & 2032
- Figure 57: Europe Hearing Aid Industry Revenue Share (%), by Patient Type 2024 & 2032
- Figure 58: Europe Hearing Aid Industry Volume Share (%), by Patient Type 2024 & 2032
- Figure 59: Europe Hearing Aid Industry Revenue (Million), by Country 2024 & 2032
- Figure 60: Europe Hearing Aid Industry Volume (K Unit), by Country 2024 & 2032
- Figure 61: Europe Hearing Aid Industry Revenue Share (%), by Country 2024 & 2032
- Figure 62: Europe Hearing Aid Industry Volume Share (%), by Country 2024 & 2032
- Figure 63: Asia Pacific Hearing Aid Industry Revenue (Million), by Product Type 2024 & 2032
- Figure 64: Asia Pacific Hearing Aid Industry Volume (K Unit), by Product Type 2024 & 2032
- Figure 65: Asia Pacific Hearing Aid Industry Revenue Share (%), by Product Type 2024 & 2032
- Figure 66: Asia Pacific Hearing Aid Industry Volume Share (%), by Product Type 2024 & 2032
- Figure 67: Asia Pacific Hearing Aid Industry Revenue (Million), by Type of Hearing Loss 2024 & 2032
- Figure 68: Asia Pacific Hearing Aid Industry Volume (K Unit), by Type of Hearing Loss 2024 & 2032
- Figure 69: Asia Pacific Hearing Aid Industry Revenue Share (%), by Type of Hearing Loss 2024 & 2032
- Figure 70: Asia Pacific Hearing Aid Industry Volume Share (%), by Type of Hearing Loss 2024 & 2032
- Figure 71: Asia Pacific Hearing Aid Industry Revenue (Million), by Technology 2024 & 2032
- Figure 72: Asia Pacific Hearing Aid Industry Volume (K Unit), by Technology 2024 & 2032
- Figure 73: Asia Pacific Hearing Aid Industry Revenue Share (%), by Technology 2024 & 2032
- Figure 74: Asia Pacific Hearing Aid Industry Volume Share (%), by Technology 2024 & 2032
- Figure 75: Asia Pacific Hearing Aid Industry Revenue (Million), by Patient Type 2024 & 2032
- Figure 76: Asia Pacific Hearing Aid Industry Volume (K Unit), by Patient Type 2024 & 2032
- Figure 77: Asia Pacific Hearing Aid Industry Revenue Share (%), by Patient Type 2024 & 2032
- Figure 78: Asia Pacific Hearing Aid Industry Volume Share (%), by Patient Type 2024 & 2032
- Figure 79: Asia Pacific Hearing Aid Industry Revenue (Million), by Country 2024 & 2032
- Figure 80: Asia Pacific Hearing Aid Industry Volume (K Unit), by Country 2024 & 2032
- Figure 81: Asia Pacific Hearing Aid Industry Revenue Share (%), by Country 2024 & 2032
- Figure 82: Asia Pacific Hearing Aid Industry Volume Share (%), by Country 2024 & 2032
- Figure 83: Middle East and Africa Hearing Aid Industry Revenue (Million), by Product Type 2024 & 2032
- Figure 84: Middle East and Africa Hearing Aid Industry Volume (K Unit), by Product Type 2024 & 2032
- Figure 85: Middle East and Africa Hearing Aid Industry Revenue Share (%), by Product Type 2024 & 2032
- Figure 86: Middle East and Africa Hearing Aid Industry Volume Share (%), by Product Type 2024 & 2032
- Figure 87: Middle East and Africa Hearing Aid Industry Revenue (Million), by Type of Hearing Loss 2024 & 2032
- Figure 88: Middle East and Africa Hearing Aid Industry Volume (K Unit), by Type of Hearing Loss 2024 & 2032
- Figure 89: Middle East and Africa Hearing Aid Industry Revenue Share (%), by Type of Hearing Loss 2024 & 2032
- Figure 90: Middle East and Africa Hearing Aid Industry Volume Share (%), by Type of Hearing Loss 2024 & 2032
- Figure 91: Middle East and Africa Hearing Aid Industry Revenue (Million), by Technology 2024 & 2032
- Figure 92: Middle East and Africa Hearing Aid Industry Volume (K Unit), by Technology 2024 & 2032
- Figure 93: Middle East and Africa Hearing Aid Industry Revenue Share (%), by Technology 2024 & 2032
- Figure 94: Middle East and Africa Hearing Aid Industry Volume Share (%), by Technology 2024 & 2032
- Figure 95: Middle East and Africa Hearing Aid Industry Revenue (Million), by Patient Type 2024 & 2032
- Figure 96: Middle East and Africa Hearing Aid Industry Volume (K Unit), by Patient Type 2024 & 2032
- Figure 97: Middle East and Africa Hearing Aid Industry Revenue Share (%), by Patient Type 2024 & 2032
- Figure 98: Middle East and Africa Hearing Aid Industry Volume Share (%), by Patient Type 2024 & 2032
- Figure 99: Middle East and Africa Hearing Aid Industry Revenue (Million), by Country 2024 & 2032
- Figure 100: Middle East and Africa Hearing Aid Industry Volume (K Unit), by Country 2024 & 2032
- Figure 101: Middle East and Africa Hearing Aid Industry Revenue Share (%), by Country 2024 & 2032
- Figure 102: Middle East and Africa Hearing Aid Industry Volume Share (%), by Country 2024 & 2032
- Figure 103: South America Hearing Aid Industry Revenue (Million), by Product Type 2024 & 2032
- Figure 104: South America Hearing Aid Industry Volume (K Unit), by Product Type 2024 & 2032
- Figure 105: South America Hearing Aid Industry Revenue Share (%), by Product Type 2024 & 2032
- Figure 106: South America Hearing Aid Industry Volume Share (%), by Product Type 2024 & 2032
- Figure 107: South America Hearing Aid Industry Revenue (Million), by Type of Hearing Loss 2024 & 2032
- Figure 108: South America Hearing Aid Industry Volume (K Unit), by Type of Hearing Loss 2024 & 2032
- Figure 109: South America Hearing Aid Industry Revenue Share (%), by Type of Hearing Loss 2024 & 2032
- Figure 110: South America Hearing Aid Industry Volume Share (%), by Type of Hearing Loss 2024 & 2032
- Figure 111: South America Hearing Aid Industry Revenue (Million), by Technology 2024 & 2032
- Figure 112: South America Hearing Aid Industry Volume (K Unit), by Technology 2024 & 2032
- Figure 113: South America Hearing Aid Industry Revenue Share (%), by Technology 2024 & 2032
- Figure 114: South America Hearing Aid Industry Volume Share (%), by Technology 2024 & 2032
- Figure 115: South America Hearing Aid Industry Revenue (Million), by Patient Type 2024 & 2032
- Figure 116: South America Hearing Aid Industry Volume (K Unit), by Patient Type 2024 & 2032
- Figure 117: South America Hearing Aid Industry Revenue Share (%), by Patient Type 2024 & 2032
- Figure 118: South America Hearing Aid Industry Volume Share (%), by Patient Type 2024 & 2032
- Figure 119: South America Hearing Aid Industry Revenue (Million), by Country 2024 & 2032
- Figure 120: South America Hearing Aid Industry Volume (K Unit), by Country 2024 & 2032
- Figure 121: South America Hearing Aid Industry Revenue Share (%), by Country 2024 & 2032
- Figure 122: South America Hearing Aid Industry Volume Share (%), by Country 2024 & 2032
List of Tables
- Table 1: Global Hearing Aid Industry Revenue Million Forecast, by Region 2019 & 2032
- Table 2: Global Hearing Aid Industry Volume K Unit Forecast, by Region 2019 & 2032
- Table 3: Global Hearing Aid Industry Revenue Million Forecast, by Product Type 2019 & 2032
- Table 4: Global Hearing Aid Industry Volume K Unit Forecast, by Product Type 2019 & 2032
- Table 5: Global Hearing Aid Industry Revenue Million Forecast, by Type of Hearing Loss 2019 & 2032
- Table 6: Global Hearing Aid Industry Volume K Unit Forecast, by Type of Hearing Loss 2019 & 2032
- Table 7: Global Hearing Aid Industry Revenue Million Forecast, by Technology 2019 & 2032
- Table 8: Global Hearing Aid Industry Volume K Unit Forecast, by Technology 2019 & 2032
- Table 9: Global Hearing Aid Industry Revenue Million Forecast, by Patient Type 2019 & 2032
- Table 10: Global Hearing Aid Industry Volume K Unit Forecast, by Patient Type 2019 & 2032
- Table 11: Global Hearing Aid Industry Revenue Million Forecast, by Region 2019 & 2032
- Table 12: Global Hearing Aid Industry Volume K Unit Forecast, by Region 2019 & 2032
- Table 13: Global Hearing Aid Industry Revenue Million Forecast, by Country 2019 & 2032
- Table 14: Global Hearing Aid Industry Volume K Unit Forecast, by Country 2019 & 2032
- Table 15: United States Hearing Aid Industry Revenue (Million) Forecast, by Application 2019 & 2032
- Table 16: United States Hearing Aid Industry Volume (K Unit) Forecast, by Application 2019 & 2032
- Table 17: Canada Hearing Aid Industry Revenue (Million) Forecast, by Application 2019 & 2032
- Table 18: Canada Hearing Aid Industry Volume (K Unit) Forecast, by Application 2019 & 2032
- Table 19: Mexico Hearing Aid Industry Revenue (Million) Forecast, by Application 2019 & 2032
- Table 20: Mexico Hearing Aid Industry Volume (K Unit) Forecast, by Application 2019 & 2032
- Table 21: Global Hearing Aid Industry Revenue Million Forecast, by Country 2019 & 2032
- Table 22: Global Hearing Aid Industry Volume K Unit Forecast, by Country 2019 & 2032
- Table 23: Germany Hearing Aid Industry Revenue (Million) Forecast, by Application 2019 & 2032
- Table 24: Germany Hearing Aid Industry Volume (K Unit) Forecast, by Application 2019 & 2032
- Table 25: United Kingdom Hearing Aid Industry Revenue (Million) Forecast, by Application 2019 & 2032
- Table 26: United Kingdom Hearing Aid Industry Volume (K Unit) Forecast, by Application 2019 & 2032
- Table 27: France Hearing Aid Industry Revenue (Million) Forecast, by Application 2019 & 2032
- Table 28: France Hearing Aid Industry Volume (K Unit) Forecast, by Application 2019 & 2032
- Table 29: Italy Hearing Aid Industry Revenue (Million) Forecast, by Application 2019 & 2032
- Table 30: Italy Hearing Aid Industry Volume (K Unit) Forecast, by Application 2019 & 2032
- Table 31: Spain Hearing Aid Industry Revenue (Million) Forecast, by Application 2019 & 2032
- Table 32: Spain Hearing Aid Industry Volume (K Unit) Forecast, by Application 2019 & 2032
- Table 33: Rest of Europe Hearing Aid Industry Revenue (Million) Forecast, by Application 2019 & 2032
- Table 34: Rest of Europe Hearing Aid Industry Volume (K Unit) Forecast, by Application 2019 & 2032
- Table 35: Global Hearing Aid Industry Revenue Million Forecast, by Country 2019 & 2032
- Table 36: Global Hearing Aid Industry Volume K Unit Forecast, by Country 2019 & 2032
- Table 37: China Hearing Aid Industry Revenue (Million) Forecast, by Application 2019 & 2032
- Table 38: China Hearing Aid Industry Volume (K Unit) Forecast, by Application 2019 & 2032
- Table 39: Japan Hearing Aid Industry Revenue (Million) Forecast, by Application 2019 & 2032
- Table 40: Japan Hearing Aid Industry Volume (K Unit) Forecast, by Application 2019 & 2032
- Table 41: India Hearing Aid Industry Revenue (Million) Forecast, by Application 2019 & 2032
- Table 42: India Hearing Aid Industry Volume (K Unit) Forecast, by Application 2019 & 2032
- Table 43: Australia Hearing Aid Industry Revenue (Million) Forecast, by Application 2019 & 2032
- Table 44: Australia Hearing Aid Industry Volume (K Unit) Forecast, by Application 2019 & 2032
- Table 45: South Korea Hearing Aid Industry Revenue (Million) Forecast, by Application 2019 & 2032
- Table 46: South Korea Hearing Aid Industry Volume (K Unit) Forecast, by Application 2019 & 2032
- Table 47: Rest of Asia Pacific Hearing Aid Industry Revenue (Million) Forecast, by Application 2019 & 2032
- Table 48: Rest of Asia Pacific Hearing Aid Industry Volume (K Unit) Forecast, by Application 2019 & 2032
- Table 49: Global Hearing Aid Industry Revenue Million Forecast, by Country 2019 & 2032
- Table 50: Global Hearing Aid Industry Volume K Unit Forecast, by Country 2019 & 2032
- Table 51: GCC Hearing Aid Industry Revenue (Million) Forecast, by Application 2019 & 2032
- Table 52: GCC Hearing Aid Industry Volume (K Unit) Forecast, by Application 2019 & 2032
- Table 53: South Africa Hearing Aid Industry Revenue (Million) Forecast, by Application 2019 & 2032
- Table 54: South Africa Hearing Aid Industry Volume (K Unit) Forecast, by Application 2019 & 2032
- Table 55: Rest of Middle East and Africa Hearing Aid Industry Revenue (Million) Forecast, by Application 2019 & 2032
- Table 56: Rest of Middle East and Africa Hearing Aid Industry Volume (K Unit) Forecast, by Application 2019 & 2032
- Table 57: Global Hearing Aid Industry Revenue Million Forecast, by Country 2019 & 2032
- Table 58: Global Hearing Aid Industry Volume K Unit Forecast, by Country 2019 & 2032
- Table 59: Brazil Hearing Aid Industry Revenue (Million) Forecast, by Application 2019 & 2032
- Table 60: Brazil Hearing Aid Industry Volume (K Unit) Forecast, by Application 2019 & 2032
- Table 61: Argentina Hearing Aid Industry Revenue (Million) Forecast, by Application 2019 & 2032
- Table 62: Argentina Hearing Aid Industry Volume (K Unit) Forecast, by Application 2019 & 2032
- Table 63: Rest of South America Hearing Aid Industry Revenue (Million) Forecast, by Application 2019 & 2032
- Table 64: Rest of South America Hearing Aid Industry Volume (K Unit) Forecast, by Application 2019 & 2032
- Table 65: Global Hearing Aid Industry Revenue Million Forecast, by Product Type 2019 & 2032
- Table 66: Global Hearing Aid Industry Volume K Unit Forecast, by Product Type 2019 & 2032
- Table 67: Global Hearing Aid Industry Revenue Million Forecast, by Type of Hearing Loss 2019 & 2032
- Table 68: Global Hearing Aid Industry Volume K Unit Forecast, by Type of Hearing Loss 2019 & 2032
- Table 69: Global Hearing Aid Industry Revenue Million Forecast, by Technology 2019 & 2032
- Table 70: Global Hearing Aid Industry Volume K Unit Forecast, by Technology 2019 & 2032
- Table 71: Global Hearing Aid Industry Revenue Million Forecast, by Patient Type 2019 & 2032
- Table 72: Global Hearing Aid Industry Volume K Unit Forecast, by Patient Type 2019 & 2032
- Table 73: Global Hearing Aid Industry Revenue Million Forecast, by Country 2019 & 2032
- Table 74: Global Hearing Aid Industry Volume K Unit Forecast, by Country 2019 & 2032
- Table 75: United States Hearing Aid Industry Revenue (Million) Forecast, by Application 2019 & 2032
- Table 76: United States Hearing Aid Industry Volume (K Unit) Forecast, by Application 2019 & 2032
- Table 77: Canada Hearing Aid Industry Revenue (Million) Forecast, by Application 2019 & 2032
- Table 78: Canada Hearing Aid Industry Volume (K Unit) Forecast, by Application 2019 & 2032
- Table 79: Mexico Hearing Aid Industry Revenue (Million) Forecast, by Application 2019 & 2032
- Table 80: Mexico Hearing Aid Industry Volume (K Unit) Forecast, by Application 2019 & 2032
- Table 81: Global Hearing Aid Industry Revenue Million Forecast, by Product Type 2019 & 2032
- Table 82: Global Hearing Aid Industry Volume K Unit Forecast, by Product Type 2019 & 2032
- Table 83: Global Hearing Aid Industry Revenue Million Forecast, by Type of Hearing Loss 2019 & 2032
- Table 84: Global Hearing Aid Industry Volume K Unit Forecast, by Type of Hearing Loss 2019 & 2032
- Table 85: Global Hearing Aid Industry Revenue Million Forecast, by Technology 2019 & 2032
- Table 86: Global Hearing Aid Industry Volume K Unit Forecast, by Technology 2019 & 2032
- Table 87: Global Hearing Aid Industry Revenue Million Forecast, by Patient Type 2019 & 2032
- Table 88: Global Hearing Aid Industry Volume K Unit Forecast, by Patient Type 2019 & 2032
- Table 89: Global Hearing Aid Industry Revenue Million Forecast, by Country 2019 & 2032
- Table 90: Global Hearing Aid Industry Volume K Unit Forecast, by Country 2019 & 2032
- Table 91: Germany Hearing Aid Industry Revenue (Million) Forecast, by Application 2019 & 2032
- Table 92: Germany Hearing Aid Industry Volume (K Unit) Forecast, by Application 2019 & 2032
- Table 93: United Kingdom Hearing Aid Industry Revenue (Million) Forecast, by Application 2019 & 2032
- Table 94: United Kingdom Hearing Aid Industry Volume (K Unit) Forecast, by Application 2019 & 2032
- Table 95: France Hearing Aid Industry Revenue (Million) Forecast, by Application 2019 & 2032
- Table 96: France Hearing Aid Industry Volume (K Unit) Forecast, by Application 2019 & 2032
- Table 97: Italy Hearing Aid Industry Revenue (Million) Forecast, by Application 2019 & 2032
- Table 98: Italy Hearing Aid Industry Volume (K Unit) Forecast, by Application 2019 & 2032
- Table 99: Spain Hearing Aid Industry Revenue (Million) Forecast, by Application 2019 & 2032
- Table 100: Spain Hearing Aid Industry Volume (K Unit) Forecast, by Application 2019 & 2032
- Table 101: Rest of Europe Hearing Aid Industry Revenue (Million) Forecast, by Application 2019 & 2032
- Table 102: Rest of Europe Hearing Aid Industry Volume (K Unit) Forecast, by Application 2019 & 2032
- Table 103: Global Hearing Aid Industry Revenue Million Forecast, by Product Type 2019 & 2032
- Table 104: Global Hearing Aid Industry Volume K Unit Forecast, by Product Type 2019 & 2032
- Table 105: Global Hearing Aid Industry Revenue Million Forecast, by Type of Hearing Loss 2019 & 2032
- Table 106: Global Hearing Aid Industry Volume K Unit Forecast, by Type of Hearing Loss 2019 & 2032
- Table 107: Global Hearing Aid Industry Revenue Million Forecast, by Technology 2019 & 2032
- Table 108: Global Hearing Aid Industry Volume K Unit Forecast, by Technology 2019 & 2032
- Table 109: Global Hearing Aid Industry Revenue Million Forecast, by Patient Type 2019 & 2032
- Table 110: Global Hearing Aid Industry Volume K Unit Forecast, by Patient Type 2019 & 2032
- Table 111: Global Hearing Aid Industry Revenue Million Forecast, by Country 2019 & 2032
- Table 112: Global Hearing Aid Industry Volume K Unit Forecast, by Country 2019 & 2032
- Table 113: China Hearing Aid Industry Revenue (Million) Forecast, by Application 2019 & 2032
- Table 114: China Hearing Aid Industry Volume (K Unit) Forecast, by Application 2019 & 2032
- Table 115: Japan Hearing Aid Industry Revenue (Million) Forecast, by Application 2019 & 2032
- Table 116: Japan Hearing Aid Industry Volume (K Unit) Forecast, by Application 2019 & 2032
- Table 117: India Hearing Aid Industry Revenue (Million) Forecast, by Application 2019 & 2032
- Table 118: India Hearing Aid Industry Volume (K Unit) Forecast, by Application 2019 & 2032
- Table 119: Australia Hearing Aid Industry Revenue (Million) Forecast, by Application 2019 & 2032
- Table 120: Australia Hearing Aid Industry Volume (K Unit) Forecast, by Application 2019 & 2032
- Table 121: South Korea Hearing Aid Industry Revenue (Million) Forecast, by Application 2019 & 2032
- Table 122: South Korea Hearing Aid Industry Volume (K Unit) Forecast, by Application 2019 & 2032
- Table 123: Rest of Asia Pacific Hearing Aid Industry Revenue (Million) Forecast, by Application 2019 & 2032
- Table 124: Rest of Asia Pacific Hearing Aid Industry Volume (K Unit) Forecast, by Application 2019 & 2032
- Table 125: Global Hearing Aid Industry Revenue Million Forecast, by Product Type 2019 & 2032
- Table 126: Global Hearing Aid Industry Volume K Unit Forecast, by Product Type 2019 & 2032
- Table 127: Global Hearing Aid Industry Revenue Million Forecast, by Type of Hearing Loss 2019 & 2032
- Table 128: Global Hearing Aid Industry Volume K Unit Forecast, by Type of Hearing Loss 2019 & 2032
- Table 129: Global Hearing Aid Industry Revenue Million Forecast, by Technology 2019 & 2032
- Table 130: Global Hearing Aid Industry Volume K Unit Forecast, by Technology 2019 & 2032
- Table 131: Global Hearing Aid Industry Revenue Million Forecast, by Patient Type 2019 & 2032
- Table 132: Global Hearing Aid Industry Volume K Unit Forecast, by Patient Type 2019 & 2032
- Table 133: Global Hearing Aid Industry Revenue Million Forecast, by Country 2019 & 2032
- Table 134: Global Hearing Aid Industry Volume K Unit Forecast, by Country 2019 & 2032
- Table 135: GCC Hearing Aid Industry Revenue (Million) Forecast, by Application 2019 & 2032
- Table 136: GCC Hearing Aid Industry Volume (K Unit) Forecast, by Application 2019 & 2032
- Table 137: South Africa Hearing Aid Industry Revenue (Million) Forecast, by Application 2019 & 2032
- Table 138: South Africa Hearing Aid Industry Volume (K Unit) Forecast, by Application 2019 & 2032
- Table 139: Rest of Middle East and Africa Hearing Aid Industry Revenue (Million) Forecast, by Application 2019 & 2032
- Table 140: Rest of Middle East and Africa Hearing Aid Industry Volume (K Unit) Forecast, by Application 2019 & 2032
- Table 141: Global Hearing Aid Industry Revenue Million Forecast, by Product Type 2019 & 2032
- Table 142: Global Hearing Aid Industry Volume K Unit Forecast, by Product Type 2019 & 2032
- Table 143: Global Hearing Aid Industry Revenue Million Forecast, by Type of Hearing Loss 2019 & 2032
- Table 144: Global Hearing Aid Industry Volume K Unit Forecast, by Type of Hearing Loss 2019 & 2032
- Table 145: Global Hearing Aid Industry Revenue Million Forecast, by Technology 2019 & 2032
- Table 146: Global Hearing Aid Industry Volume K Unit Forecast, by Technology 2019 & 2032
- Table 147: Global Hearing Aid Industry Revenue Million Forecast, by Patient Type 2019 & 2032
- Table 148: Global Hearing Aid Industry Volume K Unit Forecast, by Patient Type 2019 & 2032
- Table 149: Global Hearing Aid Industry Revenue Million Forecast, by Country 2019 & 2032
- Table 150: Global Hearing Aid Industry Volume K Unit Forecast, by Country 2019 & 2032
- Table 151: Brazil Hearing Aid Industry Revenue (Million) Forecast, by Application 2019 & 2032
- Table 152: Brazil Hearing Aid Industry Volume (K Unit) Forecast, by Application 2019 & 2032
- Table 153: Argentina Hearing Aid Industry Revenue (Million) Forecast, by Application 2019 & 2032
- Table 154: Argentina Hearing Aid Industry Volume (K Unit) Forecast, by Application 2019 & 2032
- Table 155: Rest of South America Hearing Aid Industry Revenue (Million) Forecast, by Application 2019 & 2032
- Table 156: Rest of South America Hearing Aid Industry Volume (K Unit) Forecast, by Application 2019 & 2032
Frequently Asked Questions
1. What is the projected Compound Annual Growth Rate (CAGR) of the Hearing Aid Industry?
The projected CAGR is approximately 4.94%.
2. Which companies are prominent players in the Hearing Aid Industry?
Key companies in the market include WS Audiology AS (Sivantos Group WIDEX), GN Store Nord A/S, Amplifon SpA, Eargo Inc, Medtronic PLC, Sonova Holding AG, Starkey Hearing Technologies, Cochlear Ltd, Demant AS, Audina Hearing Instruments Inc, MED-EL, Horentek Hearing Diagnostics.
3. What are the main segments of the Hearing Aid Industry?
The market segments include Product Type, Type of Hearing Loss, Technology, Patient Type.
4. Can you provide details about the market size?
The market size is estimated to be USD 9.64 Million as of 2022.
5. What are some drivers contributing to market growth?
Rising Burden of Hearing Loss; Technological Advancements in Hearing Aid Devices; Rising Awareness and Initiatives about Hearing Aid Devices.
6. What are the notable trends driving market growth?
Behind the Ear (BTE) Segment is Expected to Hold a Significant Market Share in the Product Type Segment Over the Forecast Period.
7. Are there any restraints impacting market growth?
High Cost of Hearing Aid Devices and the Presence of Substitute Products.
8. Can you provide examples of recent developments in the market?
October 2022- Sony Electronics announced the availability of its first over-the-counter (OTC) hearing aids for the United States market.
9. What pricing options are available for accessing the report?
Pricing options include single-user, multi-user, and enterprise licenses priced at USD 4750, USD 5250, and USD 8750 respectively.
10. Is the market size provided in terms of value or volume?
The market size is provided in terms of value, measured in Million and volume, measured in K Unit.
11. Are there any specific market keywords associated with the report?
Yes, the market keyword associated with the report is "Hearing Aid Industry," which aids in identifying and referencing the specific market segment covered.
12. How do I determine which pricing option suits my needs best?
The pricing options vary based on user requirements and access needs. Individual users may opt for single-user licenses, while businesses requiring broader access may choose multi-user or enterprise licenses for cost-effective access to the report.
13. Are there any additional resources or data provided in the Hearing Aid Industry report?
While the report offers comprehensive insights, it's advisable to review the specific contents or supplementary materials provided to ascertain if additional resources or data are available.
14. How can I stay updated on further developments or reports in the Hearing Aid Industry?
To stay informed about further developments, trends, and reports in the Hearing Aid Industry, consider subscribing to industry newsletters, following relevant companies and organizations, or regularly checking reputable industry news sources and publications.
Methodology
Step 1 - Identification of Relevant Samples Size from Population Database


Step 2 - Approaches for Defining Global Market Size (Value, Volume* & Price*)

Note*: In applicable scenarios
Step 3 - Data Sources
Primary Research
- Web Analytics
- Survey Reports
- Research Institute
- Latest Research Reports
- Opinion Leaders
Secondary Research
- Annual Reports
- White Paper
- Latest Press Release
- Industry Association
- Paid Database
- Investor Presentations

Step 4 - Data Triangulation
Involves using different sources of information in order to increase the validity of a study
These sources are likely to be stakeholders in a program - participants, other researchers, program staff, other community members, and so on.
Then we put all data in single framework & apply various statistical tools to find out the dynamic on the market.
During the analysis stage, feedback from the stakeholder groups would be compared to determine areas of agreement as well as areas of divergence


