
Key Insights
The global hearable electronic devices market, encompassing headsets, earbuds, and hearing aids, is experiencing robust growth, projected to reach a substantial size driven by several key factors. The market's Compound Annual Growth Rate (CAGR) of 11.70% from 2019 to 2024 suggests a significant expansion. Several factors contribute to this growth. Firstly, the increasing adoption of wireless technologies like Bluetooth and the integration of smart features in hearable devices are driving consumer demand. Secondly, the rising prevalence of hearing loss, especially among aging populations in developed nations, fuels the demand for hearing aids. Thirdly, the expanding availability of affordable and high-quality earbuds and headsets across various price points is making them more accessible to a wider consumer base. Technological advancements, such as noise cancellation, improved sound quality, and longer battery life, further enhance market appeal. However, factors like the high cost of advanced hearing aids and potential health concerns related to prolonged use of earbuds can act as market restraints. The market segmentation reveals a diverse landscape with In-Ear, On-Ear, and Over-Ear devices dominating the headset category, while earbuds and hearing aids represent distinct but interconnected segments. Leading companies such as Bose, Apple, and Sony are key players leveraging innovation and brand recognition to secure market share. Regional analysis indicates strong performance in North America and Asia Pacific, with substantial potential for growth in developing economies as disposable incomes increase.
The competitive landscape is marked by intense innovation and a focus on enhancing user experience. Major players are investing heavily in research and development to introduce advanced features such as health monitoring capabilities and improved integration with smartphones. Future growth is expected to be influenced by the increasing integration of hearable devices with artificial intelligence (AI), enabling features like personalized sound profiles and real-time translation. The expansion into emerging markets will also play a significant role, particularly in regions with growing populations and rising middle classes. The long-term outlook for the hearable electronic devices market remains positive, driven by technological advancements, increasing demand, and an expanding consumer base. Strategic partnerships, acquisitions, and the introduction of new product lines will continue to shape the competitive landscape in the coming years.
Hearable Electronic Devices Industry Market Report: 2019-2033
This comprehensive report provides an in-depth analysis of the Hearable Electronic Devices industry, encompassing the parent market (Consumer Electronics) and its child markets (Headsets, Earbuds, and Hearing Aids). The study period covers 2019-2033, with 2025 as the base year and a forecast period extending to 2033. The report leverages extensive data analysis to deliver critical insights for industry professionals, investors, and strategic decision-makers. The total market size is estimated at xx Million units in 2025, projecting significant growth throughout the forecast period.
Hearable Electronic Devices Industry Market Dynamics & Structure
This section analyzes the competitive landscape, technological advancements, regulatory influences, and market trends within the Hearable Electronic Devices industry. The market exhibits moderate concentration, with key players like Bose, Apple, and Samsung holding significant market shares, although fragmentation exists amongst smaller, specialized players, especially within the hearing aid segment. Technological innovation is a primary growth driver, with advancements in noise cancellation, battery life, and connectivity continually shaping consumer preferences. Regulatory frameworks concerning health and safety standards, especially for hearing aids, play a crucial role. Competitive substitutes include traditional wired headphones, but the convenience and wireless capabilities of hearable devices continue to drive market expansion. End-user demographics are broadening, with adoption increasing across age groups. The industry has witnessed notable M&A activity, with larger players consolidating their position and integrating smaller companies to expand their product portfolios.
- Market Concentration: Moderately concentrated, with key players holding xx% of the market share in 2025.
- Technological Innovation Drivers: Noise cancellation, improved battery technology, enhanced connectivity (Bluetooth, etc.).
- Regulatory Frameworks: Stringent safety standards for hearing aids impacting product development and marketing.
- Competitive Product Substitutes: Wired headphones, traditional hearing aids.
- End-User Demographics: Broadening across age groups and lifestyles.
- M&A Trends: Consolidation and vertical integration among leading players; xx major deals reported between 2019-2024.
Hearable Electronic Devices Industry Growth Trends & Insights
The Hearable Electronic Devices market has experienced robust growth throughout the historical period (2019-2024), driven by increasing consumer demand for wireless audio solutions and advancements in hearing aid technology. Market size has grown from xx Million units in 2019 to an estimated xx Million units in 2025, reflecting a Compound Annual Growth Rate (CAGR) of xx%. This growth is fuelled by several factors: rising disposable incomes, increasing smartphone penetration, improved product features, and greater awareness of hearing health. The adoption rate of wireless earbuds and noise-canceling headphones, specifically, has been remarkable, impacting consumer behaviour as people shift from traditional wired options. Technological disruptions such as the emergence of true wireless earbuds and hearing aids with advanced features like artificial intelligence continue to propel market expansion. Consumer behavior is also shifting towards premium, feature-rich products, boosting the average selling prices and overall market value.
Dominant Regions, Countries, or Segments in Hearable Electronic Devices Industry
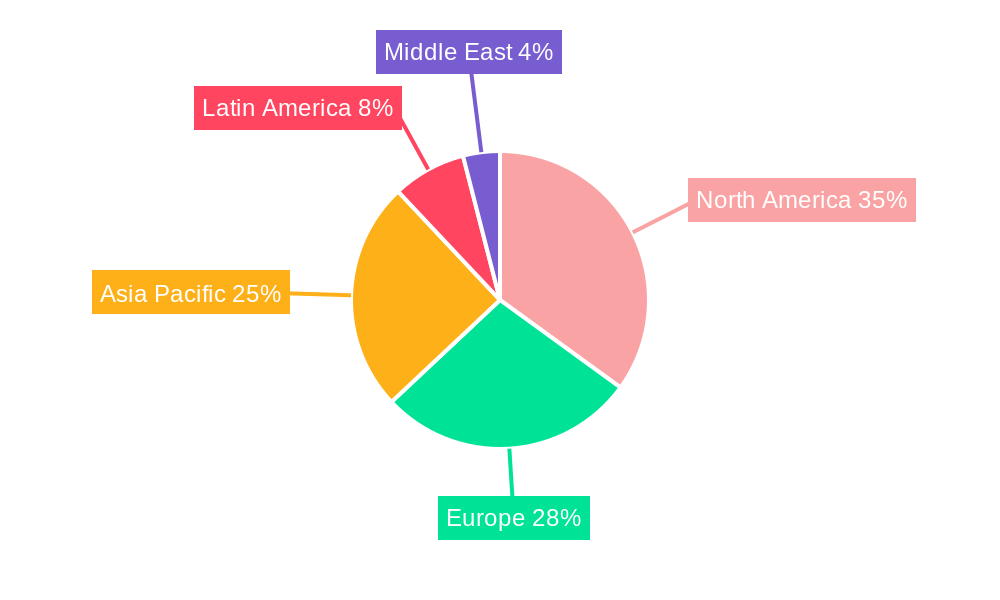
The North American and Western European markets currently dominate the Hearable Electronic Devices industry, driven by high disposable incomes, advanced technological infrastructure, and a strong preference for premium products. However, Asia-Pacific, particularly China and India, shows remarkable growth potential, fueled by expanding consumer bases and increasing smartphone adoption.
Leading Segments:
- Product: Earbuds are the fastest-growing segment, representing xx% of the market in 2025, followed by headsets (xx%) and hearing aids (xx%).
- Type: In-Ear devices dominate (xx% market share in 2025) due to their portability and affordability. However, On-Ear and Over-Ear segments are experiencing growth due to improved comfort and audio quality.
Key Drivers by Region:
- North America: High consumer spending, technological advancements, and strong brand presence.
- Western Europe: Similar to North America, with a focus on premium products.
- Asia-Pacific: Rapid economic growth, expanding middle class, and high smartphone penetration.
Hearable Electronic Devices Industry Product Landscape
The Hearable Electronic Devices market showcases a diverse range of products, from basic earbuds to sophisticated noise-canceling headphones and advanced hearing aids. Key product innovations include improved noise cancellation technologies, longer battery life, enhanced connectivity features (Bluetooth 5.0, multipoint pairing), and integration with health and fitness tracking apps. Hearing aids are increasingly incorporating advanced features like AI-powered noise reduction and personalized sound profiles. Unique selling propositions often center around superior sound quality, comfort, and seamless integration with other devices.
Key Drivers, Barriers & Challenges in Hearable Electronic Devices Industry
Key Drivers:
- Technological Advancements: Miniaturization, improved battery technology, superior noise cancellation, AI-powered features.
- Rising Disposable Incomes: Increased spending power driving demand for premium products.
- Growing Awareness of Hearing Health: Increased adoption of hearing aids.
Key Challenges & Restraints:
- Supply Chain Disruptions: Component shortages impacting production and delivery times. Estimated impact: xx% reduction in production in 2024.
- Regulatory Hurdles: Stringent safety and health standards affecting product development and market entry.
- Intense Competition: Price wars and intense rivalry amongst established players and new entrants.
Emerging Opportunities in Hearable Electronic Devices Industry
- Expansion into Emerging Markets: Untapped potential in developing economies.
- Integration with Healthcare: Growing demand for hearable devices with health monitoring capabilities.
- Personalized Audio Experiences: Tailored sound profiles and AI-driven features.
Growth Accelerators in the Hearable Electronic Devices Industry
Long-term growth is projected to be driven by continuous technological innovation leading to enhanced product functionalities, strategic partnerships between technology companies and healthcare providers expanding the reach of hearing aid technology, and strategic market expansion into developing economies with rising consumer spending and technological adoption.
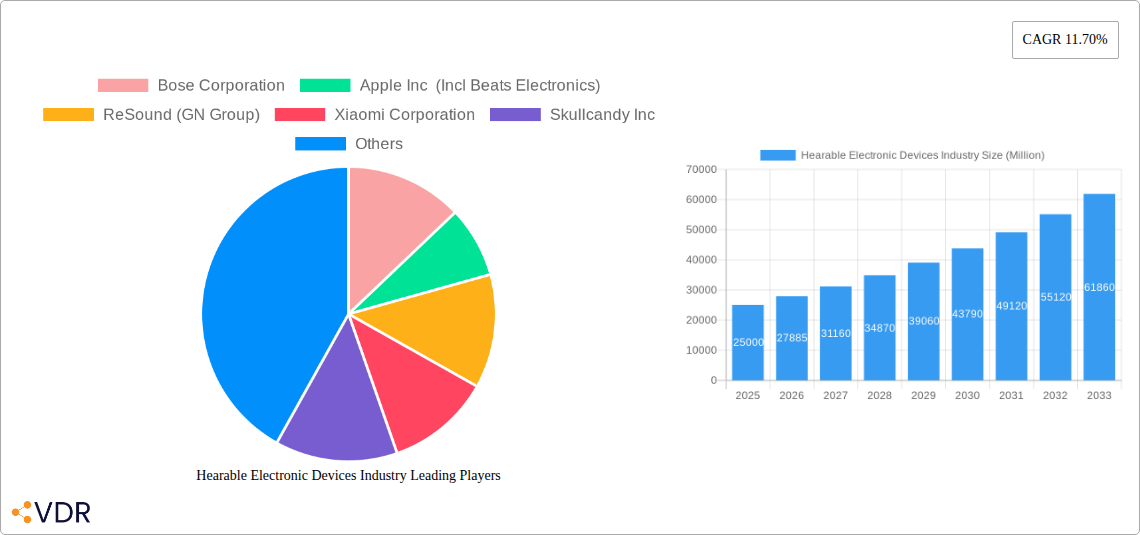
Key Players Shaping the Hearable Electronic Devices Market
- Bose Corporation
- Apple Inc (Incl Beats Electronics)
- ReSound (GN Group)
- Xiaomi Corporation
- Skullcandy Inc
- Samsung Electronics Co Ltd (Harman International Industries Inc (Incl JBL)
- Sennheiser Electronic GMBH & Co
- Starkey Hearing Technologies
- Demant A/S
- WS Audiology A/S
- Sony Corporation
Notable Milestones in Hearable Electronic Devices Industry Sector
- October 2022: WS Audiology A/S launched the HearUSA brand, uniting resources to improve hearing care access.
- November 2022: Starkey partnered with Special Olympics International to expand hearing health services globally.
In-Depth Hearable Electronic Devices Industry Market Outlook
The Hearable Electronic Devices industry is poised for sustained growth, driven by continuous technological advancements, increasing consumer awareness of hearing health, and expansion into new markets. Strategic partnerships, product diversification, and focus on premium features will be crucial for success in this competitive landscape. The market is expected to reach xx Million units by 2033, presenting substantial opportunities for established players and new entrants alike.
Hearable Electronic Devices Industry Segmentation
-
1. Type
- 1.1. In-Ear
- 1.2. On-Ear
- 1.3. Over-Ear
-
2. Product
- 2.1. Headsets
- 2.2. Earbuds
- 2.3. Hearing Aids
Hearable Electronic Devices Industry Segmentation By Geography
-
1. North America
- 1.1. United States
- 1.2. Canada
-
2. Europe
- 2.1. United Kingdom
- 2.2. Germany
- 2.3. France
- 2.4. Rest of Europe
-
3. Asia Pacific
- 3.1. China
- 3.2. Japan
- 3.3. India
- 3.4. South Korea
- 3.5. Rest of Asia Pacific
- 4. Latin America
- 5. Middle East
Hearable Electronic Devices Industry REPORT HIGHLIGHTS
| Aspects | Details |
|---|---|
| Study Period | 2019-2033 |
| Base Year | 2024 |
| Estimated Year | 2025 |
| Forecast Period | 2025-2033 |
| Historical Period | 2019-2024 |
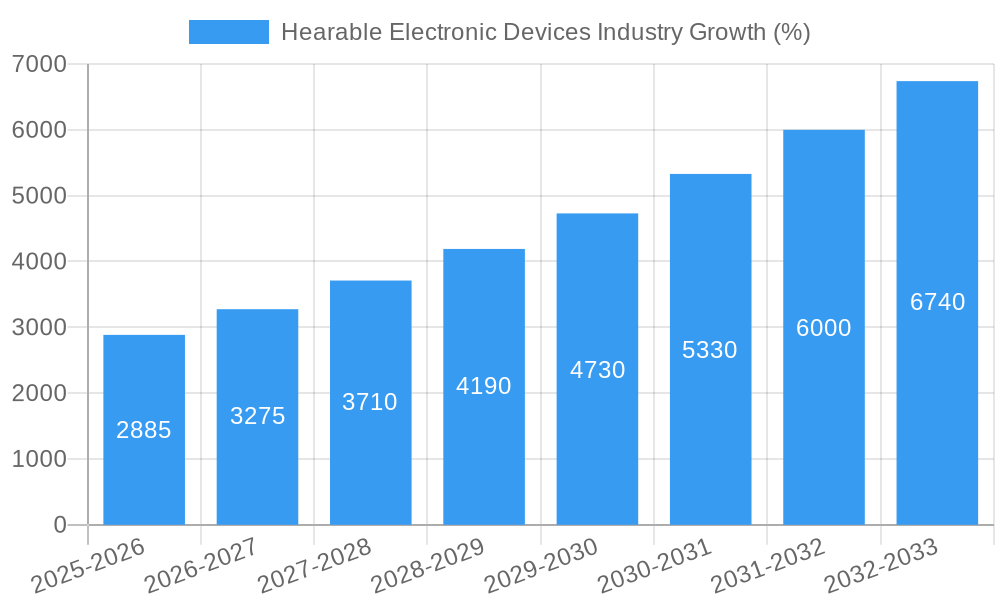
| Growth Rate | CAGR of 11.70% from 2019-2033 |
| Segmentation |
|
Table of Contents
- 1. Introduction
- 1.1. Research Scope
- 1.2. Market Segmentation
- 1.3. Research Methodology
- 1.4. Definitions and Assumptions
- 2. Executive Summary
- 2.1. Introduction
- 3. Market Dynamics
- 3.1. Introduction
- 3.2. Market Drivers
- 3.2.1. Increasing Affinity of the Millennial Population Towards Technologically Advanced Appliances and Rising Number of Smartphone Users; Rise in Demand for Wireless Headphones and Infotainment Devices
- 3.3. Market Restrains
- 3.3.1. Optimizing Battery Life of Hearable Device
- 3.4. Market Trends
- 3.4.1. Rise in Demand for Wireless Headphones and Infotainment Devices to Drive the Market Growth
- 4. Market Factor Analysis
- 4.1. Porters Five Forces
- 4.2. Supply/Value Chain
- 4.3. PESTEL analysis
- 4.4. Market Entropy
- 4.5. Patent/Trademark Analysis
- 5. Global Hearable Electronic Devices Industry Analysis, Insights and Forecast, 2019-2031
- 5.1. Market Analysis, Insights and Forecast - by Type
- 5.1.1. In-Ear
- 5.1.2. On-Ear
- 5.1.3. Over-Ear
- 5.2. Market Analysis, Insights and Forecast - by Product
- 5.2.1. Headsets
- 5.2.2. Earbuds
- 5.2.3. Hearing Aids
- 5.3. Market Analysis, Insights and Forecast - by Region
- 5.3.1. North America
- 5.3.2. Europe
- 5.3.3. Asia Pacific
- 5.3.4. Latin America
- 5.3.5. Middle East
- 5.1. Market Analysis, Insights and Forecast - by Type
- 6. North America Hearable Electronic Devices Industry Analysis, Insights and Forecast, 2019-2031
- 6.1. Market Analysis, Insights and Forecast - by Type
- 6.1.1. In-Ear
- 6.1.2. On-Ear
- 6.1.3. Over-Ear
- 6.2. Market Analysis, Insights and Forecast - by Product
- 6.2.1. Headsets
- 6.2.2. Earbuds
- 6.2.3. Hearing Aids
- 6.1. Market Analysis, Insights and Forecast - by Type
- 7. Europe Hearable Electronic Devices Industry Analysis, Insights and Forecast, 2019-2031
- 7.1. Market Analysis, Insights and Forecast - by Type
- 7.1.1. In-Ear
- 7.1.2. On-Ear
- 7.1.3. Over-Ear
- 7.2. Market Analysis, Insights and Forecast - by Product
- 7.2.1. Headsets
- 7.2.2. Earbuds
- 7.2.3. Hearing Aids
- 7.1. Market Analysis, Insights and Forecast - by Type
- 8. Asia Pacific Hearable Electronic Devices Industry Analysis, Insights and Forecast, 2019-2031
- 8.1. Market Analysis, Insights and Forecast - by Type
- 8.1.1. In-Ear
- 8.1.2. On-Ear
- 8.1.3. Over-Ear
- 8.2. Market Analysis, Insights and Forecast - by Product
- 8.2.1. Headsets
- 8.2.2. Earbuds
- 8.2.3. Hearing Aids
- 8.1. Market Analysis, Insights and Forecast - by Type
- 9. Latin America Hearable Electronic Devices Industry Analysis, Insights and Forecast, 2019-2031
- 9.1. Market Analysis, Insights and Forecast - by Type
- 9.1.1. In-Ear
- 9.1.2. On-Ear
- 9.1.3. Over-Ear
- 9.2. Market Analysis, Insights and Forecast - by Product
- 9.2.1. Headsets
- 9.2.2. Earbuds
- 9.2.3. Hearing Aids
- 9.1. Market Analysis, Insights and Forecast - by Type
- 10. Middle East Hearable Electronic Devices Industry Analysis, Insights and Forecast, 2019-2031
- 10.1. Market Analysis, Insights and Forecast - by Type
- 10.1.1. In-Ear
- 10.1.2. On-Ear
- 10.1.3. Over-Ear
- 10.2. Market Analysis, Insights and Forecast - by Product
- 10.2.1. Headsets
- 10.2.2. Earbuds
- 10.2.3. Hearing Aids
- 10.1. Market Analysis, Insights and Forecast - by Type
- 11. North America Hearable Electronic Devices Industry Analysis, Insights and Forecast, 2019-2031
- 11.1. Market Analysis, Insights and Forecast - By Country/Sub-region
- 11.1.1 United States
- 11.1.2 Canada
- 12. Europe Hearable Electronic Devices Industry Analysis, Insights and Forecast, 2019-2031
- 12.1. Market Analysis, Insights and Forecast - By Country/Sub-region
- 12.1.1 United Kingdom
- 12.1.2 Germany
- 12.1.3 France
- 12.1.4 Rest of Europe
- 13. Asia Pacific Hearable Electronic Devices Industry Analysis, Insights and Forecast, 2019-2031
- 13.1. Market Analysis, Insights and Forecast - By Country/Sub-region
- 13.1.1 China
- 13.1.2 Japan
- 13.1.3 India
- 13.1.4 South Korea
- 13.1.5 Rest of Asia Pacific
- 14. Latin America Hearable Electronic Devices Industry Analysis, Insights and Forecast, 2019-2031
- 14.1. Market Analysis, Insights and Forecast - By Country/Sub-region
- 14.1.1.
- 15. Middle East Hearable Electronic Devices Industry Analysis, Insights and Forecast, 2019-2031
- 15.1. Market Analysis, Insights and Forecast - By Country/Sub-region
- 15.1.1.
- 16. Competitive Analysis
- 16.1. Global Market Share Analysis 2024
- 16.2. Company Profiles
- 16.2.1 Bose Corporation
- 16.2.1.1. Overview
- 16.2.1.2. Products
- 16.2.1.3. SWOT Analysis
- 16.2.1.4. Recent Developments
- 16.2.1.5. Financials (Based on Availability)
- 16.2.2 Apple Inc (Incl Beats Electronics)
- 16.2.2.1. Overview
- 16.2.2.2. Products
- 16.2.2.3. SWOT Analysis
- 16.2.2.4. Recent Developments
- 16.2.2.5. Financials (Based on Availability)
- 16.2.3 ReSound (GN Group)
- 16.2.3.1. Overview
- 16.2.3.2. Products
- 16.2.3.3. SWOT Analysis
- 16.2.3.4. Recent Developments
- 16.2.3.5. Financials (Based on Availability)
- 16.2.4 Xiaomi Corporation
- 16.2.4.1. Overview
- 16.2.4.2. Products
- 16.2.4.3. SWOT Analysis
- 16.2.4.4. Recent Developments
- 16.2.4.5. Financials (Based on Availability)
- 16.2.5 Skullcandy Inc
- 16.2.5.1. Overview
- 16.2.5.2. Products
- 16.2.5.3. SWOT Analysis
- 16.2.5.4. Recent Developments
- 16.2.5.5. Financials (Based on Availability)
- 16.2.6 Samsung Electronics Co Ltd (Harman International Industries Inc (Incl JBL)
- 16.2.6.1. Overview
- 16.2.6.2. Products
- 16.2.6.3. SWOT Analysis
- 16.2.6.4. Recent Developments
- 16.2.6.5. Financials (Based on Availability)
- 16.2.7 Sennheiser Electronic GMBH & Co
- 16.2.7.1. Overview
- 16.2.7.2. Products
- 16.2.7.3. SWOT Analysis
- 16.2.7.4. Recent Developments
- 16.2.7.5. Financials (Based on Availability)
- 16.2.8 Starkey Hearing Technologies
- 16.2.8.1. Overview
- 16.2.8.2. Products
- 16.2.8.3. SWOT Analysis
- 16.2.8.4. Recent Developments
- 16.2.8.5. Financials (Based on Availability)
- 16.2.9 Demant A/S
- 16.2.9.1. Overview
- 16.2.9.2. Products
- 16.2.9.3. SWOT Analysis
- 16.2.9.4. Recent Developments
- 16.2.9.5. Financials (Based on Availability)
- 16.2.10 WS Audiology A/S
- 16.2.10.1. Overview
- 16.2.10.2. Products
- 16.2.10.3. SWOT Analysis
- 16.2.10.4. Recent Developments
- 16.2.10.5. Financials (Based on Availability)
- 16.2.11 Sony Corporation
- 16.2.11.1. Overview
- 16.2.11.2. Products
- 16.2.11.3. SWOT Analysis
- 16.2.11.4. Recent Developments
- 16.2.11.5. Financials (Based on Availability)
- 16.2.1 Bose Corporation
List of Figures
- Figure 1: Global Hearable Electronic Devices Industry Revenue Breakdown (Million, %) by Region 2024 & 2032
- Figure 2: Global Hearable Electronic Devices Industry Volume Breakdown (K Unit, %) by Region 2024 & 2032
- Figure 3: North America Hearable Electronic Devices Industry Revenue (Million), by Country 2024 & 2032
- Figure 4: North America Hearable Electronic Devices Industry Volume (K Unit), by Country 2024 & 2032
- Figure 5: North America Hearable Electronic Devices Industry Revenue Share (%), by Country 2024 & 2032
- Figure 6: North America Hearable Electronic Devices Industry Volume Share (%), by Country 2024 & 2032
- Figure 7: Europe Hearable Electronic Devices Industry Revenue (Million), by Country 2024 & 2032
- Figure 8: Europe Hearable Electronic Devices Industry Volume (K Unit), by Country 2024 & 2032
- Figure 9: Europe Hearable Electronic Devices Industry Revenue Share (%), by Country 2024 & 2032
- Figure 10: Europe Hearable Electronic Devices Industry Volume Share (%), by Country 2024 & 2032
- Figure 11: Asia Pacific Hearable Electronic Devices Industry Revenue (Million), by Country 2024 & 2032
- Figure 12: Asia Pacific Hearable Electronic Devices Industry Volume (K Unit), by Country 2024 & 2032
- Figure 13: Asia Pacific Hearable Electronic Devices Industry Revenue Share (%), by Country 2024 & 2032
- Figure 14: Asia Pacific Hearable Electronic Devices Industry Volume Share (%), by Country 2024 & 2032
- Figure 15: Latin America Hearable Electronic Devices Industry Revenue (Million), by Country 2024 & 2032
- Figure 16: Latin America Hearable Electronic Devices Industry Volume (K Unit), by Country 2024 & 2032
- Figure 17: Latin America Hearable Electronic Devices Industry Revenue Share (%), by Country 2024 & 2032
- Figure 18: Latin America Hearable Electronic Devices Industry Volume Share (%), by Country 2024 & 2032
- Figure 19: Middle East Hearable Electronic Devices Industry Revenue (Million), by Country 2024 & 2032
- Figure 20: Middle East Hearable Electronic Devices Industry Volume (K Unit), by Country 2024 & 2032
- Figure 21: Middle East Hearable Electronic Devices Industry Revenue Share (%), by Country 2024 & 2032
- Figure 22: Middle East Hearable Electronic Devices Industry Volume Share (%), by Country 2024 & 2032
- Figure 23: North America Hearable Electronic Devices Industry Revenue (Million), by Type 2024 & 2032
- Figure 24: North America Hearable Electronic Devices Industry Volume (K Unit), by Type 2024 & 2032
- Figure 25: North America Hearable Electronic Devices Industry Revenue Share (%), by Type 2024 & 2032
- Figure 26: North America Hearable Electronic Devices Industry Volume Share (%), by Type 2024 & 2032
- Figure 27: North America Hearable Electronic Devices Industry Revenue (Million), by Product 2024 & 2032
- Figure 28: North America Hearable Electronic Devices Industry Volume (K Unit), by Product 2024 & 2032
- Figure 29: North America Hearable Electronic Devices Industry Revenue Share (%), by Product 2024 & 2032
- Figure 30: North America Hearable Electronic Devices Industry Volume Share (%), by Product 2024 & 2032
- Figure 31: North America Hearable Electronic Devices Industry Revenue (Million), by Country 2024 & 2032
- Figure 32: North America Hearable Electronic Devices Industry Volume (K Unit), by Country 2024 & 2032
- Figure 33: North America Hearable Electronic Devices Industry Revenue Share (%), by Country 2024 & 2032
- Figure 34: North America Hearable Electronic Devices Industry Volume Share (%), by Country 2024 & 2032
- Figure 35: Europe Hearable Electronic Devices Industry Revenue (Million), by Type 2024 & 2032
- Figure 36: Europe Hearable Electronic Devices Industry Volume (K Unit), by Type 2024 & 2032
- Figure 37: Europe Hearable Electronic Devices Industry Revenue Share (%), by Type 2024 & 2032
- Figure 38: Europe Hearable Electronic Devices Industry Volume Share (%), by Type 2024 & 2032
- Figure 39: Europe Hearable Electronic Devices Industry Revenue (Million), by Product 2024 & 2032
- Figure 40: Europe Hearable Electronic Devices Industry Volume (K Unit), by Product 2024 & 2032
- Figure 41: Europe Hearable Electronic Devices Industry Revenue Share (%), by Product 2024 & 2032
- Figure 42: Europe Hearable Electronic Devices Industry Volume Share (%), by Product 2024 & 2032
- Figure 43: Europe Hearable Electronic Devices Industry Revenue (Million), by Country 2024 & 2032
- Figure 44: Europe Hearable Electronic Devices Industry Volume (K Unit), by Country 2024 & 2032
- Figure 45: Europe Hearable Electronic Devices Industry Revenue Share (%), by Country 2024 & 2032
- Figure 46: Europe Hearable Electronic Devices Industry Volume Share (%), by Country 2024 & 2032
- Figure 47: Asia Pacific Hearable Electronic Devices Industry Revenue (Million), by Type 2024 & 2032
- Figure 48: Asia Pacific Hearable Electronic Devices Industry Volume (K Unit), by Type 2024 & 2032
- Figure 49: Asia Pacific Hearable Electronic Devices Industry Revenue Share (%), by Type 2024 & 2032
- Figure 50: Asia Pacific Hearable Electronic Devices Industry Volume Share (%), by Type 2024 & 2032
- Figure 51: Asia Pacific Hearable Electronic Devices Industry Revenue (Million), by Product 2024 & 2032
- Figure 52: Asia Pacific Hearable Electronic Devices Industry Volume (K Unit), by Product 2024 & 2032
- Figure 53: Asia Pacific Hearable Electronic Devices Industry Revenue Share (%), by Product 2024 & 2032
- Figure 54: Asia Pacific Hearable Electronic Devices Industry Volume Share (%), by Product 2024 & 2032
- Figure 55: Asia Pacific Hearable Electronic Devices Industry Revenue (Million), by Country 2024 & 2032
- Figure 56: Asia Pacific Hearable Electronic Devices Industry Volume (K Unit), by Country 2024 & 2032
- Figure 57: Asia Pacific Hearable Electronic Devices Industry Revenue Share (%), by Country 2024 & 2032
- Figure 58: Asia Pacific Hearable Electronic Devices Industry Volume Share (%), by Country 2024 & 2032
- Figure 59: Latin America Hearable Electronic Devices Industry Revenue (Million), by Type 2024 & 2032
- Figure 60: Latin America Hearable Electronic Devices Industry Volume (K Unit), by Type 2024 & 2032
- Figure 61: Latin America Hearable Electronic Devices Industry Revenue Share (%), by Type 2024 & 2032
- Figure 62: Latin America Hearable Electronic Devices Industry Volume Share (%), by Type 2024 & 2032
- Figure 63: Latin America Hearable Electronic Devices Industry Revenue (Million), by Product 2024 & 2032
- Figure 64: Latin America Hearable Electronic Devices Industry Volume (K Unit), by Product 2024 & 2032
- Figure 65: Latin America Hearable Electronic Devices Industry Revenue Share (%), by Product 2024 & 2032
- Figure 66: Latin America Hearable Electronic Devices Industry Volume Share (%), by Product 2024 & 2032
- Figure 67: Latin America Hearable Electronic Devices Industry Revenue (Million), by Country 2024 & 2032
- Figure 68: Latin America Hearable Electronic Devices Industry Volume (K Unit), by Country 2024 & 2032
- Figure 69: Latin America Hearable Electronic Devices Industry Revenue Share (%), by Country 2024 & 2032
- Figure 70: Latin America Hearable Electronic Devices Industry Volume Share (%), by Country 2024 & 2032
- Figure 71: Middle East Hearable Electronic Devices Industry Revenue (Million), by Type 2024 & 2032
- Figure 72: Middle East Hearable Electronic Devices Industry Volume (K Unit), by Type 2024 & 2032
- Figure 73: Middle East Hearable Electronic Devices Industry Revenue Share (%), by Type 2024 & 2032
- Figure 74: Middle East Hearable Electronic Devices Industry Volume Share (%), by Type 2024 & 2032
- Figure 75: Middle East Hearable Electronic Devices Industry Revenue (Million), by Product 2024 & 2032
- Figure 76: Middle East Hearable Electronic Devices Industry Volume (K Unit), by Product 2024 & 2032
- Figure 77: Middle East Hearable Electronic Devices Industry Revenue Share (%), by Product 2024 & 2032
- Figure 78: Middle East Hearable Electronic Devices Industry Volume Share (%), by Product 2024 & 2032
- Figure 79: Middle East Hearable Electronic Devices Industry Revenue (Million), by Country 2024 & 2032
- Figure 80: Middle East Hearable Electronic Devices Industry Volume (K Unit), by Country 2024 & 2032
- Figure 81: Middle East Hearable Electronic Devices Industry Revenue Share (%), by Country 2024 & 2032
- Figure 82: Middle East Hearable Electronic Devices Industry Volume Share (%), by Country 2024 & 2032
List of Tables
- Table 1: Global Hearable Electronic Devices Industry Revenue Million Forecast, by Region 2019 & 2032
- Table 2: Global Hearable Electronic Devices Industry Volume K Unit Forecast, by Region 2019 & 2032
- Table 3: Global Hearable Electronic Devices Industry Revenue Million Forecast, by Type 2019 & 2032
- Table 4: Global Hearable Electronic Devices Industry Volume K Unit Forecast, by Type 2019 & 2032
- Table 5: Global Hearable Electronic Devices Industry Revenue Million Forecast, by Product 2019 & 2032
- Table 6: Global Hearable Electronic Devices Industry Volume K Unit Forecast, by Product 2019 & 2032
- Table 7: Global Hearable Electronic Devices Industry Revenue Million Forecast, by Region 2019 & 2032
- Table 8: Global Hearable Electronic Devices Industry Volume K Unit Forecast, by Region 2019 & 2032
- Table 9: Global Hearable Electronic Devices Industry Revenue Million Forecast, by Country 2019 & 2032
- Table 10: Global Hearable Electronic Devices Industry Volume K Unit Forecast, by Country 2019 & 2032
- Table 11: United States Hearable Electronic Devices Industry Revenue (Million) Forecast, by Application 2019 & 2032
- Table 12: United States Hearable Electronic Devices Industry Volume (K Unit) Forecast, by Application 2019 & 2032
- Table 13: Canada Hearable Electronic Devices Industry Revenue (Million) Forecast, by Application 2019 & 2032
- Table 14: Canada Hearable Electronic Devices Industry Volume (K Unit) Forecast, by Application 2019 & 2032
- Table 15: Global Hearable Electronic Devices Industry Revenue Million Forecast, by Country 2019 & 2032
- Table 16: Global Hearable Electronic Devices Industry Volume K Unit Forecast, by Country 2019 & 2032
- Table 17: United Kingdom Hearable Electronic Devices Industry Revenue (Million) Forecast, by Application 2019 & 2032
- Table 18: United Kingdom Hearable Electronic Devices Industry Volume (K Unit) Forecast, by Application 2019 & 2032
- Table 19: Germany Hearable Electronic Devices Industry Revenue (Million) Forecast, by Application 2019 & 2032
- Table 20: Germany Hearable Electronic Devices Industry Volume (K Unit) Forecast, by Application 2019 & 2032
- Table 21: France Hearable Electronic Devices Industry Revenue (Million) Forecast, by Application 2019 & 2032
- Table 22: France Hearable Electronic Devices Industry Volume (K Unit) Forecast, by Application 2019 & 2032
- Table 23: Rest of Europe Hearable Electronic Devices Industry Revenue (Million) Forecast, by Application 2019 & 2032
- Table 24: Rest of Europe Hearable Electronic Devices Industry Volume (K Unit) Forecast, by Application 2019 & 2032
- Table 25: Global Hearable Electronic Devices Industry Revenue Million Forecast, by Country 2019 & 2032
- Table 26: Global Hearable Electronic Devices Industry Volume K Unit Forecast, by Country 2019 & 2032
- Table 27: China Hearable Electronic Devices Industry Revenue (Million) Forecast, by Application 2019 & 2032
- Table 28: China Hearable Electronic Devices Industry Volume (K Unit) Forecast, by Application 2019 & 2032
- Table 29: Japan Hearable Electronic Devices Industry Revenue (Million) Forecast, by Application 2019 & 2032
- Table 30: Japan Hearable Electronic Devices Industry Volume (K Unit) Forecast, by Application 2019 & 2032
- Table 31: India Hearable Electronic Devices Industry Revenue (Million) Forecast, by Application 2019 & 2032
- Table 32: India Hearable Electronic Devices Industry Volume (K Unit) Forecast, by Application 2019 & 2032
- Table 33: South Korea Hearable Electronic Devices Industry Revenue (Million) Forecast, by Application 2019 & 2032
- Table 34: South Korea Hearable Electronic Devices Industry Volume (K Unit) Forecast, by Application 2019 & 2032
- Table 35: Rest of Asia Pacific Hearable Electronic Devices Industry Revenue (Million) Forecast, by Application 2019 & 2032
- Table 36: Rest of Asia Pacific Hearable Electronic Devices Industry Volume (K Unit) Forecast, by Application 2019 & 2032
- Table 37: Global Hearable Electronic Devices Industry Revenue Million Forecast, by Country 2019 & 2032
- Table 38: Global Hearable Electronic Devices Industry Volume K Unit Forecast, by Country 2019 & 2032
- Table 39: Hearable Electronic Devices Industry Revenue (Million) Forecast, by Application 2019 & 2032
- Table 40: Hearable Electronic Devices Industry Volume (K Unit) Forecast, by Application 2019 & 2032
- Table 41: Global Hearable Electronic Devices Industry Revenue Million Forecast, by Country 2019 & 2032
- Table 42: Global Hearable Electronic Devices Industry Volume K Unit Forecast, by Country 2019 & 2032
- Table 43: Hearable Electronic Devices Industry Revenue (Million) Forecast, by Application 2019 & 2032
- Table 44: Hearable Electronic Devices Industry Volume (K Unit) Forecast, by Application 2019 & 2032
- Table 45: Global Hearable Electronic Devices Industry Revenue Million Forecast, by Type 2019 & 2032
- Table 46: Global Hearable Electronic Devices Industry Volume K Unit Forecast, by Type 2019 & 2032
- Table 47: Global Hearable Electronic Devices Industry Revenue Million Forecast, by Product 2019 & 2032
- Table 48: Global Hearable Electronic Devices Industry Volume K Unit Forecast, by Product 2019 & 2032
- Table 49: Global Hearable Electronic Devices Industry Revenue Million Forecast, by Country 2019 & 2032
- Table 50: Global Hearable Electronic Devices Industry Volume K Unit Forecast, by Country 2019 & 2032
- Table 51: United States Hearable Electronic Devices Industry Revenue (Million) Forecast, by Application 2019 & 2032
- Table 52: United States Hearable Electronic Devices Industry Volume (K Unit) Forecast, by Application 2019 & 2032
- Table 53: Canada Hearable Electronic Devices Industry Revenue (Million) Forecast, by Application 2019 & 2032
- Table 54: Canada Hearable Electronic Devices Industry Volume (K Unit) Forecast, by Application 2019 & 2032
- Table 55: Global Hearable Electronic Devices Industry Revenue Million Forecast, by Type 2019 & 2032
- Table 56: Global Hearable Electronic Devices Industry Volume K Unit Forecast, by Type 2019 & 2032
- Table 57: Global Hearable Electronic Devices Industry Revenue Million Forecast, by Product 2019 & 2032
- Table 58: Global Hearable Electronic Devices Industry Volume K Unit Forecast, by Product 2019 & 2032
- Table 59: Global Hearable Electronic Devices Industry Revenue Million Forecast, by Country 2019 & 2032
- Table 60: Global Hearable Electronic Devices Industry Volume K Unit Forecast, by Country 2019 & 2032
- Table 61: United Kingdom Hearable Electronic Devices Industry Revenue (Million) Forecast, by Application 2019 & 2032
- Table 62: United Kingdom Hearable Electronic Devices Industry Volume (K Unit) Forecast, by Application 2019 & 2032
- Table 63: Germany Hearable Electronic Devices Industry Revenue (Million) Forecast, by Application 2019 & 2032
- Table 64: Germany Hearable Electronic Devices Industry Volume (K Unit) Forecast, by Application 2019 & 2032
- Table 65: France Hearable Electronic Devices Industry Revenue (Million) Forecast, by Application 2019 & 2032
- Table 66: France Hearable Electronic Devices Industry Volume (K Unit) Forecast, by Application 2019 & 2032
- Table 67: Rest of Europe Hearable Electronic Devices Industry Revenue (Million) Forecast, by Application 2019 & 2032
- Table 68: Rest of Europe Hearable Electronic Devices Industry Volume (K Unit) Forecast, by Application 2019 & 2032
- Table 69: Global Hearable Electronic Devices Industry Revenue Million Forecast, by Type 2019 & 2032
- Table 70: Global Hearable Electronic Devices Industry Volume K Unit Forecast, by Type 2019 & 2032
- Table 71: Global Hearable Electronic Devices Industry Revenue Million Forecast, by Product 2019 & 2032
- Table 72: Global Hearable Electronic Devices Industry Volume K Unit Forecast, by Product 2019 & 2032
- Table 73: Global Hearable Electronic Devices Industry Revenue Million Forecast, by Country 2019 & 2032
- Table 74: Global Hearable Electronic Devices Industry Volume K Unit Forecast, by Country 2019 & 2032
- Table 75: China Hearable Electronic Devices Industry Revenue (Million) Forecast, by Application 2019 & 2032
- Table 76: China Hearable Electronic Devices Industry Volume (K Unit) Forecast, by Application 2019 & 2032
- Table 77: Japan Hearable Electronic Devices Industry Revenue (Million) Forecast, by Application 2019 & 2032
- Table 78: Japan Hearable Electronic Devices Industry Volume (K Unit) Forecast, by Application 2019 & 2032
- Table 79: India Hearable Electronic Devices Industry Revenue (Million) Forecast, by Application 2019 & 2032
- Table 80: India Hearable Electronic Devices Industry Volume (K Unit) Forecast, by Application 2019 & 2032
- Table 81: South Korea Hearable Electronic Devices Industry Revenue (Million) Forecast, by Application 2019 & 2032
- Table 82: South Korea Hearable Electronic Devices Industry Volume (K Unit) Forecast, by Application 2019 & 2032
- Table 83: Rest of Asia Pacific Hearable Electronic Devices Industry Revenue (Million) Forecast, by Application 2019 & 2032
- Table 84: Rest of Asia Pacific Hearable Electronic Devices Industry Volume (K Unit) Forecast, by Application 2019 & 2032
- Table 85: Global Hearable Electronic Devices Industry Revenue Million Forecast, by Type 2019 & 2032
- Table 86: Global Hearable Electronic Devices Industry Volume K Unit Forecast, by Type 2019 & 2032
- Table 87: Global Hearable Electronic Devices Industry Revenue Million Forecast, by Product 2019 & 2032
- Table 88: Global Hearable Electronic Devices Industry Volume K Unit Forecast, by Product 2019 & 2032
- Table 89: Global Hearable Electronic Devices Industry Revenue Million Forecast, by Country 2019 & 2032
- Table 90: Global Hearable Electronic Devices Industry Volume K Unit Forecast, by Country 2019 & 2032
- Table 91: Global Hearable Electronic Devices Industry Revenue Million Forecast, by Type 2019 & 2032
- Table 92: Global Hearable Electronic Devices Industry Volume K Unit Forecast, by Type 2019 & 2032
- Table 93: Global Hearable Electronic Devices Industry Revenue Million Forecast, by Product 2019 & 2032
- Table 94: Global Hearable Electronic Devices Industry Volume K Unit Forecast, by Product 2019 & 2032
- Table 95: Global Hearable Electronic Devices Industry Revenue Million Forecast, by Country 2019 & 2032
- Table 96: Global Hearable Electronic Devices Industry Volume K Unit Forecast, by Country 2019 & 2032
Frequently Asked Questions
1. What is the projected Compound Annual Growth Rate (CAGR) of the Hearable Electronic Devices Industry?
The projected CAGR is approximately 11.70%.
2. Which companies are prominent players in the Hearable Electronic Devices Industry?
Key companies in the market include Bose Corporation, Apple Inc (Incl Beats Electronics), ReSound (GN Group), Xiaomi Corporation, Skullcandy Inc, Samsung Electronics Co Ltd (Harman International Industries Inc (Incl JBL), Sennheiser Electronic GMBH & Co, Starkey Hearing Technologies, Demant A/S, WS Audiology A/S, Sony Corporation.
3. What are the main segments of the Hearable Electronic Devices Industry?
The market segments include Type, Product.
4. Can you provide details about the market size?
The market size is estimated to be USD XX Million as of 2022.
5. What are some drivers contributing to market growth?
Increasing Affinity of the Millennial Population Towards Technologically Advanced Appliances and Rising Number of Smartphone Users; Rise in Demand for Wireless Headphones and Infotainment Devices.
6. What are the notable trends driving market growth?
Rise in Demand for Wireless Headphones and Infotainment Devices to Drive the Market Growth.
7. Are there any restraints impacting market growth?
Optimizing Battery Life of Hearable Device.
8. Can you provide examples of recent developments in the market?
November 2022 - Starkey Partners with Special Olympics International to Bring Hearing Health Services to Athletes in Puerto Rico and provides life-changing health services and hearing instruments to Special Olympics athletes worldwide while helping make healthy hearing more inclusive of people with intellectual disabilities.
9. What pricing options are available for accessing the report?
Pricing options include single-user, multi-user, and enterprise licenses priced at USD 4750, USD 5250, and USD 8750 respectively.
10. Is the market size provided in terms of value or volume?
The market size is provided in terms of value, measured in Million and volume, measured in K Unit.
11. Are there any specific market keywords associated with the report?
Yes, the market keyword associated with the report is "Hearable Electronic Devices Industry," which aids in identifying and referencing the specific market segment covered.
12. How do I determine which pricing option suits my needs best?
The pricing options vary based on user requirements and access needs. Individual users may opt for single-user licenses, while businesses requiring broader access may choose multi-user or enterprise licenses for cost-effective access to the report.
13. Are there any additional resources or data provided in the Hearable Electronic Devices Industry report?
While the report offers comprehensive insights, it's advisable to review the specific contents or supplementary materials provided to ascertain if additional resources or data are available.
14. How can I stay updated on further developments or reports in the Hearable Electronic Devices Industry?
To stay informed about further developments, trends, and reports in the Hearable Electronic Devices Industry, consider subscribing to industry newsletters, following relevant companies and organizations, or regularly checking reputable industry news sources and publications.
Methodology
Step 1 - Identification of Relevant Samples Size from Population Database


Step 2 - Approaches for Defining Global Market Size (Value, Volume* & Price*)

Note*: In applicable scenarios
Step 3 - Data Sources
Primary Research
- Web Analytics
- Survey Reports
- Research Institute
- Latest Research Reports
- Opinion Leaders
Secondary Research
- Annual Reports
- White Paper
- Latest Press Release
- Industry Association
- Paid Database
- Investor Presentations

Step 4 - Data Triangulation
Involves using different sources of information in order to increase the validity of a study
These sources are likely to be stakeholders in a program - participants, other researchers, program staff, other community members, and so on.
Then we put all data in single framework & apply various statistical tools to find out the dynamic on the market.
During the analysis stage, feedback from the stakeholder groups would be compared to determine areas of agreement as well as areas of divergence


