
Key Insights
The Hazardous Location LED Lighting market is experiencing robust growth, projected to reach a substantial size driven by increasing demand across diverse end-user industries. The market's Compound Annual Growth Rate (CAGR) of 8.86% from 2019-2024 indicates a significant upward trajectory. Key drivers include stringent safety regulations in hazardous environments like oil and gas, petrochemicals, and power generation, necessitating the adoption of intrinsically safe and explosion-proof lighting solutions. The inherent energy efficiency and longer lifespan of LED technology compared to traditional lighting options further fuel market expansion. Emerging trends such as smart lighting solutions with remote monitoring and control capabilities, along with advancements in LED technology enhancing brightness and durability, are shaping the market's future. While the initial investment cost for LED lighting might be higher, the long-term cost savings from reduced energy consumption and maintenance outweigh this factor, contributing to widespread adoption. Market segmentation reveals strong growth across various end-user industries, particularly oil & gas and petrochemicals, with Class I and II devices dominating the market due to their suitability for a wider range of hazardous locations. The Asia-Pacific region is anticipated to experience significant growth due to increasing industrialization and infrastructure development, while North America and Europe maintain their strong positions driven by stringent regulations and technological advancements.
The competitive landscape is characterized by a mix of established players and emerging companies. Major players such as ABB, Eaton, and Emerson are leveraging their existing infrastructure and technological expertise to capture market share. However, innovative companies specializing in LED technology and smart lighting solutions are emerging as strong competitors, leading to increased product diversification and enhanced functionalities. The ongoing technological advancements and growing environmental concerns are expected to accelerate the replacement of traditional lighting systems in hazardous locations with energy-efficient and sustainable LED solutions. The market’s future success hinges on continuous innovation, focusing on improving energy efficiency, enhancing safety features, and offering customized solutions tailored to specific industry requirements. This will drive further market expansion in both established and emerging markets over the forecast period (2025-2033).
Hazardous Location LED Lighting Industry Market Report: 2019-2033
This comprehensive report provides an in-depth analysis of the Hazardous Location LED Lighting industry, encompassing market dynamics, growth trends, regional dominance, product landscape, key players, and future outlook. The report covers the period from 2019 to 2033, with 2025 serving as the base and estimated year. The study delves into the parent market of industrial lighting and the child market of hazardous location lighting, offering granular insights for informed decision-making. The market size is presented in million units.
Hazardous Location LED Lighting Industry Market Dynamics & Structure
The hazardous location LED lighting market is characterized by a moderately consolidated structure, with several key players holding significant market share. Market concentration is expected to remain relatively stable throughout the forecast period (2025-2033), although potential M&A activity could alter the landscape. Technological innovation, driven by increasing demand for energy efficiency and improved safety features, is a major driver. Stringent regulatory frameworks governing hazardous area lighting installations present both challenges and opportunities. Competitive product substitutes, primarily traditional fluorescent and high-intensity discharge (HID) lighting, are gradually being replaced due to the superior performance and cost-effectiveness of LED technology. The end-user demographics are diverse, spanning various industries with varying levels of adoption.
- Market Concentration: Moderately consolidated, with top 5 players holding approximately xx% market share in 2025.
- Technological Innovation: Focus on enhanced durability, improved light output, and smart connectivity features.
- Regulatory Frameworks: Compliance with IECEx, ATEX, and other international standards is paramount.
- Competitive Substitutes: Traditional lighting technologies facing gradual decline due to LED advantages.
- M&A Trends: Moderate activity anticipated, driven by expansion strategies and technological integration. xx M&A deals projected between 2025 and 2033.
- Innovation Barriers: High certification costs and rigorous testing procedures for hazardous location approvals.
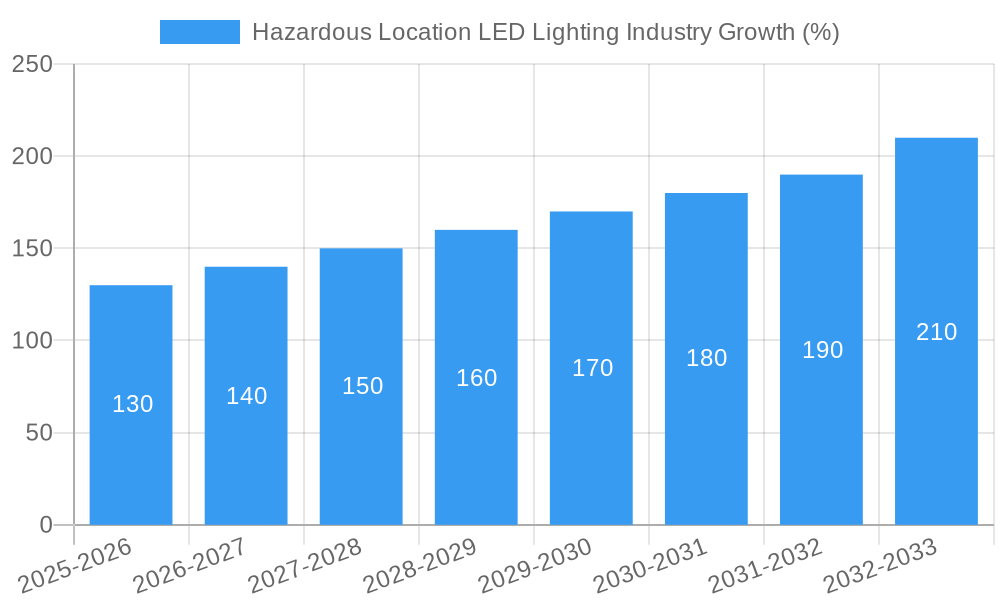
Hazardous Location LED Lighting Industry Growth Trends & Insights
The hazardous location LED lighting market witnessed significant growth during the historical period (2019-2024), driven by increasing adoption across various end-user industries. The market is projected to maintain a robust CAGR of xx% during the forecast period (2025-2033), reaching a market size of xx million units by 2033. This growth is fueled by several factors, including stringent safety regulations promoting LED adoption, technological advancements leading to enhanced product features, and rising awareness of energy efficiency benefits. Consumer behavior is shifting towards longer-lasting, reliable, and sustainable lighting solutions, further bolstering market growth. Technological disruptions, such as the integration of smart sensors and IoT capabilities, are creating new market opportunities.
- Market Size (Million Units): 2019: xx; 2024: xx; 2025: xx; 2033: xx
- CAGR (2025-2033): xx%
- Market Penetration: xx% in 2025, expected to reach xx% by 2033.
Dominant Regions, Countries, or Segments in Hazardous Location LED Lighting Industry
The Oil & Gas and Petrochemical sectors are currently the dominant end-user industries, primarily driving market growth in North America and the Middle East. Class I and II locations, due to their inherent risk, present the largest market segments. Within device types, Zone 1 and Zone 2 fixtures dominate due to the wider range of hazardous locations they cover. Key drivers include stringent safety regulations in these regions, coupled with growing investments in infrastructure development and modernization initiatives.
- Dominant End-User Industry: Oil & Gas
- Dominant Class: Class I
- Dominant Device Type: Zone 1 & Zone 2 fixtures
- Key Regional Drivers: Stringent safety regulations in North America and the Middle East, coupled with robust infrastructure development.
Hazardous Location LED Lighting Industry Product Landscape
Hazardous location LED lighting products are continuously evolving, incorporating advancements in LED technology, improved thermal management, and enhanced safety features. New products offer higher lumen output, longer lifespan, and improved durability in harsh environments. Unique selling propositions (USPs) include energy efficiency, reduced maintenance costs, and improved worker safety. Technological advancements encompass the integration of smart sensors for remote monitoring and predictive maintenance, contributing to further cost savings and operational efficiency.
Key Drivers, Barriers & Challenges in Hazardous Location LED Lighting Industry
Key Drivers:
- Increasing demand for energy-efficient lighting solutions.
- Stringent safety regulations promoting LED adoption.
- Technological advancements leading to superior product performance.
- Rising awareness of the environmental benefits of LED lighting.
Challenges & Restraints:
- High initial investment costs compared to traditional lighting technologies.
- Complex certification and approval processes for hazardous area applications.
- Potential supply chain disruptions impacting the availability of components. The impact of this is estimated to reduce market growth by xx% in 2027.
Emerging Opportunities in Hazardous Location LED Lighting Industry
- Growing adoption in emerging markets with expanding industrial sectors.
- Increased demand for smart lighting solutions with integrated sensors and IoT capabilities.
- Development of specialized lighting fixtures for niche applications within hazardous environments.
Growth Accelerators in the Hazardous Location LED Lighting Industry
Technological advancements, such as improved LED chip efficiency and miniaturization, are driving significant cost reductions and enhanced performance. Strategic partnerships between lighting manufacturers and industrial automation companies are fueling the adoption of smart lighting systems. Market expansion strategies, focusing on emerging economies with robust industrial growth, are further contributing to long-term growth prospects.
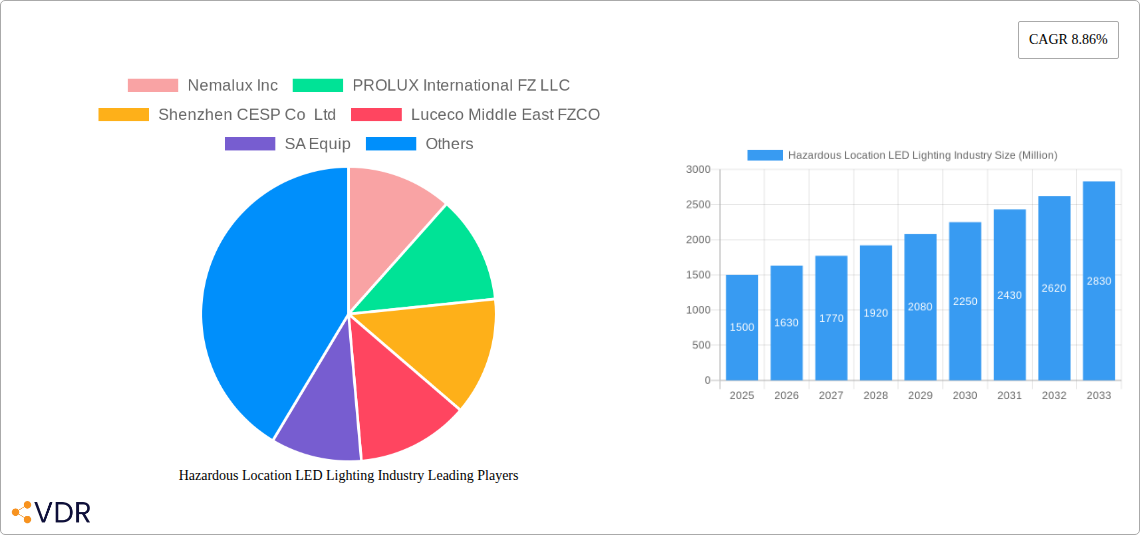
Key Players Shaping the Hazardous Location LED Lighting Market
- Nemalux Inc
- PROLUX International FZ LLC
- Shenzhen CESP Co Ltd
- Luceco Middle East FZCO
- SA Equip
- Glamox UK
- ABB Installation Products Inc
- Azz Inc
- Worksite Lighting LLC
- Larson Electronics
- GE Current
- Technology Co Ltd
- Hilclare Lighting
- Hubbell Limited
- Dialight PLC
- Emerson FZE (Emerson electric co )
- WAROM Technology MENA FZCO
- Digital Lumens Inc (OSRAM)
- Raytec Ltd
- R Stahl Limited
- Munira Lighting (AL Hatimi Trading FZE)
- DCD Technologies ME FZCO
- IKIO LED Lighting
- Eaton Corporation
Notable Milestones in Hazardous Location LED Lighting Industry Sector
- June 2019: Eaton launched Crouse-Hinds series CEAG ExLin linear LEDs for Zone 1 and 2 environments.
- Jan 2020: ABB announced a smart sensor for rotating machines in hazardous areas.
In-Depth Hazardous Location LED Lighting Industry Market Outlook
The hazardous location LED lighting market is poised for sustained growth, driven by technological innovation, expanding applications, and increasing regulatory pressure. Strategic investments in research and development, coupled with strategic partnerships and market expansion initiatives, will further solidify the market's growth trajectory. The long-term potential lies in the integration of smart technologies, offering enhanced safety, efficiency, and cost optimization. The market is expected to witness continued consolidation, with larger players acquiring smaller companies to expand their product portfolios and geographic reach.
Hazardous Location LED Lighting Industry Segmentation
-
1. Class
- 1.1. Class I
- 1.2. Class II
- 1.3. Class III
-
2. Device Type
- 2.1. Zone 0
- 2.2. Zone 20
- 2.3. Zone 1
- 2.4. Zone 21
- 2.5. Zone 22
-
3. End-User Industry
- 3.1. Oil & Gas
- 3.2. Petrochemical
- 3.3. Industrial
- 3.4. Power Generation
- 3.5. Pharmaceutical
- 3.6. Processing
- 3.7. Other End-user Industries
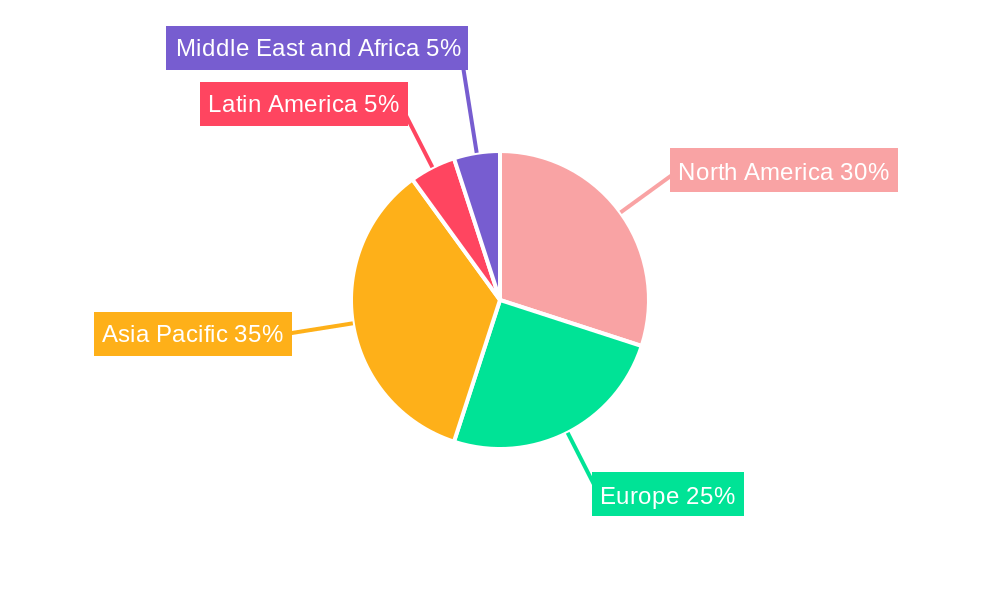
Hazardous Location LED Lighting Industry Segmentation By Geography
- 1. North America
- 2. Europe
- 3. Asia Pacific
- 4. Latin America
- 5. Middle East and Africa
Hazardous Location LED Lighting Industry REPORT HIGHLIGHTS
| Aspects | Details |
|---|---|
| Study Period | 2019-2033 |
| Base Year | 2024 |
| Estimated Year | 2025 |
| Forecast Period | 2025-2033 |
| Historical Period | 2019-2024 |
| Growth Rate | CAGR of 8.86% from 2019-2033 |
| Segmentation |
|
Table of Contents
- 1. Introduction
- 1.1. Research Scope
- 1.2. Market Segmentation
- 1.3. Research Methodology
- 1.4. Definitions and Assumptions
- 2. Executive Summary
- 2.1. Introduction
- 3. Market Dynamics
- 3.1. Introduction
- 3.2. Market Drivers
- 3.2.1. Regulations Promoting Proper Lighting for Worker Safety in Hazardous Locations; Rising Demand for Cost-effective and Energy-efficient LED Lighting Solutions
- 3.3. Market Restrains
- 3.3.1. High Costs of Equipment
- 3.4. Market Trends
- 3.4.1. Rising Demand for Cost-effective and Energy-efficient LED Lighting Solutions will Drive the Market Growth
- 4. Market Factor Analysis
- 4.1. Porters Five Forces
- 4.2. Supply/Value Chain
- 4.3. PESTEL analysis
- 4.4. Market Entropy
- 4.5. Patent/Trademark Analysis
- 5. Global Hazardous Location LED Lighting Industry Analysis, Insights and Forecast, 2019-2031
- 5.1. Market Analysis, Insights and Forecast - by Class
- 5.1.1. Class I
- 5.1.2. Class II
- 5.1.3. Class III
- 5.2. Market Analysis, Insights and Forecast - by Device Type
- 5.2.1. Zone 0
- 5.2.2. Zone 20
- 5.2.3. Zone 1
- 5.2.4. Zone 21
- 5.2.5. Zone 22
- 5.3. Market Analysis, Insights and Forecast - by End-User Industry
- 5.3.1. Oil & Gas
- 5.3.2. Petrochemical
- 5.3.3. Industrial
- 5.3.4. Power Generation
- 5.3.5. Pharmaceutical
- 5.3.6. Processing
- 5.3.7. Other End-user Industries
- 5.4. Market Analysis, Insights and Forecast - by Region
- 5.4.1. North America
- 5.4.2. Europe
- 5.4.3. Asia Pacific
- 5.4.4. Latin America
- 5.4.5. Middle East and Africa
- 5.1. Market Analysis, Insights and Forecast - by Class
- 6. North America Hazardous Location LED Lighting Industry Analysis, Insights and Forecast, 2019-2031
- 6.1. Market Analysis, Insights and Forecast - by Class
- 6.1.1. Class I
- 6.1.2. Class II
- 6.1.3. Class III
- 6.2. Market Analysis, Insights and Forecast - by Device Type
- 6.2.1. Zone 0
- 6.2.2. Zone 20
- 6.2.3. Zone 1
- 6.2.4. Zone 21
- 6.2.5. Zone 22
- 6.3. Market Analysis, Insights and Forecast - by End-User Industry
- 6.3.1. Oil & Gas
- 6.3.2. Petrochemical
- 6.3.3. Industrial
- 6.3.4. Power Generation
- 6.3.5. Pharmaceutical
- 6.3.6. Processing
- 6.3.7. Other End-user Industries
- 6.1. Market Analysis, Insights and Forecast - by Class
- 7. Europe Hazardous Location LED Lighting Industry Analysis, Insights and Forecast, 2019-2031
- 7.1. Market Analysis, Insights and Forecast - by Class
- 7.1.1. Class I
- 7.1.2. Class II
- 7.1.3. Class III
- 7.2. Market Analysis, Insights and Forecast - by Device Type
- 7.2.1. Zone 0
- 7.2.2. Zone 20
- 7.2.3. Zone 1
- 7.2.4. Zone 21
- 7.2.5. Zone 22
- 7.3. Market Analysis, Insights and Forecast - by End-User Industry
- 7.3.1. Oil & Gas
- 7.3.2. Petrochemical
- 7.3.3. Industrial
- 7.3.4. Power Generation
- 7.3.5. Pharmaceutical
- 7.3.6. Processing
- 7.3.7. Other End-user Industries
- 7.1. Market Analysis, Insights and Forecast - by Class
- 8. Asia Pacific Hazardous Location LED Lighting Industry Analysis, Insights and Forecast, 2019-2031
- 8.1. Market Analysis, Insights and Forecast - by Class
- 8.1.1. Class I
- 8.1.2. Class II
- 8.1.3. Class III
- 8.2. Market Analysis, Insights and Forecast - by Device Type
- 8.2.1. Zone 0
- 8.2.2. Zone 20
- 8.2.3. Zone 1
- 8.2.4. Zone 21
- 8.2.5. Zone 22
- 8.3. Market Analysis, Insights and Forecast - by End-User Industry
- 8.3.1. Oil & Gas
- 8.3.2. Petrochemical
- 8.3.3. Industrial
- 8.3.4. Power Generation
- 8.3.5. Pharmaceutical
- 8.3.6. Processing
- 8.3.7. Other End-user Industries
- 8.1. Market Analysis, Insights and Forecast - by Class
- 9. Latin America Hazardous Location LED Lighting Industry Analysis, Insights and Forecast, 2019-2031
- 9.1. Market Analysis, Insights and Forecast - by Class
- 9.1.1. Class I
- 9.1.2. Class II
- 9.1.3. Class III
- 9.2. Market Analysis, Insights and Forecast - by Device Type
- 9.2.1. Zone 0
- 9.2.2. Zone 20
- 9.2.3. Zone 1
- 9.2.4. Zone 21
- 9.2.5. Zone 22
- 9.3. Market Analysis, Insights and Forecast - by End-User Industry
- 9.3.1. Oil & Gas
- 9.3.2. Petrochemical
- 9.3.3. Industrial
- 9.3.4. Power Generation
- 9.3.5. Pharmaceutical
- 9.3.6. Processing
- 9.3.7. Other End-user Industries
- 9.1. Market Analysis, Insights and Forecast - by Class
- 10. Middle East and Africa Hazardous Location LED Lighting Industry Analysis, Insights and Forecast, 2019-2031
- 10.1. Market Analysis, Insights and Forecast - by Class
- 10.1.1. Class I
- 10.1.2. Class II
- 10.1.3. Class III
- 10.2. Market Analysis, Insights and Forecast - by Device Type
- 10.2.1. Zone 0
- 10.2.2. Zone 20
- 10.2.3. Zone 1
- 10.2.4. Zone 21
- 10.2.5. Zone 22
- 10.3. Market Analysis, Insights and Forecast - by End-User Industry
- 10.3.1. Oil & Gas
- 10.3.2. Petrochemical
- 10.3.3. Industrial
- 10.3.4. Power Generation
- 10.3.5. Pharmaceutical
- 10.3.6. Processing
- 10.3.7. Other End-user Industries
- 10.1. Market Analysis, Insights and Forecast - by Class
- 11. North America Hazardous Location LED Lighting Industry Analysis, Insights and Forecast, 2019-2031
- 11.1. Market Analysis, Insights and Forecast - By Country/Sub-region
- 11.1.1.
- 12. Europe Hazardous Location LED Lighting Industry Analysis, Insights and Forecast, 2019-2031
- 12.1. Market Analysis, Insights and Forecast - By Country/Sub-region
- 12.1.1.
- 13. Asia Pacific Hazardous Location LED Lighting Industry Analysis, Insights and Forecast, 2019-2031
- 13.1. Market Analysis, Insights and Forecast - By Country/Sub-region
- 13.1.1.
- 14. Latin America Hazardous Location LED Lighting Industry Analysis, Insights and Forecast, 2019-2031
- 14.1. Market Analysis, Insights and Forecast - By Country/Sub-region
- 14.1.1.
- 15. Middle East and Africa Hazardous Location LED Lighting Industry Analysis, Insights and Forecast, 2019-2031
- 15.1. Market Analysis, Insights and Forecast - By Country/Sub-region
- 15.1.1.
- 16. Competitive Analysis
- 16.1. Global Market Share Analysis 2024
- 16.2. Company Profiles
- 16.2.1 Nemalux Inc
- 16.2.1.1. Overview
- 16.2.1.2. Products
- 16.2.1.3. SWOT Analysis
- 16.2.1.4. Recent Developments
- 16.2.1.5. Financials (Based on Availability)
- 16.2.2 PROLUX International FZ LLC
- 16.2.2.1. Overview
- 16.2.2.2. Products
- 16.2.2.3. SWOT Analysis
- 16.2.2.4. Recent Developments
- 16.2.2.5. Financials (Based on Availability)
- 16.2.3 Shenzhen CESP Co Ltd
- 16.2.3.1. Overview
- 16.2.3.2. Products
- 16.2.3.3. SWOT Analysis
- 16.2.3.4. Recent Developments
- 16.2.3.5. Financials (Based on Availability)
- 16.2.4 Luceco Middle East FZCO
- 16.2.4.1. Overview
- 16.2.4.2. Products
- 16.2.4.3. SWOT Analysis
- 16.2.4.4. Recent Developments
- 16.2.4.5. Financials (Based on Availability)
- 16.2.5 SA Equip
- 16.2.5.1. Overview
- 16.2.5.2. Products
- 16.2.5.3. SWOT Analysis
- 16.2.5.4. Recent Developments
- 16.2.5.5. Financials (Based on Availability)
- 16.2.6 Glamox UK
- 16.2.6.1. Overview
- 16.2.6.2. Products
- 16.2.6.3. SWOT Analysis
- 16.2.6.4. Recent Developments
- 16.2.6.5. Financials (Based on Availability)
- 16.2.7 ABB Installation Products Inc
- 16.2.7.1. Overview
- 16.2.7.2. Products
- 16.2.7.3. SWOT Analysis
- 16.2.7.4. Recent Developments
- 16.2.7.5. Financials (Based on Availability)
- 16.2.8 Azz Inc
- 16.2.8.1. Overview
- 16.2.8.2. Products
- 16.2.8.3. SWOT Analysis
- 16.2.8.4. Recent Developments
- 16.2.8.5. Financials (Based on Availability)
- 16.2.9 Worksite Lighting LLC
- 16.2.9.1. Overview
- 16.2.9.2. Products
- 16.2.9.3. SWOT Analysis
- 16.2.9.4. Recent Developments
- 16.2.9.5. Financials (Based on Availability)
- 16.2.10 Larson Electronics
- 16.2.10.1. Overview
- 16.2.10.2. Products
- 16.2.10.3. SWOT Analysis
- 16.2.10.4. Recent Developments
- 16.2.10.5. Financials (Based on Availability)
- 16.2.11 GE Current
- 16.2.11.1. Overview
- 16.2.11.2. Products
- 16.2.11.3. SWOT Analysis
- 16.2.11.4. Recent Developments
- 16.2.11.5. Financials (Based on Availability)
- 16.2.12 Technology Co Ltd
- 16.2.12.1. Overview
- 16.2.12.2. Products
- 16.2.12.3. SWOT Analysis
- 16.2.12.4. Recent Developments
- 16.2.12.5. Financials (Based on Availability)
- 16.2.13 Hilclare Lighting
- 16.2.13.1. Overview
- 16.2.13.2. Products
- 16.2.13.3. SWOT Analysis
- 16.2.13.4. Recent Developments
- 16.2.13.5. Financials (Based on Availability)
- 16.2.14 Hubbell Limited
- 16.2.14.1. Overview
- 16.2.14.2. Products
- 16.2.14.3. SWOT Analysis
- 16.2.14.4. Recent Developments
- 16.2.14.5. Financials (Based on Availability)
- 16.2.15 Dialight PLC
- 16.2.15.1. Overview
- 16.2.15.2. Products
- 16.2.15.3. SWOT Analysis
- 16.2.15.4. Recent Developments
- 16.2.15.5. Financials (Based on Availability)
- 16.2.16 Emerson FZE (Emerson electric co )
- 16.2.16.1. Overview
- 16.2.16.2. Products
- 16.2.16.3. SWOT Analysis
- 16.2.16.4. Recent Developments
- 16.2.16.5. Financials (Based on Availability)
- 16.2.17 WAROM Technology MENA FZCO
- 16.2.17.1. Overview
- 16.2.17.2. Products
- 16.2.17.3. SWOT Analysis
- 16.2.17.4. Recent Developments
- 16.2.17.5. Financials (Based on Availability)
- 16.2.18 Digital Lumens Inc (OSRAM)
- 16.2.18.1. Overview
- 16.2.18.2. Products
- 16.2.18.3. SWOT Analysis
- 16.2.18.4. Recent Developments
- 16.2.18.5. Financials (Based on Availability)
- 16.2.19 Raytec Ltd
- 16.2.19.1. Overview
- 16.2.19.2. Products
- 16.2.19.3. SWOT Analysis
- 16.2.19.4. Recent Developments
- 16.2.19.5. Financials (Based on Availability)
- 16.2.20 R Stahl Limited
- 16.2.20.1. Overview
- 16.2.20.2. Products
- 16.2.20.3. SWOT Analysis
- 16.2.20.4. Recent Developments
- 16.2.20.5. Financials (Based on Availability)
- 16.2.21 Munira Lighting (AL Hatimi Trading FZE)
- 16.2.21.1. Overview
- 16.2.21.2. Products
- 16.2.21.3. SWOT Analysis
- 16.2.21.4. Recent Developments
- 16.2.21.5. Financials (Based on Availability)
- 16.2.22 DCD Technologies ME FZCO
- 16.2.22.1. Overview
- 16.2.22.2. Products
- 16.2.22.3. SWOT Analysis
- 16.2.22.4. Recent Developments
- 16.2.22.5. Financials (Based on Availability)
- 16.2.23 IKIO LED Lighting
- 16.2.23.1. Overview
- 16.2.23.2. Products
- 16.2.23.3. SWOT Analysis
- 16.2.23.4. Recent Developments
- 16.2.23.5. Financials (Based on Availability)
- 16.2.24 Eaton Corporation
- 16.2.24.1. Overview
- 16.2.24.2. Products
- 16.2.24.3. SWOT Analysis
- 16.2.24.4. Recent Developments
- 16.2.24.5. Financials (Based on Availability)
- 16.2.1 Nemalux Inc
List of Figures
- Figure 1: Global Hazardous Location LED Lighting Industry Revenue Breakdown (Million, %) by Region 2024 & 2032
- Figure 2: North America Hazardous Location LED Lighting Industry Revenue (Million), by Country 2024 & 2032
- Figure 3: North America Hazardous Location LED Lighting Industry Revenue Share (%), by Country 2024 & 2032
- Figure 4: Europe Hazardous Location LED Lighting Industry Revenue (Million), by Country 2024 & 2032
- Figure 5: Europe Hazardous Location LED Lighting Industry Revenue Share (%), by Country 2024 & 2032
- Figure 6: Asia Pacific Hazardous Location LED Lighting Industry Revenue (Million), by Country 2024 & 2032
- Figure 7: Asia Pacific Hazardous Location LED Lighting Industry Revenue Share (%), by Country 2024 & 2032
- Figure 8: Latin America Hazardous Location LED Lighting Industry Revenue (Million), by Country 2024 & 2032
- Figure 9: Latin America Hazardous Location LED Lighting Industry Revenue Share (%), by Country 2024 & 2032
- Figure 10: Middle East and Africa Hazardous Location LED Lighting Industry Revenue (Million), by Country 2024 & 2032
- Figure 11: Middle East and Africa Hazardous Location LED Lighting Industry Revenue Share (%), by Country 2024 & 2032
- Figure 12: North America Hazardous Location LED Lighting Industry Revenue (Million), by Class 2024 & 2032
- Figure 13: North America Hazardous Location LED Lighting Industry Revenue Share (%), by Class 2024 & 2032
- Figure 14: North America Hazardous Location LED Lighting Industry Revenue (Million), by Device Type 2024 & 2032
- Figure 15: North America Hazardous Location LED Lighting Industry Revenue Share (%), by Device Type 2024 & 2032
- Figure 16: North America Hazardous Location LED Lighting Industry Revenue (Million), by End-User Industry 2024 & 2032
- Figure 17: North America Hazardous Location LED Lighting Industry Revenue Share (%), by End-User Industry 2024 & 2032
- Figure 18: North America Hazardous Location LED Lighting Industry Revenue (Million), by Country 2024 & 2032
- Figure 19: North America Hazardous Location LED Lighting Industry Revenue Share (%), by Country 2024 & 2032
- Figure 20: Europe Hazardous Location LED Lighting Industry Revenue (Million), by Class 2024 & 2032
- Figure 21: Europe Hazardous Location LED Lighting Industry Revenue Share (%), by Class 2024 & 2032
- Figure 22: Europe Hazardous Location LED Lighting Industry Revenue (Million), by Device Type 2024 & 2032
- Figure 23: Europe Hazardous Location LED Lighting Industry Revenue Share (%), by Device Type 2024 & 2032
- Figure 24: Europe Hazardous Location LED Lighting Industry Revenue (Million), by End-User Industry 2024 & 2032
- Figure 25: Europe Hazardous Location LED Lighting Industry Revenue Share (%), by End-User Industry 2024 & 2032
- Figure 26: Europe Hazardous Location LED Lighting Industry Revenue (Million), by Country 2024 & 2032
- Figure 27: Europe Hazardous Location LED Lighting Industry Revenue Share (%), by Country 2024 & 2032
- Figure 28: Asia Pacific Hazardous Location LED Lighting Industry Revenue (Million), by Class 2024 & 2032
- Figure 29: Asia Pacific Hazardous Location LED Lighting Industry Revenue Share (%), by Class 2024 & 2032
- Figure 30: Asia Pacific Hazardous Location LED Lighting Industry Revenue (Million), by Device Type 2024 & 2032
- Figure 31: Asia Pacific Hazardous Location LED Lighting Industry Revenue Share (%), by Device Type 2024 & 2032
- Figure 32: Asia Pacific Hazardous Location LED Lighting Industry Revenue (Million), by End-User Industry 2024 & 2032
- Figure 33: Asia Pacific Hazardous Location LED Lighting Industry Revenue Share (%), by End-User Industry 2024 & 2032
- Figure 34: Asia Pacific Hazardous Location LED Lighting Industry Revenue (Million), by Country 2024 & 2032
- Figure 35: Asia Pacific Hazardous Location LED Lighting Industry Revenue Share (%), by Country 2024 & 2032
- Figure 36: Latin America Hazardous Location LED Lighting Industry Revenue (Million), by Class 2024 & 2032
- Figure 37: Latin America Hazardous Location LED Lighting Industry Revenue Share (%), by Class 2024 & 2032
- Figure 38: Latin America Hazardous Location LED Lighting Industry Revenue (Million), by Device Type 2024 & 2032
- Figure 39: Latin America Hazardous Location LED Lighting Industry Revenue Share (%), by Device Type 2024 & 2032
- Figure 40: Latin America Hazardous Location LED Lighting Industry Revenue (Million), by End-User Industry 2024 & 2032
- Figure 41: Latin America Hazardous Location LED Lighting Industry Revenue Share (%), by End-User Industry 2024 & 2032
- Figure 42: Latin America Hazardous Location LED Lighting Industry Revenue (Million), by Country 2024 & 2032
- Figure 43: Latin America Hazardous Location LED Lighting Industry Revenue Share (%), by Country 2024 & 2032
- Figure 44: Middle East and Africa Hazardous Location LED Lighting Industry Revenue (Million), by Class 2024 & 2032
- Figure 45: Middle East and Africa Hazardous Location LED Lighting Industry Revenue Share (%), by Class 2024 & 2032
- Figure 46: Middle East and Africa Hazardous Location LED Lighting Industry Revenue (Million), by Device Type 2024 & 2032
- Figure 47: Middle East and Africa Hazardous Location LED Lighting Industry Revenue Share (%), by Device Type 2024 & 2032
- Figure 48: Middle East and Africa Hazardous Location LED Lighting Industry Revenue (Million), by End-User Industry 2024 & 2032
- Figure 49: Middle East and Africa Hazardous Location LED Lighting Industry Revenue Share (%), by End-User Industry 2024 & 2032
- Figure 50: Middle East and Africa Hazardous Location LED Lighting Industry Revenue (Million), by Country 2024 & 2032
- Figure 51: Middle East and Africa Hazardous Location LED Lighting Industry Revenue Share (%), by Country 2024 & 2032
List of Tables
- Table 1: Global Hazardous Location LED Lighting Industry Revenue Million Forecast, by Region 2019 & 2032
- Table 2: Global Hazardous Location LED Lighting Industry Revenue Million Forecast, by Class 2019 & 2032
- Table 3: Global Hazardous Location LED Lighting Industry Revenue Million Forecast, by Device Type 2019 & 2032
- Table 4: Global Hazardous Location LED Lighting Industry Revenue Million Forecast, by End-User Industry 2019 & 2032
- Table 5: Global Hazardous Location LED Lighting Industry Revenue Million Forecast, by Region 2019 & 2032
- Table 6: Global Hazardous Location LED Lighting Industry Revenue Million Forecast, by Country 2019 & 2032
- Table 7: Hazardous Location LED Lighting Industry Revenue (Million) Forecast, by Application 2019 & 2032
- Table 8: Global Hazardous Location LED Lighting Industry Revenue Million Forecast, by Country 2019 & 2032
- Table 9: Hazardous Location LED Lighting Industry Revenue (Million) Forecast, by Application 2019 & 2032
- Table 10: Global Hazardous Location LED Lighting Industry Revenue Million Forecast, by Country 2019 & 2032
- Table 11: Hazardous Location LED Lighting Industry Revenue (Million) Forecast, by Application 2019 & 2032
- Table 12: Global Hazardous Location LED Lighting Industry Revenue Million Forecast, by Country 2019 & 2032
- Table 13: Hazardous Location LED Lighting Industry Revenue (Million) Forecast, by Application 2019 & 2032
- Table 14: Global Hazardous Location LED Lighting Industry Revenue Million Forecast, by Country 2019 & 2032
- Table 15: Hazardous Location LED Lighting Industry Revenue (Million) Forecast, by Application 2019 & 2032
- Table 16: Global Hazardous Location LED Lighting Industry Revenue Million Forecast, by Class 2019 & 2032
- Table 17: Global Hazardous Location LED Lighting Industry Revenue Million Forecast, by Device Type 2019 & 2032
- Table 18: Global Hazardous Location LED Lighting Industry Revenue Million Forecast, by End-User Industry 2019 & 2032
- Table 19: Global Hazardous Location LED Lighting Industry Revenue Million Forecast, by Country 2019 & 2032
- Table 20: Global Hazardous Location LED Lighting Industry Revenue Million Forecast, by Class 2019 & 2032
- Table 21: Global Hazardous Location LED Lighting Industry Revenue Million Forecast, by Device Type 2019 & 2032
- Table 22: Global Hazardous Location LED Lighting Industry Revenue Million Forecast, by End-User Industry 2019 & 2032
- Table 23: Global Hazardous Location LED Lighting Industry Revenue Million Forecast, by Country 2019 & 2032
- Table 24: Global Hazardous Location LED Lighting Industry Revenue Million Forecast, by Class 2019 & 2032
- Table 25: Global Hazardous Location LED Lighting Industry Revenue Million Forecast, by Device Type 2019 & 2032
- Table 26: Global Hazardous Location LED Lighting Industry Revenue Million Forecast, by End-User Industry 2019 & 2032
- Table 27: Global Hazardous Location LED Lighting Industry Revenue Million Forecast, by Country 2019 & 2032
- Table 28: Global Hazardous Location LED Lighting Industry Revenue Million Forecast, by Class 2019 & 2032
- Table 29: Global Hazardous Location LED Lighting Industry Revenue Million Forecast, by Device Type 2019 & 2032
- Table 30: Global Hazardous Location LED Lighting Industry Revenue Million Forecast, by End-User Industry 2019 & 2032
- Table 31: Global Hazardous Location LED Lighting Industry Revenue Million Forecast, by Country 2019 & 2032
- Table 32: Global Hazardous Location LED Lighting Industry Revenue Million Forecast, by Class 2019 & 2032
- Table 33: Global Hazardous Location LED Lighting Industry Revenue Million Forecast, by Device Type 2019 & 2032
- Table 34: Global Hazardous Location LED Lighting Industry Revenue Million Forecast, by End-User Industry 2019 & 2032
- Table 35: Global Hazardous Location LED Lighting Industry Revenue Million Forecast, by Country 2019 & 2032
Frequently Asked Questions
1. What is the projected Compound Annual Growth Rate (CAGR) of the Hazardous Location LED Lighting Industry?
The projected CAGR is approximately 8.86%.
2. Which companies are prominent players in the Hazardous Location LED Lighting Industry?
Key companies in the market include Nemalux Inc, PROLUX International FZ LLC, Shenzhen CESP Co Ltd, Luceco Middle East FZCO, SA Equip, Glamox UK, ABB Installation Products Inc, Azz Inc, Worksite Lighting LLC, Larson Electronics, GE Current, Technology Co Ltd, Hilclare Lighting, Hubbell Limited, Dialight PLC, Emerson FZE (Emerson electric co ), WAROM Technology MENA FZCO, Digital Lumens Inc (OSRAM), Raytec Ltd, R Stahl Limited, Munira Lighting (AL Hatimi Trading FZE), DCD Technologies ME FZCO, IKIO LED Lighting, Eaton Corporation.
3. What are the main segments of the Hazardous Location LED Lighting Industry?
The market segments include Class, Device Type , End-User Industry .
4. Can you provide details about the market size?
The market size is estimated to be USD XX Million as of 2022.
5. What are some drivers contributing to market growth?
Regulations Promoting Proper Lighting for Worker Safety in Hazardous Locations; Rising Demand for Cost-effective and Energy-efficient LED Lighting Solutions.
6. What are the notable trends driving market growth?
Rising Demand for Cost-effective and Energy-efficient LED Lighting Solutions will Drive the Market Growth.
7. Are there any restraints impacting market growth?
High Costs of Equipment.
8. Can you provide examples of recent developments in the market?
Jan 2020 - ABB announced plans to launch its smart sensor for rotating machines operating in hazardous areas at Hannover Messe 2020. This new generation of smart sensors may provide high-quality data to enable ABB's advanced analytics to be used in hazardous locations. This product launch may further extend the existing scope of applications for ABB smart sensors with a new generation design for hazardous areas.
9. What pricing options are available for accessing the report?
Pricing options include single-user, multi-user, and enterprise licenses priced at USD 4750, USD 5250, and USD 8750 respectively.
10. Is the market size provided in terms of value or volume?
The market size is provided in terms of value, measured in Million.
11. Are there any specific market keywords associated with the report?
Yes, the market keyword associated with the report is "Hazardous Location LED Lighting Industry," which aids in identifying and referencing the specific market segment covered.
12. How do I determine which pricing option suits my needs best?
The pricing options vary based on user requirements and access needs. Individual users may opt for single-user licenses, while businesses requiring broader access may choose multi-user or enterprise licenses for cost-effective access to the report.
13. Are there any additional resources or data provided in the Hazardous Location LED Lighting Industry report?
While the report offers comprehensive insights, it's advisable to review the specific contents or supplementary materials provided to ascertain if additional resources or data are available.
14. How can I stay updated on further developments or reports in the Hazardous Location LED Lighting Industry?
To stay informed about further developments, trends, and reports in the Hazardous Location LED Lighting Industry, consider subscribing to industry newsletters, following relevant companies and organizations, or regularly checking reputable industry news sources and publications.
Methodology
Step 1 - Identification of Relevant Samples Size from Population Database


Step 2 - Approaches for Defining Global Market Size (Value, Volume* & Price*)

Note*: In applicable scenarios
Step 3 - Data Sources
Primary Research
- Web Analytics
- Survey Reports
- Research Institute
- Latest Research Reports
- Opinion Leaders
Secondary Research
- Annual Reports
- White Paper
- Latest Press Release
- Industry Association
- Paid Database
- Investor Presentations

Step 4 - Data Triangulation
Involves using different sources of information in order to increase the validity of a study
These sources are likely to be stakeholders in a program - participants, other researchers, program staff, other community members, and so on.
Then we put all data in single framework & apply various statistical tools to find out the dynamic on the market.
During the analysis stage, feedback from the stakeholder groups would be compared to determine areas of agreement as well as areas of divergence


