
Key Insights
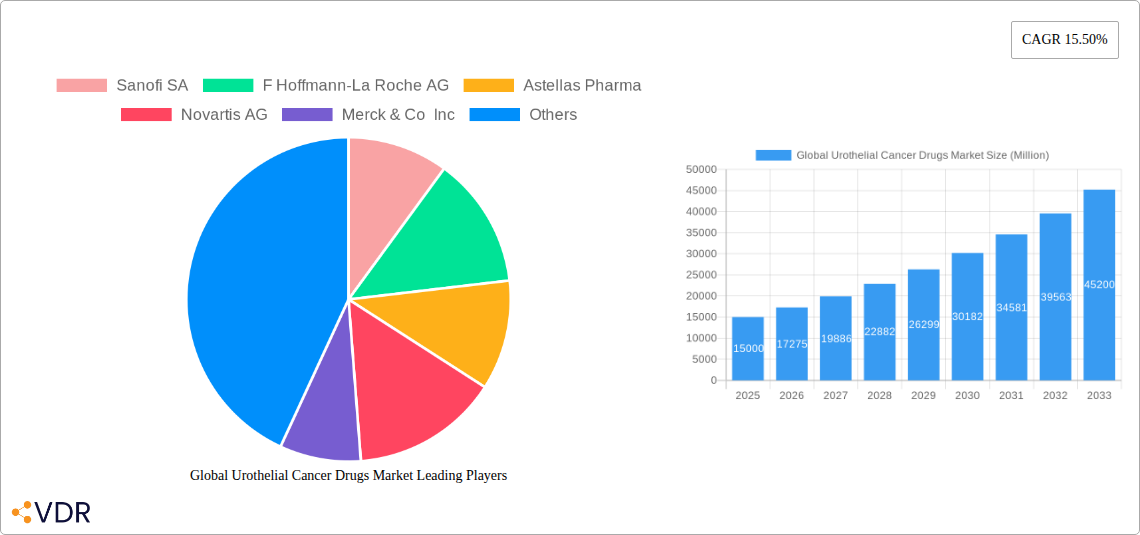
The global urothelial cancer drugs market is experiencing robust growth, projected to reach a substantial market size driven by several key factors. The 15.50% CAGR from 2019-2024 indicates a significant upward trajectory, fueled by increasing prevalence of urothelial cancer, particularly among aging populations worldwide. Advancements in treatment modalities, such as immunotherapy and targeted therapies beyond traditional chemotherapy, are contributing significantly to market expansion. Immunotherapy, in particular, is witnessing high adoption rates due to its potential for improved patient outcomes and increased survival rates. The market is segmented by treatment type, with chemotherapy and immunotherapy representing the major contributors. The geographic landscape showcases strong growth across North America and Europe, driven by robust healthcare infrastructure and high levels of awareness regarding urothelial cancer. However, emerging markets in Asia-Pacific and other regions are also showing promising growth potential due to increasing healthcare expenditure and rising cancer detection rates. Competitive dynamics are shaped by the presence of major pharmaceutical players such as Sanofi SA, Roche, and others actively engaged in research and development, leading to a steady pipeline of novel therapies.
Despite the positive outlook, market growth faces some challenges. The high cost of innovative therapies, particularly immunotherapy, poses a significant barrier to accessibility, particularly in low- and middle-income countries. Furthermore, the development of drug resistance and the need for personalized treatment approaches present ongoing hurdles for pharmaceutical companies. However, ongoing research into improved drug delivery systems and personalized medicine strategies is expected to mitigate these restraints and further drive market expansion in the forecast period (2025-2033). The increasing focus on early detection and screening programs could also contribute to earlier intervention, positively impacting the market's growth. The market's future will hinge on the continued innovation in targeted therapies, improved access to treatment, and successful management of cost-related challenges.
Global Urothelial Cancer Drugs Market: A Comprehensive Report (2019-2033)
This comprehensive report provides an in-depth analysis of the Global Urothelial Cancer Drugs Market, encompassing market dynamics, growth trends, regional dominance, product landscape, and key players. The study period spans from 2019 to 2033, with 2025 serving as the base and estimated year. The forecast period covers 2025-2033, while the historical period encompasses 2019-2024. The market is segmented by treatment, including Chemotherapy and Immunotherapy. This report is invaluable for pharmaceutical companies, investors, and healthcare professionals seeking to understand this crucial sector. The total market size in 2025 is estimated at xx Million.
Global Urothelial Cancer Drugs Market Dynamics & Structure
The global urothelial cancer drugs market is characterized by a moderately concentrated landscape with key players like Sanofi SA, F. Hoffmann-La Roche AG, Astellas Pharma, Novartis AG, Merck & Co Inc, AstraZeneca PLC, Genentech USA Inc, Eisai Co Ltd, UroGen Pharma, Bristol-Myers Squibb Company, GlaxoSmithKline PLC, and Pfizer Inc vying for market share. Market concentration is estimated at xx% in 2025.
- Technological Innovation: Continuous R&D efforts focused on targeted therapies, immunotherapies, and novel drug delivery systems are driving market growth. The development of combination therapies is also a significant factor.
- Regulatory Landscape: Stringent regulatory approvals and pricing policies influence market access and growth trajectory. Variations in regulatory pathways across different geographies create complexities.
- Competitive Dynamics: Intense competition among established players and emerging biotech companies drives innovation and the development of novel treatment options. Strategic collaborations and M&A activities are frequent.
- Market Substitutes: While few direct substitutes exist, alternative treatment modalities like surgery and radiation therapy remain relevant, influencing overall market adoption.
- End-User Demographics: The aging global population and increasing prevalence of urothelial cancer contribute significantly to market growth. The incidence rate is expected to show xx% increase between 2025 and 2033.
- M&A Activity: The past five years have witnessed xx M&A deals in the urothelial cancer drug market, mainly focused on expanding product portfolios and acquiring innovative technologies.
Global Urothelial Cancer Drugs Market Growth Trends & Insights
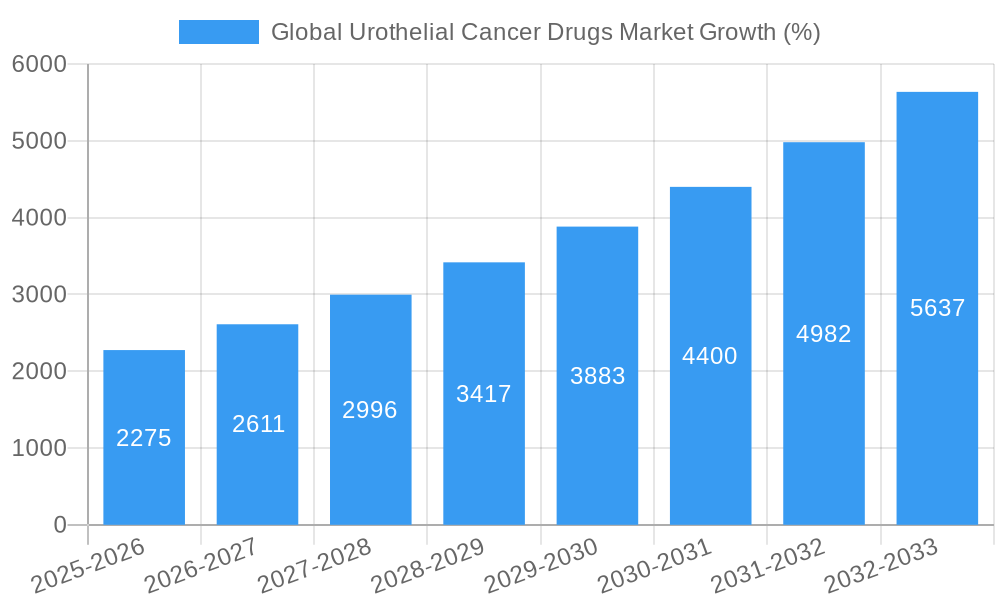
The global urothelial cancer drugs market experienced a CAGR of xx% during the historical period (2019-2024), driven by factors such as increasing prevalence of urothelial cancer, technological advancements in treatment modalities, and rising healthcare expenditure. Market adoption rates are influenced by factors such as treatment efficacy, side effects, and cost-effectiveness. The market is expected to reach xx Million by 2033, with a projected CAGR of xx% during the forecast period (2025-2033). Technological disruptions, such as the development of personalized medicine approaches and biomarker-driven therapies, are reshaping the market landscape. Consumer behavior is shifting towards a preference for less invasive and targeted therapies with improved quality of life. Market penetration is expected to increase by xx percentage points by 2033 due to the factors mentioned above and increased awareness.
Dominant Regions, Countries, or Segments in Global Urothelial Cancer Drugs Market
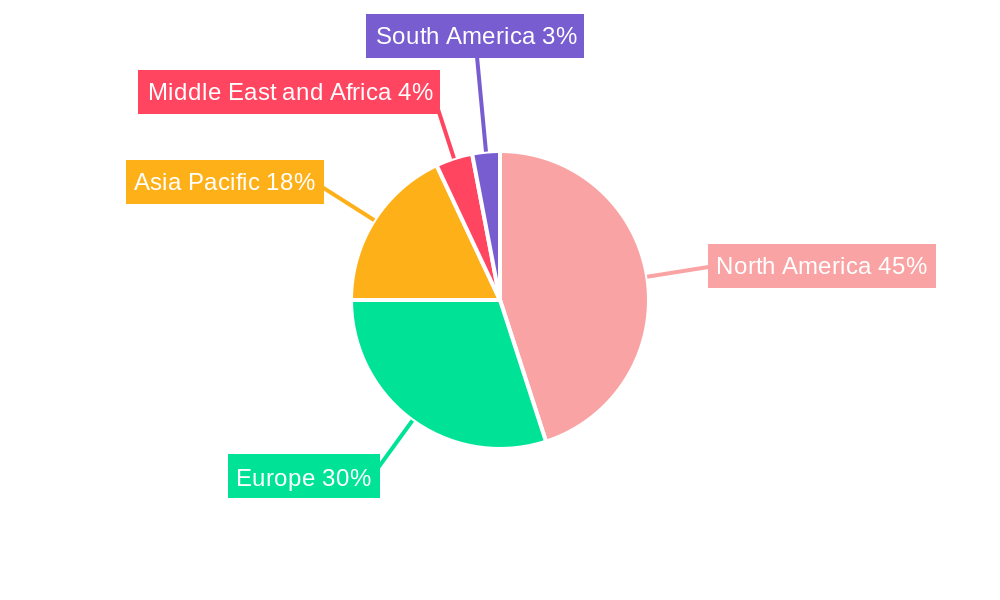
North America currently holds the largest market share within the global urothelial cancer drugs market, followed by Europe and Asia Pacific. This dominance is primarily attributed to factors such as higher healthcare expenditure, advanced healthcare infrastructure, and a larger patient pool.
- North America: High rates of urothelial cancer incidence and prevalence, coupled with robust healthcare infrastructure and high spending capacity, drive market growth. Early adoption of new therapies and favorable regulatory landscape also contribute significantly.
- Europe: The European market is showing steady growth, driven by increasing awareness, improving healthcare access, and rising government initiatives to combat cancer. The market growth is also supported by the launch of new drugs and growing preference for advanced treatment options.
- Asia Pacific: The Asia Pacific market is projected to witness substantial growth in the coming years, due to factors such as increasing prevalence of urothelial cancer, rising healthcare expenditure, and improving healthcare infrastructure. However, limited healthcare access and affordability remain barriers to market penetration.
Within the treatment segment, Immunotherapy is the leading segment, showing substantial growth due to its high efficacy and improved patient outcomes. Chemotherapy remains a significant treatment modality but its market share is expected to decline slightly due to the increasing adoption of targeted therapies.
Global Urothelial Cancer Drugs Market Product Landscape
The urothelial cancer drug market offers a range of treatment options including chemotherapy agents, immunotherapy drugs (e.g., checkpoint inhibitors), and targeted therapies. Recent innovations focus on developing combination therapies, improving drug delivery systems for enhanced efficacy and reduced side effects, and utilizing biomarkers for personalized treatment selection. This has resulted in several new drugs being approved and launched, leading to improved patient outcomes and better overall market growth.
Key Drivers, Barriers & Challenges in Global Urothelial Cancer Drugs Market
Key Drivers:
- Increased prevalence of urothelial cancer globally.
- Technological advancements leading to the development of more effective and targeted therapies.
- Rising healthcare expenditure and increased government funding for cancer research.
Key Challenges and Restraints:
- High cost of treatment limiting accessibility, especially in developing countries.
- Stringent regulatory approvals and pricing policies impacting market access.
- Potential side effects associated with some therapies impacting patient compliance.
- Competition from alternative treatment modalities (surgery, radiation therapy).
Emerging Opportunities in Global Urothelial Cancer Drugs Market
- Growing adoption of personalized medicine approaches, driven by the understanding of tumor-specific characteristics.
- The expansion into untapped markets and unmet medical needs in developing countries.
- Development of novel combination therapies to overcome treatment resistance and improve clinical outcomes.
- Exploration of innovative drug delivery systems that enhance efficacy and minimize side effects.
Growth Accelerators in the Global Urothelial Cancer Drugs Market Industry
The long-term growth of the urothelial cancer drug market will be driven by continued investments in R&D, resulting in more effective and targeted therapies. Strategic partnerships and collaborations between pharmaceutical companies and research institutions are also vital to propel innovation. Expansion into new markets and increased patient awareness through targeted marketing campaigns will further accelerate market growth.
Key Players Shaping the Global Urothelial Cancer Drugs Market Market
- Sanofi SA
- F Hoffmann-La Roche AG
- Astellas Pharma
- Novartis AG
- Merck & Co Inc
- AstraZeneca PLC
- Genentech USA Inc
- Eisai Co Ltd
- UroGen Pharma
- Bristol-Myers Squibb Company
- GlaxoSmithKline PLC
- Pfizer Inc
Notable Milestones in Global Urothelial Cancer Drugs Market Sector
- December 2022: Asieris announced that Hexvix, a bladder cancer diagnostic drug, completed dosing for its first patient in a real-world clinical study at Hainan General Hospital Lecheng Branch. This signifies an expansion into real-world applications for the drug.
- December 2022: Astellas, Seagen, and Merck received FDA acceptance of a supplemental Biologics License Application (sBLA) for PADCEV (enfortumab vedotin-ejfv) with Keytruda (pembrolizumab) for first-line treatment of specific locally advanced or metastatic urothelial cancer patients. This marks a significant advancement in first-line treatment options for urothelial cancer.
In-Depth Global Urothelial Cancer Drugs Market Market Outlook
The future of the global urothelial cancer drugs market is bright, driven by continuous innovation, the development of novel therapies, and an increasing focus on personalized medicine. The market is poised for substantial growth due to rising cancer prevalence, increased investments in research and development, and strategic partnerships that are expected to accelerate market expansion. Opportunities exist for companies to develop and commercialize advanced therapies, catering to unmet needs, and focusing on improving patient outcomes. The market is expected to remain competitive, with companies continuously striving to improve their treatment options and expand their market share.
Global Urothelial Cancer Drugs Market Segmentation
-
1. Treatment
- 1.1. Chemotherapy
- 1.2. Immunotherapy
Global Urothelial Cancer Drugs Market Segmentation By Geography
-
1. North America
- 1.1. United States
- 1.2. Canada
- 1.3. Mexico
-
2. Europe
- 2.1. Germany
- 2.2. United Kingdom
- 2.3. France
- 2.4. Italy
- 2.5. Spain
- 2.6. Rest of Europe
-
3. Asia Pacific
- 3.1. China
- 3.2. Japan
- 3.3. India
- 3.4. Australia
- 3.5. South Korea
- 3.6. Rest of Asia Pacific
-
4. Middle East and Africa
- 4.1. GCC
- 4.2. South Africa
- 4.3. Rest of Middle East and Africa
-
5. South America
- 5.1. Brazil
- 5.2. Argentina
- 5.3. Rest of South America
Global Urothelial Cancer Drugs Market REPORT HIGHLIGHTS
| Aspects | Details |
|---|---|
| Study Period | 2019-2033 |
| Base Year | 2024 |
| Estimated Year | 2025 |
| Forecast Period | 2025-2033 |
| Historical Period | 2019-2024 |
| Growth Rate | CAGR of 15.50% from 2019-2033 |
| Segmentation |
|
Table of Contents
- 1. Introduction
- 1.1. Research Scope
- 1.2. Market Segmentation
- 1.3. Research Methodology
- 1.4. Definitions and Assumptions
- 2. Executive Summary
- 2.1. Introduction
- 3. Market Dynamics
- 3.1. Introduction
- 3.2. Market Drivers
- 3.2.1. Emergence and Priority of Targeted Therapy Among Biopharmaceutical Companies; Growing Burden of Urothelial Cancer; Increasing Awareness on Bladder Diseases and Available Therapies
- 3.3. Market Restrains
- 3.3.1. Side Effects Associated with Drugs
- 3.4. Market Trends
- 3.4.1. The Chemotherapy Segment is Expected to Witness the Fastest Growth Over the Forecast Period
- 4. Market Factor Analysis
- 4.1. Porters Five Forces
- 4.2. Supply/Value Chain
- 4.3. PESTEL analysis
- 4.4. Market Entropy
- 4.5. Patent/Trademark Analysis
- 5. Global Urothelial Cancer Drugs Market Analysis, Insights and Forecast, 2019-2031
- 5.1. Market Analysis, Insights and Forecast - by Treatment
- 5.1.1. Chemotherapy
- 5.1.2. Immunotherapy
- 5.2. Market Analysis, Insights and Forecast - by Region
- 5.2.1. North America
- 5.2.2. Europe
- 5.2.3. Asia Pacific
- 5.2.4. Middle East and Africa
- 5.2.5. South America
- 5.1. Market Analysis, Insights and Forecast - by Treatment
- 6. North America Global Urothelial Cancer Drugs Market Analysis, Insights and Forecast, 2019-2031
- 6.1. Market Analysis, Insights and Forecast - by Treatment
- 6.1.1. Chemotherapy
- 6.1.2. Immunotherapy
- 6.1. Market Analysis, Insights and Forecast - by Treatment
- 7. Europe Global Urothelial Cancer Drugs Market Analysis, Insights and Forecast, 2019-2031
- 7.1. Market Analysis, Insights and Forecast - by Treatment
- 7.1.1. Chemotherapy
- 7.1.2. Immunotherapy
- 7.1. Market Analysis, Insights and Forecast - by Treatment
- 8. Asia Pacific Global Urothelial Cancer Drugs Market Analysis, Insights and Forecast, 2019-2031
- 8.1. Market Analysis, Insights and Forecast - by Treatment
- 8.1.1. Chemotherapy
- 8.1.2. Immunotherapy
- 8.1. Market Analysis, Insights and Forecast - by Treatment
- 9. Middle East and Africa Global Urothelial Cancer Drugs Market Analysis, Insights and Forecast, 2019-2031
- 9.1. Market Analysis, Insights and Forecast - by Treatment
- 9.1.1. Chemotherapy
- 9.1.2. Immunotherapy
- 9.1. Market Analysis, Insights and Forecast - by Treatment
- 10. South America Global Urothelial Cancer Drugs Market Analysis, Insights and Forecast, 2019-2031
- 10.1. Market Analysis, Insights and Forecast - by Treatment
- 10.1.1. Chemotherapy
- 10.1.2. Immunotherapy
- 10.1. Market Analysis, Insights and Forecast - by Treatment
- 11. North America Global Urothelial Cancer Drugs Market Analysis, Insights and Forecast, 2019-2031
- 11.1. Market Analysis, Insights and Forecast - By Country/Sub-region
- 11.1.1 United States
- 11.1.2 Canada
- 11.1.3 Mexico
- 12. Europe Global Urothelial Cancer Drugs Market Analysis, Insights and Forecast, 2019-2031
- 12.1. Market Analysis, Insights and Forecast - By Country/Sub-region
- 12.1.1 Germany
- 12.1.2 United Kingdom
- 12.1.3 France
- 12.1.4 Italy
- 12.1.5 Spain
- 12.1.6 Rest of Europe
- 13. Asia Pacific Global Urothelial Cancer Drugs Market Analysis, Insights and Forecast, 2019-2031
- 13.1. Market Analysis, Insights and Forecast - By Country/Sub-region
- 13.1.1 China
- 13.1.2 Japan
- 13.1.3 India
- 13.1.4 Australia
- 13.1.5 South Korea
- 13.1.6 Rest of Asia Pacific
- 14. Middle East and Africa Global Urothelial Cancer Drugs Market Analysis, Insights and Forecast, 2019-2031
- 14.1. Market Analysis, Insights and Forecast - By Country/Sub-region
- 14.1.1 GCC
- 14.1.2 South Africa
- 14.1.3 Rest of Middle East and Africa
- 15. South America Global Urothelial Cancer Drugs Market Analysis, Insights and Forecast, 2019-2031
- 15.1. Market Analysis, Insights and Forecast - By Country/Sub-region
- 15.1.1 Brazil
- 15.1.2 Argentina
- 15.1.3 Rest of South America
- 16. Competitive Analysis
- 16.1. Market Share Analysis 2024
- 16.2. Company Profiles
- 16.2.1 Sanofi SA
- 16.2.1.1. Overview
- 16.2.1.2. Products
- 16.2.1.3. SWOT Analysis
- 16.2.1.4. Recent Developments
- 16.2.1.5. Financials (Based on Availability)
- 16.2.2 F Hoffmann-La Roche AG
- 16.2.2.1. Overview
- 16.2.2.2. Products
- 16.2.2.3. SWOT Analysis
- 16.2.2.4. Recent Developments
- 16.2.2.5. Financials (Based on Availability)
- 16.2.3 Astellas Pharma
- 16.2.3.1. Overview
- 16.2.3.2. Products
- 16.2.3.3. SWOT Analysis
- 16.2.3.4. Recent Developments
- 16.2.3.5. Financials (Based on Availability)
- 16.2.4 Novartis AG
- 16.2.4.1. Overview
- 16.2.4.2. Products
- 16.2.4.3. SWOT Analysis
- 16.2.4.4. Recent Developments
- 16.2.4.5. Financials (Based on Availability)
- 16.2.5 Merck & Co Inc
- 16.2.5.1. Overview
- 16.2.5.2. Products
- 16.2.5.3. SWOT Analysis
- 16.2.5.4. Recent Developments
- 16.2.5.5. Financials (Based on Availability)
- 16.2.6 AstraZeneca PLC
- 16.2.6.1. Overview
- 16.2.6.2. Products
- 16.2.6.3. SWOT Analysis
- 16.2.6.4. Recent Developments
- 16.2.6.5. Financials (Based on Availability)
- 16.2.7 Genentech USA Inc
- 16.2.7.1. Overview
- 16.2.7.2. Products
- 16.2.7.3. SWOT Analysis
- 16.2.7.4. Recent Developments
- 16.2.7.5. Financials (Based on Availability)
- 16.2.8 Eisai Co Ltd
- 16.2.8.1. Overview
- 16.2.8.2. Products
- 16.2.8.3. SWOT Analysis
- 16.2.8.4. Recent Developments
- 16.2.8.5. Financials (Based on Availability)
- 16.2.9 UroGen Pharma
- 16.2.9.1. Overview
- 16.2.9.2. Products
- 16.2.9.3. SWOT Analysis
- 16.2.9.4. Recent Developments
- 16.2.9.5. Financials (Based on Availability)
- 16.2.10 Bristol-Myers Squibb Company
- 16.2.10.1. Overview
- 16.2.10.2. Products
- 16.2.10.3. SWOT Analysis
- 16.2.10.4. Recent Developments
- 16.2.10.5. Financials (Based on Availability)
- 16.2.11 GlaxoSmithKline PLC
- 16.2.11.1. Overview
- 16.2.11.2. Products
- 16.2.11.3. SWOT Analysis
- 16.2.11.4. Recent Developments
- 16.2.11.5. Financials (Based on Availability)
- 16.2.12 Pfizer Inc
- 16.2.12.1. Overview
- 16.2.12.2. Products
- 16.2.12.3. SWOT Analysis
- 16.2.12.4. Recent Developments
- 16.2.12.5. Financials (Based on Availability)
- 16.2.1 Sanofi SA
List of Figures
- Figure 1: Global Global Urothelial Cancer Drugs Market Revenue Breakdown (Million, %) by Region 2024 & 2032
- Figure 2: Global Global Urothelial Cancer Drugs Market Volume Breakdown (K Unit, %) by Region 2024 & 2032
- Figure 3: North America Global Urothelial Cancer Drugs Market Revenue (Million), by Country 2024 & 2032
- Figure 4: North America Global Urothelial Cancer Drugs Market Volume (K Unit), by Country 2024 & 2032
- Figure 5: North America Global Urothelial Cancer Drugs Market Revenue Share (%), by Country 2024 & 2032
- Figure 6: North America Global Urothelial Cancer Drugs Market Volume Share (%), by Country 2024 & 2032
- Figure 7: Europe Global Urothelial Cancer Drugs Market Revenue (Million), by Country 2024 & 2032
- Figure 8: Europe Global Urothelial Cancer Drugs Market Volume (K Unit), by Country 2024 & 2032
- Figure 9: Europe Global Urothelial Cancer Drugs Market Revenue Share (%), by Country 2024 & 2032
- Figure 10: Europe Global Urothelial Cancer Drugs Market Volume Share (%), by Country 2024 & 2032
- Figure 11: Asia Pacific Global Urothelial Cancer Drugs Market Revenue (Million), by Country 2024 & 2032
- Figure 12: Asia Pacific Global Urothelial Cancer Drugs Market Volume (K Unit), by Country 2024 & 2032
- Figure 13: Asia Pacific Global Urothelial Cancer Drugs Market Revenue Share (%), by Country 2024 & 2032
- Figure 14: Asia Pacific Global Urothelial Cancer Drugs Market Volume Share (%), by Country 2024 & 2032
- Figure 15: Middle East and Africa Global Urothelial Cancer Drugs Market Revenue (Million), by Country 2024 & 2032
- Figure 16: Middle East and Africa Global Urothelial Cancer Drugs Market Volume (K Unit), by Country 2024 & 2032
- Figure 17: Middle East and Africa Global Urothelial Cancer Drugs Market Revenue Share (%), by Country 2024 & 2032
- Figure 18: Middle East and Africa Global Urothelial Cancer Drugs Market Volume Share (%), by Country 2024 & 2032
- Figure 19: South America Global Urothelial Cancer Drugs Market Revenue (Million), by Country 2024 & 2032
- Figure 20: South America Global Urothelial Cancer Drugs Market Volume (K Unit), by Country 2024 & 2032
- Figure 21: South America Global Urothelial Cancer Drugs Market Revenue Share (%), by Country 2024 & 2032
- Figure 22: South America Global Urothelial Cancer Drugs Market Volume Share (%), by Country 2024 & 2032
- Figure 23: North America Global Urothelial Cancer Drugs Market Revenue (Million), by Treatment 2024 & 2032
- Figure 24: North America Global Urothelial Cancer Drugs Market Volume (K Unit), by Treatment 2024 & 2032
- Figure 25: North America Global Urothelial Cancer Drugs Market Revenue Share (%), by Treatment 2024 & 2032
- Figure 26: North America Global Urothelial Cancer Drugs Market Volume Share (%), by Treatment 2024 & 2032
- Figure 27: North America Global Urothelial Cancer Drugs Market Revenue (Million), by Country 2024 & 2032
- Figure 28: North America Global Urothelial Cancer Drugs Market Volume (K Unit), by Country 2024 & 2032
- Figure 29: North America Global Urothelial Cancer Drugs Market Revenue Share (%), by Country 2024 & 2032
- Figure 30: North America Global Urothelial Cancer Drugs Market Volume Share (%), by Country 2024 & 2032
- Figure 31: Europe Global Urothelial Cancer Drugs Market Revenue (Million), by Treatment 2024 & 2032
- Figure 32: Europe Global Urothelial Cancer Drugs Market Volume (K Unit), by Treatment 2024 & 2032
- Figure 33: Europe Global Urothelial Cancer Drugs Market Revenue Share (%), by Treatment 2024 & 2032
- Figure 34: Europe Global Urothelial Cancer Drugs Market Volume Share (%), by Treatment 2024 & 2032
- Figure 35: Europe Global Urothelial Cancer Drugs Market Revenue (Million), by Country 2024 & 2032
- Figure 36: Europe Global Urothelial Cancer Drugs Market Volume (K Unit), by Country 2024 & 2032
- Figure 37: Europe Global Urothelial Cancer Drugs Market Revenue Share (%), by Country 2024 & 2032
- Figure 38: Europe Global Urothelial Cancer Drugs Market Volume Share (%), by Country 2024 & 2032
- Figure 39: Asia Pacific Global Urothelial Cancer Drugs Market Revenue (Million), by Treatment 2024 & 2032
- Figure 40: Asia Pacific Global Urothelial Cancer Drugs Market Volume (K Unit), by Treatment 2024 & 2032
- Figure 41: Asia Pacific Global Urothelial Cancer Drugs Market Revenue Share (%), by Treatment 2024 & 2032
- Figure 42: Asia Pacific Global Urothelial Cancer Drugs Market Volume Share (%), by Treatment 2024 & 2032
- Figure 43: Asia Pacific Global Urothelial Cancer Drugs Market Revenue (Million), by Country 2024 & 2032
- Figure 44: Asia Pacific Global Urothelial Cancer Drugs Market Volume (K Unit), by Country 2024 & 2032
- Figure 45: Asia Pacific Global Urothelial Cancer Drugs Market Revenue Share (%), by Country 2024 & 2032
- Figure 46: Asia Pacific Global Urothelial Cancer Drugs Market Volume Share (%), by Country 2024 & 2032
- Figure 47: Middle East and Africa Global Urothelial Cancer Drugs Market Revenue (Million), by Treatment 2024 & 2032
- Figure 48: Middle East and Africa Global Urothelial Cancer Drugs Market Volume (K Unit), by Treatment 2024 & 2032
- Figure 49: Middle East and Africa Global Urothelial Cancer Drugs Market Revenue Share (%), by Treatment 2024 & 2032
- Figure 50: Middle East and Africa Global Urothelial Cancer Drugs Market Volume Share (%), by Treatment 2024 & 2032
- Figure 51: Middle East and Africa Global Urothelial Cancer Drugs Market Revenue (Million), by Country 2024 & 2032
- Figure 52: Middle East and Africa Global Urothelial Cancer Drugs Market Volume (K Unit), by Country 2024 & 2032
- Figure 53: Middle East and Africa Global Urothelial Cancer Drugs Market Revenue Share (%), by Country 2024 & 2032
- Figure 54: Middle East and Africa Global Urothelial Cancer Drugs Market Volume Share (%), by Country 2024 & 2032
- Figure 55: South America Global Urothelial Cancer Drugs Market Revenue (Million), by Treatment 2024 & 2032
- Figure 56: South America Global Urothelial Cancer Drugs Market Volume (K Unit), by Treatment 2024 & 2032
- Figure 57: South America Global Urothelial Cancer Drugs Market Revenue Share (%), by Treatment 2024 & 2032
- Figure 58: South America Global Urothelial Cancer Drugs Market Volume Share (%), by Treatment 2024 & 2032
- Figure 59: South America Global Urothelial Cancer Drugs Market Revenue (Million), by Country 2024 & 2032
- Figure 60: South America Global Urothelial Cancer Drugs Market Volume (K Unit), by Country 2024 & 2032
- Figure 61: South America Global Urothelial Cancer Drugs Market Revenue Share (%), by Country 2024 & 2032
- Figure 62: South America Global Urothelial Cancer Drugs Market Volume Share (%), by Country 2024 & 2032
List of Tables
- Table 1: Global Urothelial Cancer Drugs Market Revenue Million Forecast, by Region 2019 & 2032
- Table 2: Global Urothelial Cancer Drugs Market Volume K Unit Forecast, by Region 2019 & 2032
- Table 3: Global Urothelial Cancer Drugs Market Revenue Million Forecast, by Treatment 2019 & 2032
- Table 4: Global Urothelial Cancer Drugs Market Volume K Unit Forecast, by Treatment 2019 & 2032
- Table 5: Global Urothelial Cancer Drugs Market Revenue Million Forecast, by Region 2019 & 2032
- Table 6: Global Urothelial Cancer Drugs Market Volume K Unit Forecast, by Region 2019 & 2032
- Table 7: Global Urothelial Cancer Drugs Market Revenue Million Forecast, by Country 2019 & 2032
- Table 8: Global Urothelial Cancer Drugs Market Volume K Unit Forecast, by Country 2019 & 2032
- Table 9: United States Global Urothelial Cancer Drugs Market Revenue (Million) Forecast, by Application 2019 & 2032
- Table 10: United States Global Urothelial Cancer Drugs Market Volume (K Unit) Forecast, by Application 2019 & 2032
- Table 11: Canada Global Urothelial Cancer Drugs Market Revenue (Million) Forecast, by Application 2019 & 2032
- Table 12: Canada Global Urothelial Cancer Drugs Market Volume (K Unit) Forecast, by Application 2019 & 2032
- Table 13: Mexico Global Urothelial Cancer Drugs Market Revenue (Million) Forecast, by Application 2019 & 2032
- Table 14: Mexico Global Urothelial Cancer Drugs Market Volume (K Unit) Forecast, by Application 2019 & 2032
- Table 15: Global Urothelial Cancer Drugs Market Revenue Million Forecast, by Country 2019 & 2032
- Table 16: Global Urothelial Cancer Drugs Market Volume K Unit Forecast, by Country 2019 & 2032
- Table 17: Germany Global Urothelial Cancer Drugs Market Revenue (Million) Forecast, by Application 2019 & 2032
- Table 18: Germany Global Urothelial Cancer Drugs Market Volume (K Unit) Forecast, by Application 2019 & 2032
- Table 19: United Kingdom Global Urothelial Cancer Drugs Market Revenue (Million) Forecast, by Application 2019 & 2032
- Table 20: United Kingdom Global Urothelial Cancer Drugs Market Volume (K Unit) Forecast, by Application 2019 & 2032
- Table 21: France Global Urothelial Cancer Drugs Market Revenue (Million) Forecast, by Application 2019 & 2032
- Table 22: France Global Urothelial Cancer Drugs Market Volume (K Unit) Forecast, by Application 2019 & 2032
- Table 23: Italy Global Urothelial Cancer Drugs Market Revenue (Million) Forecast, by Application 2019 & 2032
- Table 24: Italy Global Urothelial Cancer Drugs Market Volume (K Unit) Forecast, by Application 2019 & 2032
- Table 25: Spain Global Urothelial Cancer Drugs Market Revenue (Million) Forecast, by Application 2019 & 2032
- Table 26: Spain Global Urothelial Cancer Drugs Market Volume (K Unit) Forecast, by Application 2019 & 2032
- Table 27: Rest of Europe Global Urothelial Cancer Drugs Market Revenue (Million) Forecast, by Application 2019 & 2032
- Table 28: Rest of Europe Global Urothelial Cancer Drugs Market Volume (K Unit) Forecast, by Application 2019 & 2032
- Table 29: Global Urothelial Cancer Drugs Market Revenue Million Forecast, by Country 2019 & 2032
- Table 30: Global Urothelial Cancer Drugs Market Volume K Unit Forecast, by Country 2019 & 2032
- Table 31: China Global Urothelial Cancer Drugs Market Revenue (Million) Forecast, by Application 2019 & 2032
- Table 32: China Global Urothelial Cancer Drugs Market Volume (K Unit) Forecast, by Application 2019 & 2032
- Table 33: Japan Global Urothelial Cancer Drugs Market Revenue (Million) Forecast, by Application 2019 & 2032
- Table 34: Japan Global Urothelial Cancer Drugs Market Volume (K Unit) Forecast, by Application 2019 & 2032
- Table 35: India Global Urothelial Cancer Drugs Market Revenue (Million) Forecast, by Application 2019 & 2032
- Table 36: India Global Urothelial Cancer Drugs Market Volume (K Unit) Forecast, by Application 2019 & 2032
- Table 37: Australia Global Urothelial Cancer Drugs Market Revenue (Million) Forecast, by Application 2019 & 2032
- Table 38: Australia Global Urothelial Cancer Drugs Market Volume (K Unit) Forecast, by Application 2019 & 2032
- Table 39: South Korea Global Urothelial Cancer Drugs Market Revenue (Million) Forecast, by Application 2019 & 2032
- Table 40: South Korea Global Urothelial Cancer Drugs Market Volume (K Unit) Forecast, by Application 2019 & 2032
- Table 41: Rest of Asia Pacific Global Urothelial Cancer Drugs Market Revenue (Million) Forecast, by Application 2019 & 2032
- Table 42: Rest of Asia Pacific Global Urothelial Cancer Drugs Market Volume (K Unit) Forecast, by Application 2019 & 2032
- Table 43: Global Urothelial Cancer Drugs Market Revenue Million Forecast, by Country 2019 & 2032
- Table 44: Global Urothelial Cancer Drugs Market Volume K Unit Forecast, by Country 2019 & 2032
- Table 45: GCC Global Urothelial Cancer Drugs Market Revenue (Million) Forecast, by Application 2019 & 2032
- Table 46: GCC Global Urothelial Cancer Drugs Market Volume (K Unit) Forecast, by Application 2019 & 2032
- Table 47: South Africa Global Urothelial Cancer Drugs Market Revenue (Million) Forecast, by Application 2019 & 2032
- Table 48: South Africa Global Urothelial Cancer Drugs Market Volume (K Unit) Forecast, by Application 2019 & 2032
- Table 49: Rest of Middle East and Africa Global Urothelial Cancer Drugs Market Revenue (Million) Forecast, by Application 2019 & 2032
- Table 50: Rest of Middle East and Africa Global Urothelial Cancer Drugs Market Volume (K Unit) Forecast, by Application 2019 & 2032
- Table 51: Global Urothelial Cancer Drugs Market Revenue Million Forecast, by Country 2019 & 2032
- Table 52: Global Urothelial Cancer Drugs Market Volume K Unit Forecast, by Country 2019 & 2032
- Table 53: Brazil Global Urothelial Cancer Drugs Market Revenue (Million) Forecast, by Application 2019 & 2032
- Table 54: Brazil Global Urothelial Cancer Drugs Market Volume (K Unit) Forecast, by Application 2019 & 2032
- Table 55: Argentina Global Urothelial Cancer Drugs Market Revenue (Million) Forecast, by Application 2019 & 2032
- Table 56: Argentina Global Urothelial Cancer Drugs Market Volume (K Unit) Forecast, by Application 2019 & 2032
- Table 57: Rest of South America Global Urothelial Cancer Drugs Market Revenue (Million) Forecast, by Application 2019 & 2032
- Table 58: Rest of South America Global Urothelial Cancer Drugs Market Volume (K Unit) Forecast, by Application 2019 & 2032
- Table 59: Global Urothelial Cancer Drugs Market Revenue Million Forecast, by Treatment 2019 & 2032
- Table 60: Global Urothelial Cancer Drugs Market Volume K Unit Forecast, by Treatment 2019 & 2032
- Table 61: Global Urothelial Cancer Drugs Market Revenue Million Forecast, by Country 2019 & 2032
- Table 62: Global Urothelial Cancer Drugs Market Volume K Unit Forecast, by Country 2019 & 2032
- Table 63: United States Global Urothelial Cancer Drugs Market Revenue (Million) Forecast, by Application 2019 & 2032
- Table 64: United States Global Urothelial Cancer Drugs Market Volume (K Unit) Forecast, by Application 2019 & 2032
- Table 65: Canada Global Urothelial Cancer Drugs Market Revenue (Million) Forecast, by Application 2019 & 2032
- Table 66: Canada Global Urothelial Cancer Drugs Market Volume (K Unit) Forecast, by Application 2019 & 2032
- Table 67: Mexico Global Urothelial Cancer Drugs Market Revenue (Million) Forecast, by Application 2019 & 2032
- Table 68: Mexico Global Urothelial Cancer Drugs Market Volume (K Unit) Forecast, by Application 2019 & 2032
- Table 69: Global Urothelial Cancer Drugs Market Revenue Million Forecast, by Treatment 2019 & 2032
- Table 70: Global Urothelial Cancer Drugs Market Volume K Unit Forecast, by Treatment 2019 & 2032
- Table 71: Global Urothelial Cancer Drugs Market Revenue Million Forecast, by Country 2019 & 2032
- Table 72: Global Urothelial Cancer Drugs Market Volume K Unit Forecast, by Country 2019 & 2032
- Table 73: Germany Global Urothelial Cancer Drugs Market Revenue (Million) Forecast, by Application 2019 & 2032
- Table 74: Germany Global Urothelial Cancer Drugs Market Volume (K Unit) Forecast, by Application 2019 & 2032
- Table 75: United Kingdom Global Urothelial Cancer Drugs Market Revenue (Million) Forecast, by Application 2019 & 2032
- Table 76: United Kingdom Global Urothelial Cancer Drugs Market Volume (K Unit) Forecast, by Application 2019 & 2032
- Table 77: France Global Urothelial Cancer Drugs Market Revenue (Million) Forecast, by Application 2019 & 2032
- Table 78: France Global Urothelial Cancer Drugs Market Volume (K Unit) Forecast, by Application 2019 & 2032
- Table 79: Italy Global Urothelial Cancer Drugs Market Revenue (Million) Forecast, by Application 2019 & 2032
- Table 80: Italy Global Urothelial Cancer Drugs Market Volume (K Unit) Forecast, by Application 2019 & 2032
- Table 81: Spain Global Urothelial Cancer Drugs Market Revenue (Million) Forecast, by Application 2019 & 2032
- Table 82: Spain Global Urothelial Cancer Drugs Market Volume (K Unit) Forecast, by Application 2019 & 2032
- Table 83: Rest of Europe Global Urothelial Cancer Drugs Market Revenue (Million) Forecast, by Application 2019 & 2032
- Table 84: Rest of Europe Global Urothelial Cancer Drugs Market Volume (K Unit) Forecast, by Application 2019 & 2032
- Table 85: Global Urothelial Cancer Drugs Market Revenue Million Forecast, by Treatment 2019 & 2032
- Table 86: Global Urothelial Cancer Drugs Market Volume K Unit Forecast, by Treatment 2019 & 2032
- Table 87: Global Urothelial Cancer Drugs Market Revenue Million Forecast, by Country 2019 & 2032
- Table 88: Global Urothelial Cancer Drugs Market Volume K Unit Forecast, by Country 2019 & 2032
- Table 89: China Global Urothelial Cancer Drugs Market Revenue (Million) Forecast, by Application 2019 & 2032
- Table 90: China Global Urothelial Cancer Drugs Market Volume (K Unit) Forecast, by Application 2019 & 2032
- Table 91: Japan Global Urothelial Cancer Drugs Market Revenue (Million) Forecast, by Application 2019 & 2032
- Table 92: Japan Global Urothelial Cancer Drugs Market Volume (K Unit) Forecast, by Application 2019 & 2032
- Table 93: India Global Urothelial Cancer Drugs Market Revenue (Million) Forecast, by Application 2019 & 2032
- Table 94: India Global Urothelial Cancer Drugs Market Volume (K Unit) Forecast, by Application 2019 & 2032
- Table 95: Australia Global Urothelial Cancer Drugs Market Revenue (Million) Forecast, by Application 2019 & 2032
- Table 96: Australia Global Urothelial Cancer Drugs Market Volume (K Unit) Forecast, by Application 2019 & 2032
- Table 97: South Korea Global Urothelial Cancer Drugs Market Revenue (Million) Forecast, by Application 2019 & 2032
- Table 98: South Korea Global Urothelial Cancer Drugs Market Volume (K Unit) Forecast, by Application 2019 & 2032
- Table 99: Rest of Asia Pacific Global Urothelial Cancer Drugs Market Revenue (Million) Forecast, by Application 2019 & 2032
- Table 100: Rest of Asia Pacific Global Urothelial Cancer Drugs Market Volume (K Unit) Forecast, by Application 2019 & 2032
- Table 101: Global Urothelial Cancer Drugs Market Revenue Million Forecast, by Treatment 2019 & 2032
- Table 102: Global Urothelial Cancer Drugs Market Volume K Unit Forecast, by Treatment 2019 & 2032
- Table 103: Global Urothelial Cancer Drugs Market Revenue Million Forecast, by Country 2019 & 2032
- Table 104: Global Urothelial Cancer Drugs Market Volume K Unit Forecast, by Country 2019 & 2032
- Table 105: GCC Global Urothelial Cancer Drugs Market Revenue (Million) Forecast, by Application 2019 & 2032
- Table 106: GCC Global Urothelial Cancer Drugs Market Volume (K Unit) Forecast, by Application 2019 & 2032
- Table 107: South Africa Global Urothelial Cancer Drugs Market Revenue (Million) Forecast, by Application 2019 & 2032
- Table 108: South Africa Global Urothelial Cancer Drugs Market Volume (K Unit) Forecast, by Application 2019 & 2032
- Table 109: Rest of Middle East and Africa Global Urothelial Cancer Drugs Market Revenue (Million) Forecast, by Application 2019 & 2032
- Table 110: Rest of Middle East and Africa Global Urothelial Cancer Drugs Market Volume (K Unit) Forecast, by Application 2019 & 2032
- Table 111: Global Urothelial Cancer Drugs Market Revenue Million Forecast, by Treatment 2019 & 2032
- Table 112: Global Urothelial Cancer Drugs Market Volume K Unit Forecast, by Treatment 2019 & 2032
- Table 113: Global Urothelial Cancer Drugs Market Revenue Million Forecast, by Country 2019 & 2032
- Table 114: Global Urothelial Cancer Drugs Market Volume K Unit Forecast, by Country 2019 & 2032
- Table 115: Brazil Global Urothelial Cancer Drugs Market Revenue (Million) Forecast, by Application 2019 & 2032
- Table 116: Brazil Global Urothelial Cancer Drugs Market Volume (K Unit) Forecast, by Application 2019 & 2032
- Table 117: Argentina Global Urothelial Cancer Drugs Market Revenue (Million) Forecast, by Application 2019 & 2032
- Table 118: Argentina Global Urothelial Cancer Drugs Market Volume (K Unit) Forecast, by Application 2019 & 2032
- Table 119: Rest of South America Global Urothelial Cancer Drugs Market Revenue (Million) Forecast, by Application 2019 & 2032
- Table 120: Rest of South America Global Urothelial Cancer Drugs Market Volume (K Unit) Forecast, by Application 2019 & 2032
Frequently Asked Questions
1. What is the projected Compound Annual Growth Rate (CAGR) of the Global Urothelial Cancer Drugs Market?
The projected CAGR is approximately 15.50%.
2. Which companies are prominent players in the Global Urothelial Cancer Drugs Market?
Key companies in the market include Sanofi SA, F Hoffmann-La Roche AG, Astellas Pharma, Novartis AG, Merck & Co Inc, AstraZeneca PLC, Genentech USA Inc , Eisai Co Ltd, UroGen Pharma, Bristol-Myers Squibb Company, GlaxoSmithKline PLC, Pfizer Inc.
3. What are the main segments of the Global Urothelial Cancer Drugs Market?
The market segments include Treatment.
4. Can you provide details about the market size?
The market size is estimated to be USD XX Million as of 2022.
5. What are some drivers contributing to market growth?
Emergence and Priority of Targeted Therapy Among Biopharmaceutical Companies; Growing Burden of Urothelial Cancer; Increasing Awareness on Bladder Diseases and Available Therapies.
6. What are the notable trends driving market growth?
The Chemotherapy Segment is Expected to Witness the Fastest Growth Over the Forecast Period.
7. Are there any restraints impacting market growth?
Side Effects Associated with Drugs.
8. Can you provide examples of recent developments in the market?
December 2022: Asieris stated that Hexvix, a drug used for bladder cancer diagnosis, completed dosing for the first patient in its real-world clinical study at Hainan General Hospital Lecheng Branch.
9. What pricing options are available for accessing the report?
Pricing options include single-user, multi-user, and enterprise licenses priced at USD 4750, USD 5250, and USD 8750 respectively.
10. Is the market size provided in terms of value or volume?
The market size is provided in terms of value, measured in Million and volume, measured in K Unit.
11. Are there any specific market keywords associated with the report?
Yes, the market keyword associated with the report is "Global Urothelial Cancer Drugs Market," which aids in identifying and referencing the specific market segment covered.
12. How do I determine which pricing option suits my needs best?
The pricing options vary based on user requirements and access needs. Individual users may opt for single-user licenses, while businesses requiring broader access may choose multi-user or enterprise licenses for cost-effective access to the report.
13. Are there any additional resources or data provided in the Global Urothelial Cancer Drugs Market report?
While the report offers comprehensive insights, it's advisable to review the specific contents or supplementary materials provided to ascertain if additional resources or data are available.
14. How can I stay updated on further developments or reports in the Global Urothelial Cancer Drugs Market?
To stay informed about further developments, trends, and reports in the Global Urothelial Cancer Drugs Market, consider subscribing to industry newsletters, following relevant companies and organizations, or regularly checking reputable industry news sources and publications.
Methodology
Step 1 - Identification of Relevant Samples Size from Population Database


Step 2 - Approaches for Defining Global Market Size (Value, Volume* & Price*)

Note*: In applicable scenarios
Step 3 - Data Sources
Primary Research
- Web Analytics
- Survey Reports
- Research Institute
- Latest Research Reports
- Opinion Leaders
Secondary Research
- Annual Reports
- White Paper
- Latest Press Release
- Industry Association
- Paid Database
- Investor Presentations

Step 4 - Data Triangulation
Involves using different sources of information in order to increase the validity of a study
These sources are likely to be stakeholders in a program - participants, other researchers, program staff, other community members, and so on.
Then we put all data in single framework & apply various statistical tools to find out the dynamic on the market.
During the analysis stage, feedback from the stakeholder groups would be compared to determine areas of agreement as well as areas of divergence


