
Key Insights
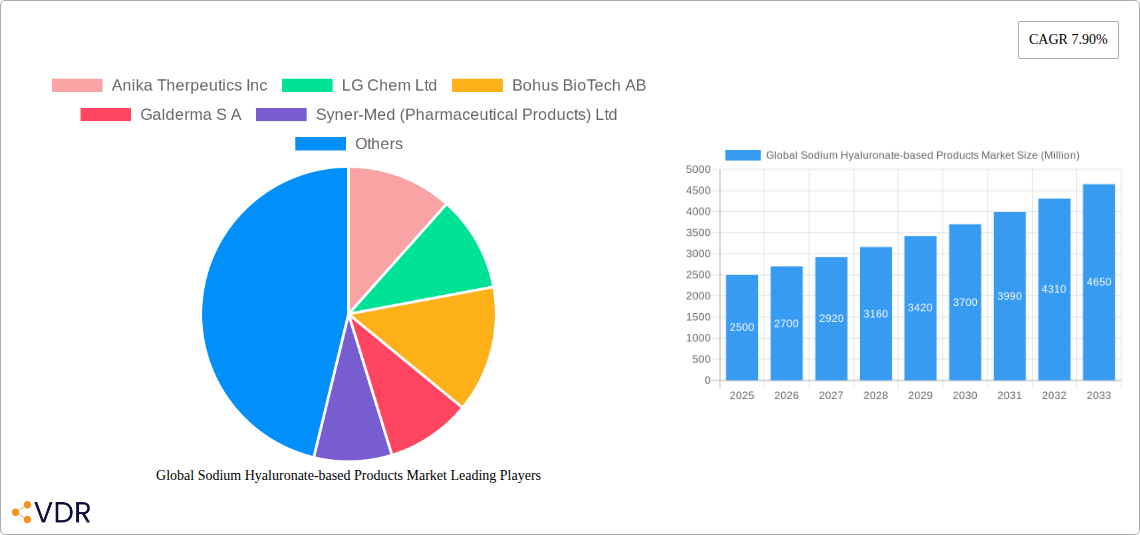
The global sodium hyaluronate-based products market is experiencing robust growth, driven by increasing demand across diverse applications, particularly in pharmaceuticals and cosmetics. The market's compound annual growth rate (CAGR) of 7.90% from 2019 to 2024 suggests a significant expansion, projected to continue through 2033. Key drivers include the rising prevalence of osteoarthritis and other joint-related conditions necessitating hyaluronic acid-based treatments, coupled with the growing popularity of hyaluronic acid in cosmetic procedures like dermal fillers and skin rejuvenating products. The topical application segment is expected to maintain a substantial market share due to its ease of use and growing consumer awareness of its benefits. Injectable formulations, while commanding a higher price point, are also projected for significant growth due to their efficacy in treating various conditions. Technological advancements leading to improved product formulations and delivery systems are further fueling market expansion. Competitive pressures among established players like Anika Therapeutics Inc., LG Chem Ltd., and Galderma S.A., alongside emerging players, contribute to ongoing innovation and product diversification. Geographical variations in market penetration exist, with North America and Europe currently holding significant shares due to higher healthcare spending and greater awareness of hyaluronic acid's benefits. However, the Asia-Pacific region is anticipated to witness substantial growth fueled by rising disposable incomes and increasing demand for aesthetic procedures. Regulatory approvals and evolving healthcare policies also play a role in shaping market dynamics. Future growth will likely be influenced by the development of novel applications, improved product efficacy, and increased accessibility to hyaluronic acid-based products globally.
The market segmentation reveals a strong focus on pharmaceutical applications, such as treatments for osteoarthritis and ophthalmic conditions. However, the cosmetics segment is experiencing rapid expansion, spurred by the growing demand for anti-aging and skin-enhancing products. The injectable route of administration is gaining traction due to its higher efficacy and targeted delivery. The continued research and development in this sector is likely to drive innovation, leading to novel applications and more effective formulations. Specific regional growth trajectories are influenced by factors such as regulatory landscape, healthcare infrastructure, and consumer preferences. While accurate market sizing for 2025 requires further data, extrapolation based on the CAGR and current market trends suggests a substantial market value in the billions. The competitive landscape is dynamic, with established players and emerging companies vying for market share through product differentiation and strategic partnerships. This competitive environment is stimulating further innovation and expansion of the global sodium hyaluronate-based products market.
Global Sodium Hyaluronate-Based Products Market: A Comprehensive Report (2019-2033)
This comprehensive report provides a detailed analysis of the global sodium hyaluronate-based products market, encompassing its dynamics, growth trends, regional segmentation, product landscape, key players, and future outlook. The study period covers 2019-2033, with 2025 as the base year and a forecast period of 2025-2033. This report serves as an invaluable resource for industry professionals, investors, and strategists seeking to understand and capitalize on the opportunities within this rapidly expanding market. The parent market is the broader biotechnology and pharmaceutical industry, while the child market focuses specifically on hyaluronic acid-derived products. The total market value in 2025 is estimated at xx Million.
Global Sodium Hyaluronate-Based Products Market Dynamics & Structure
This section analyzes the market's competitive landscape, innovation drivers, and regulatory environment. The market is characterized by a moderate level of concentration, with key players holding significant market share. Technological advancements, particularly in delivery systems and product formulations, are driving market expansion. Stringent regulatory frameworks concerning safety and efficacy influence product development and market entry. The availability of substitute products, while limited, presents some competitive pressure. End-user demographics across pharmaceuticals and cosmetics play a crucial role.
- Market Concentration: Moderate, with top 5 players holding approximately xx% market share in 2025.
- Technological Innovation: Focus on improved bioavailability, targeted delivery systems, and biocompatible materials. Innovation barriers include high R&D costs and stringent regulatory approvals.
- Regulatory Frameworks: Vary across regions, influencing product registration and market access. Compliance is crucial.
- Competitive Substitutes: Limited alternatives exist, but competition exists among different forms (topical vs. injectable) and brands.
- End-User Demographics: Growing aging population and increasing demand for aesthetic treatments fuel market growth. Pharmaceutical applications show steady growth due to increased use in treatment.
- M&A Trends: xx M&A deals were recorded between 2019 and 2024, mainly driven by strategic expansion into new markets and product portfolios.
Global Sodium Hyaluronate-Based Products Market Growth Trends & Insights
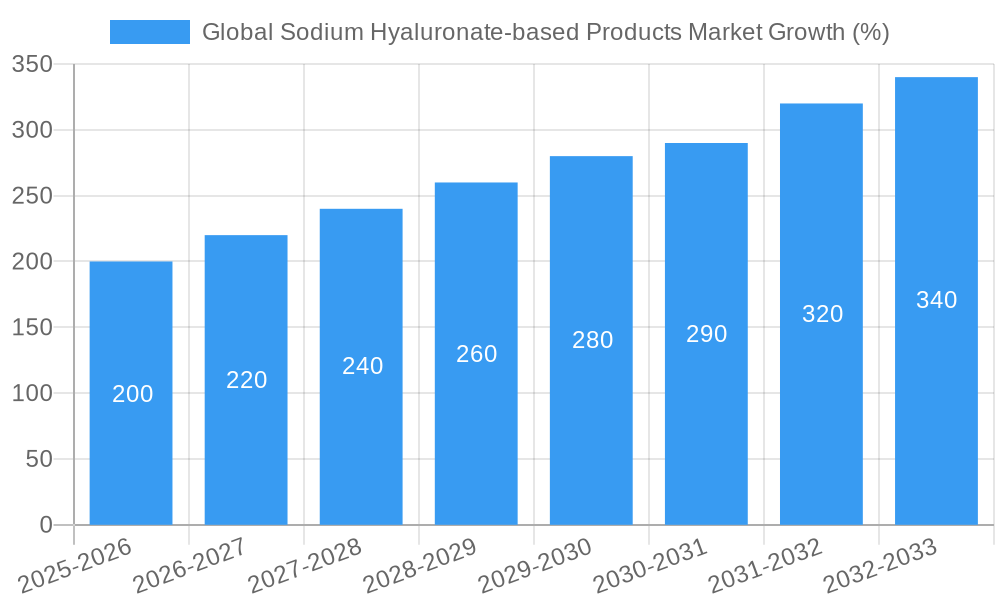
The global sodium hyaluronate-based products market exhibits robust growth, driven by the increasing demand for aesthetic and pharmaceutical applications. The market size experienced a CAGR of xx% during the historical period (2019-2024) and is projected to maintain a CAGR of xx% during the forecast period (2025-2033), reaching xx Million by 2033. This growth is attributed to several factors, including rising consumer awareness, technological advancements, and increased adoption in various medical procedures. Consumer preference shifts towards natural and effective skincare solutions bolster this growth. The market penetration of sodium hyaluronate-based products in the cosmetics industry is continuously improving, further fueling the overall growth. The increasing prevalence of chronic diseases demanding pharmaceutical intervention drives significant growth in this sector.
Dominant Regions, Countries, or Segments in Global Sodium Hyaluronate-Based Products Market
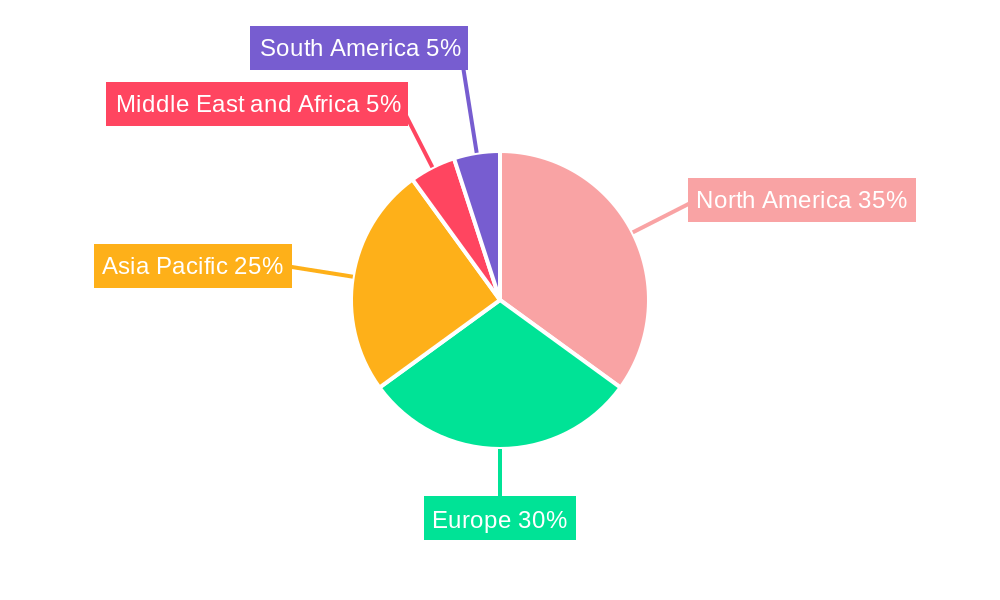
North America and Europe currently dominate the global sodium hyaluronate-based products market, driven by high per capita income, advanced healthcare infrastructure, and increased awareness of the benefits of these products. Within these regions, the Injectable segment demonstrates the highest growth due to its use in various medical procedures. The Pharmaceuticals application segment shows the largest market share due to its significant applications in ophthalmology, orthopedics, and dermatology.
- North America: High adoption rates in both pharmaceutical and cosmetic applications, strong regulatory framework.
- Europe: Well-established healthcare infrastructure and increasing demand for aesthetic treatments.
- Asia-Pacific: Rapidly growing market, driven by rising disposable incomes and increasing healthcare spending.
- Dominant Segment (Type): Injectable, due to widespread use in joint health and other medical procedures.
- Dominant Segment (Application): Pharmaceuticals, due to diverse applications across numerous medical treatments.
Global Sodium Hyaluronate-Based Products Market Product Landscape
Sodium hyaluronate-based products are available in various forms, including topical creams, gels, and injectable solutions. Product innovation focuses on improving delivery systems, enhancing bioavailability, and developing specialized formulations for targeted applications. The key selling propositions include effectiveness, biocompatibility, and versatility across applications. Technological advancements concentrate on creating higher molecular weight hyaluronic acid for improved efficacy, along with biodegradable and biocompatible delivery vehicles.
Key Drivers, Barriers & Challenges in Global Sodium Hyaluronate-Based Products Market
Key Drivers:
- Growing demand for anti-aging products and aesthetic treatments in the cosmetic sector.
- Increasing prevalence of chronic diseases requiring pharmaceutical interventions.
- Technological advancements resulting in improved product formulations and delivery methods.
- Favorable regulatory environments in many regions supporting product development and market entry.
Key Barriers & Challenges:
- High production costs and stringent regulatory requirements can increase the price of products, limiting market penetration in price-sensitive regions.
- The presence of several substitutes limits the market potential. Competitive pressure necessitates continual innovation.
- Supply chain disruptions can affect the availability and stability of raw materials, impacting production and market stability. This has a quantifiable impact on profitability.
Emerging Opportunities in Global Sodium Hyaluronate-Based Products Market
- Untapped markets in developing economies offer significant growth potential.
- Development of innovative applications in drug delivery systems and regenerative medicine.
- Customized product formulations catering to specific needs and consumer preferences.
- Increased focus on sustainable and ethically sourced raw materials.
Growth Accelerators in the Global Sodium Hyaluronate-Based Products Market Industry
Strategic partnerships and collaborations between key players can foster innovation and market expansion. Technological breakthroughs in delivery systems and product formulations are critical drivers. Expanding into new markets and addressing the needs of underserved populations are key growth strategies.
Key Players Shaping the Global Sodium Hyaluronate-Based Products Market Market
- Anika Therapeutics Inc
- LG Chem Ltd
- Bohus BioTech AB
- Galderma S.A
- Syner-Med (Pharmaceutical Products) Ltd
- Fidia Farmaceutici S.p.A
- Zydus Cadila Pharmaceuticals Ltd
- Ferring Pharmaceuticals B.V
- Allergan Inc (a part of AbbVie Inc)
Notable Milestones in Global Sodium Hyaluronate-Based Products Market Sector
- April 2022: Bobbi Brown & Jones Road launched "WTF" foundation containing sodium hyaluronate, showcasing its use in cosmetics.
- February 2022: Kukje Pharma launched Kukje Hyal injection, expanding the injectable segment for joint pain relief.
In-Depth Global Sodium Hyaluronate-Based Products Market Market Outlook
The future of the global sodium hyaluronate-based products market is bright, with continued growth driven by technological advancements, expanding applications, and increasing consumer awareness. Strategic partnerships, investments in R&D, and expansion into new geographical markets will further propel market growth. The market is poised for substantial expansion, presenting significant opportunities for industry players.
Global Sodium Hyaluronate-based Products Market Segmentation
-
1. Type
- 1.1. Topical
- 1.2. Injectable
- 1.3. Others
-
2. Application
-
2.1. Pharmaceuticals
- 2.1.1. Opthalmology
- 2.1.2. Orthopedic
- 2.1.3. Urology
- 2.1.4. Others
- 2.2. Cosmetics
-
2.1. Pharmaceuticals
Global Sodium Hyaluronate-based Products Market Segmentation By Geography
-
1. North America
- 1.1. United States
- 1.2. Canada
- 1.3. Mexico
-
2. Europe
- 2.1. Germany
- 2.2. United Kingdom
- 2.3. France
- 2.4. Italy
- 2.5. Spain
- 2.6. Rest of Europe
-
3. Asia Pacific
- 3.1. China
- 3.2. Japan
- 3.3. India
- 3.4. Australia
- 3.5. South Korea
- 3.6. Rest of Asia Pacific
-
4. Middle East and Africa
- 4.1. GCC
- 4.2. South Africa
- 4.3. Rest of Middle East and Africa
-
5. South America
- 5.1. Brazil
- 5.2. Argentina
- 5.3. Rest of South America
Global Sodium Hyaluronate-based Products Market REPORT HIGHLIGHTS
| Aspects | Details |
|---|---|
| Study Period | 2019-2033 |
| Base Year | 2024 |
| Estimated Year | 2025 |
| Forecast Period | 2025-2033 |
| Historical Period | 2019-2024 |
| Growth Rate | CAGR of 7.90% from 2019-2033 |
| Segmentation |
|
Table of Contents
- 1. Introduction
- 1.1. Research Scope
- 1.2. Market Segmentation
- 1.3. Research Methodology
- 1.4. Definitions and Assumptions
- 2. Executive Summary
- 2.1. Introduction
- 3. Market Dynamics
- 3.1. Introduction
- 3.2. Market Drivers
- 3.2.1. Increasing Geriatric Population and Prevalence of Osteoarthritis & Eye Diseases; Growing Demand for Minimally Invasive Cosmetic Procedures
- 3.3. Market Restrains
- 3.3.1. Associated Adverse Effects of Sodium Hyaluronate-Based Products
- 3.4. Market Trends
- 3.4.1. Injectable Segment is Expected to Hold Significant Market Share in the Process Component Segment
- 4. Market Factor Analysis
- 4.1. Porters Five Forces
- 4.2. Supply/Value Chain
- 4.3. PESTEL analysis
- 4.4. Market Entropy
- 4.5. Patent/Trademark Analysis
- 5. Global Sodium Hyaluronate-based Products Market Analysis, Insights and Forecast, 2019-2031
- 5.1. Market Analysis, Insights and Forecast - by Type
- 5.1.1. Topical
- 5.1.2. Injectable
- 5.1.3. Others
- 5.2. Market Analysis, Insights and Forecast - by Application
- 5.2.1. Pharmaceuticals
- 5.2.1.1. Opthalmology
- 5.2.1.2. Orthopedic
- 5.2.1.3. Urology
- 5.2.1.4. Others
- 5.2.2. Cosmetics
- 5.2.1. Pharmaceuticals
- 5.3. Market Analysis, Insights and Forecast - by Region
- 5.3.1. North America
- 5.3.2. Europe
- 5.3.3. Asia Pacific
- 5.3.4. Middle East and Africa
- 5.3.5. South America
- 5.1. Market Analysis, Insights and Forecast - by Type
- 6. North America Global Sodium Hyaluronate-based Products Market Analysis, Insights and Forecast, 2019-2031
- 6.1. Market Analysis, Insights and Forecast - by Type
- 6.1.1. Topical
- 6.1.2. Injectable
- 6.1.3. Others
- 6.2. Market Analysis, Insights and Forecast - by Application
- 6.2.1. Pharmaceuticals
- 6.2.1.1. Opthalmology
- 6.2.1.2. Orthopedic
- 6.2.1.3. Urology
- 6.2.1.4. Others
- 6.2.2. Cosmetics
- 6.2.1. Pharmaceuticals
- 6.1. Market Analysis, Insights and Forecast - by Type
- 7. Europe Global Sodium Hyaluronate-based Products Market Analysis, Insights and Forecast, 2019-2031
- 7.1. Market Analysis, Insights and Forecast - by Type
- 7.1.1. Topical
- 7.1.2. Injectable
- 7.1.3. Others
- 7.2. Market Analysis, Insights and Forecast - by Application
- 7.2.1. Pharmaceuticals
- 7.2.1.1. Opthalmology
- 7.2.1.2. Orthopedic
- 7.2.1.3. Urology
- 7.2.1.4. Others
- 7.2.2. Cosmetics
- 7.2.1. Pharmaceuticals
- 7.1. Market Analysis, Insights and Forecast - by Type
- 8. Asia Pacific Global Sodium Hyaluronate-based Products Market Analysis, Insights and Forecast, 2019-2031
- 8.1. Market Analysis, Insights and Forecast - by Type
- 8.1.1. Topical
- 8.1.2. Injectable
- 8.1.3. Others
- 8.2. Market Analysis, Insights and Forecast - by Application
- 8.2.1. Pharmaceuticals
- 8.2.1.1. Opthalmology
- 8.2.1.2. Orthopedic
- 8.2.1.3. Urology
- 8.2.1.4. Others
- 8.2.2. Cosmetics
- 8.2.1. Pharmaceuticals
- 8.1. Market Analysis, Insights and Forecast - by Type
- 9. Middle East and Africa Global Sodium Hyaluronate-based Products Market Analysis, Insights and Forecast, 2019-2031
- 9.1. Market Analysis, Insights and Forecast - by Type
- 9.1.1. Topical
- 9.1.2. Injectable
- 9.1.3. Others
- 9.2. Market Analysis, Insights and Forecast - by Application
- 9.2.1. Pharmaceuticals
- 9.2.1.1. Opthalmology
- 9.2.1.2. Orthopedic
- 9.2.1.3. Urology
- 9.2.1.4. Others
- 9.2.2. Cosmetics
- 9.2.1. Pharmaceuticals
- 9.1. Market Analysis, Insights and Forecast - by Type
- 10. South America Global Sodium Hyaluronate-based Products Market Analysis, Insights and Forecast, 2019-2031
- 10.1. Market Analysis, Insights and Forecast - by Type
- 10.1.1. Topical
- 10.1.2. Injectable
- 10.1.3. Others
- 10.2. Market Analysis, Insights and Forecast - by Application
- 10.2.1. Pharmaceuticals
- 10.2.1.1. Opthalmology
- 10.2.1.2. Orthopedic
- 10.2.1.3. Urology
- 10.2.1.4. Others
- 10.2.2. Cosmetics
- 10.2.1. Pharmaceuticals
- 10.1. Market Analysis, Insights and Forecast - by Type
- 11. North America Global Sodium Hyaluronate-based Products Market Analysis, Insights and Forecast, 2019-2031
- 11.1. Market Analysis, Insights and Forecast - By Country/Sub-region
- 11.1.1 United States
- 11.1.2 Canada
- 11.1.3 Mexico
- 12. Europe Global Sodium Hyaluronate-based Products Market Analysis, Insights and Forecast, 2019-2031
- 12.1. Market Analysis, Insights and Forecast - By Country/Sub-region
- 12.1.1 Germany
- 12.1.2 United Kingdom
- 12.1.3 France
- 12.1.4 Italy
- 12.1.5 Spain
- 12.1.6 Rest of Europe
- 13. Asia Pacific Global Sodium Hyaluronate-based Products Market Analysis, Insights and Forecast, 2019-2031
- 13.1. Market Analysis, Insights and Forecast - By Country/Sub-region
- 13.1.1 China
- 13.1.2 Japan
- 13.1.3 India
- 13.1.4 Australia
- 13.1.5 South Korea
- 13.1.6 Rest of Asia Pacific
- 14. Middle East and Africa Global Sodium Hyaluronate-based Products Market Analysis, Insights and Forecast, 2019-2031
- 14.1. Market Analysis, Insights and Forecast - By Country/Sub-region
- 14.1.1 GCC
- 14.1.2 South Africa
- 14.1.3 Rest of Middle East and Africa
- 15. South America Global Sodium Hyaluronate-based Products Market Analysis, Insights and Forecast, 2019-2031
- 15.1. Market Analysis, Insights and Forecast - By Country/Sub-region
- 15.1.1 Brazil
- 15.1.2 Argentina
- 15.1.3 Rest of South America
- 16. Competitive Analysis
- 16.1. Market Share Analysis 2024
- 16.2. Company Profiles
- 16.2.1 Anika Therpeutics Inc
- 16.2.1.1. Overview
- 16.2.1.2. Products
- 16.2.1.3. SWOT Analysis
- 16.2.1.4. Recent Developments
- 16.2.1.5. Financials (Based on Availability)
- 16.2.2 LG Chem Ltd
- 16.2.2.1. Overview
- 16.2.2.2. Products
- 16.2.2.3. SWOT Analysis
- 16.2.2.4. Recent Developments
- 16.2.2.5. Financials (Based on Availability)
- 16.2.3 Bohus BioTech AB
- 16.2.3.1. Overview
- 16.2.3.2. Products
- 16.2.3.3. SWOT Analysis
- 16.2.3.4. Recent Developments
- 16.2.3.5. Financials (Based on Availability)
- 16.2.4 Galderma S A
- 16.2.4.1. Overview
- 16.2.4.2. Products
- 16.2.4.3. SWOT Analysis
- 16.2.4.4. Recent Developments
- 16.2.4.5. Financials (Based on Availability)
- 16.2.5 Syner-Med (Pharmaceutical Products) Ltd
- 16.2.5.1. Overview
- 16.2.5.2. Products
- 16.2.5.3. SWOT Analysis
- 16.2.5.4. Recent Developments
- 16.2.5.5. Financials (Based on Availability)
- 16.2.6 Fidia Farmaceutici S p A
- 16.2.6.1. Overview
- 16.2.6.2. Products
- 16.2.6.3. SWOT Analysis
- 16.2.6.4. Recent Developments
- 16.2.6.5. Financials (Based on Availability)
- 16.2.7 Zydus Cadila Pharmaceuticals Ltd
- 16.2.7.1. Overview
- 16.2.7.2. Products
- 16.2.7.3. SWOT Analysis
- 16.2.7.4. Recent Developments
- 16.2.7.5. Financials (Based on Availability)
- 16.2.8 Ferring Pharmaceuticals B V
- 16.2.8.1. Overview
- 16.2.8.2. Products
- 16.2.8.3. SWOT Analysis
- 16.2.8.4. Recent Developments
- 16.2.8.5. Financials (Based on Availability)
- 16.2.9 Allergan Inc (a part of AbbVie Inc )
- 16.2.9.1. Overview
- 16.2.9.2. Products
- 16.2.9.3. SWOT Analysis
- 16.2.9.4. Recent Developments
- 16.2.9.5. Financials (Based on Availability)
- 16.2.1 Anika Therpeutics Inc
List of Figures
- Figure 1: Global Global Sodium Hyaluronate-based Products Market Revenue Breakdown (Million, %) by Region 2024 & 2032
- Figure 2: Global Global Sodium Hyaluronate-based Products Market Volume Breakdown (K Unit, %) by Region 2024 & 2032
- Figure 3: North America Global Sodium Hyaluronate-based Products Market Revenue (Million), by Country 2024 & 2032
- Figure 4: North America Global Sodium Hyaluronate-based Products Market Volume (K Unit), by Country 2024 & 2032
- Figure 5: North America Global Sodium Hyaluronate-based Products Market Revenue Share (%), by Country 2024 & 2032
- Figure 6: North America Global Sodium Hyaluronate-based Products Market Volume Share (%), by Country 2024 & 2032
- Figure 7: Europe Global Sodium Hyaluronate-based Products Market Revenue (Million), by Country 2024 & 2032
- Figure 8: Europe Global Sodium Hyaluronate-based Products Market Volume (K Unit), by Country 2024 & 2032
- Figure 9: Europe Global Sodium Hyaluronate-based Products Market Revenue Share (%), by Country 2024 & 2032
- Figure 10: Europe Global Sodium Hyaluronate-based Products Market Volume Share (%), by Country 2024 & 2032
- Figure 11: Asia Pacific Global Sodium Hyaluronate-based Products Market Revenue (Million), by Country 2024 & 2032
- Figure 12: Asia Pacific Global Sodium Hyaluronate-based Products Market Volume (K Unit), by Country 2024 & 2032
- Figure 13: Asia Pacific Global Sodium Hyaluronate-based Products Market Revenue Share (%), by Country 2024 & 2032
- Figure 14: Asia Pacific Global Sodium Hyaluronate-based Products Market Volume Share (%), by Country 2024 & 2032
- Figure 15: Middle East and Africa Global Sodium Hyaluronate-based Products Market Revenue (Million), by Country 2024 & 2032
- Figure 16: Middle East and Africa Global Sodium Hyaluronate-based Products Market Volume (K Unit), by Country 2024 & 2032
- Figure 17: Middle East and Africa Global Sodium Hyaluronate-based Products Market Revenue Share (%), by Country 2024 & 2032
- Figure 18: Middle East and Africa Global Sodium Hyaluronate-based Products Market Volume Share (%), by Country 2024 & 2032
- Figure 19: South America Global Sodium Hyaluronate-based Products Market Revenue (Million), by Country 2024 & 2032
- Figure 20: South America Global Sodium Hyaluronate-based Products Market Volume (K Unit), by Country 2024 & 2032
- Figure 21: South America Global Sodium Hyaluronate-based Products Market Revenue Share (%), by Country 2024 & 2032
- Figure 22: South America Global Sodium Hyaluronate-based Products Market Volume Share (%), by Country 2024 & 2032
- Figure 23: North America Global Sodium Hyaluronate-based Products Market Revenue (Million), by Type 2024 & 2032
- Figure 24: North America Global Sodium Hyaluronate-based Products Market Volume (K Unit), by Type 2024 & 2032
- Figure 25: North America Global Sodium Hyaluronate-based Products Market Revenue Share (%), by Type 2024 & 2032
- Figure 26: North America Global Sodium Hyaluronate-based Products Market Volume Share (%), by Type 2024 & 2032
- Figure 27: North America Global Sodium Hyaluronate-based Products Market Revenue (Million), by Application 2024 & 2032
- Figure 28: North America Global Sodium Hyaluronate-based Products Market Volume (K Unit), by Application 2024 & 2032
- Figure 29: North America Global Sodium Hyaluronate-based Products Market Revenue Share (%), by Application 2024 & 2032
- Figure 30: North America Global Sodium Hyaluronate-based Products Market Volume Share (%), by Application 2024 & 2032
- Figure 31: North America Global Sodium Hyaluronate-based Products Market Revenue (Million), by Country 2024 & 2032
- Figure 32: North America Global Sodium Hyaluronate-based Products Market Volume (K Unit), by Country 2024 & 2032
- Figure 33: North America Global Sodium Hyaluronate-based Products Market Revenue Share (%), by Country 2024 & 2032
- Figure 34: North America Global Sodium Hyaluronate-based Products Market Volume Share (%), by Country 2024 & 2032
- Figure 35: Europe Global Sodium Hyaluronate-based Products Market Revenue (Million), by Type 2024 & 2032
- Figure 36: Europe Global Sodium Hyaluronate-based Products Market Volume (K Unit), by Type 2024 & 2032
- Figure 37: Europe Global Sodium Hyaluronate-based Products Market Revenue Share (%), by Type 2024 & 2032
- Figure 38: Europe Global Sodium Hyaluronate-based Products Market Volume Share (%), by Type 2024 & 2032
- Figure 39: Europe Global Sodium Hyaluronate-based Products Market Revenue (Million), by Application 2024 & 2032
- Figure 40: Europe Global Sodium Hyaluronate-based Products Market Volume (K Unit), by Application 2024 & 2032
- Figure 41: Europe Global Sodium Hyaluronate-based Products Market Revenue Share (%), by Application 2024 & 2032
- Figure 42: Europe Global Sodium Hyaluronate-based Products Market Volume Share (%), by Application 2024 & 2032
- Figure 43: Europe Global Sodium Hyaluronate-based Products Market Revenue (Million), by Country 2024 & 2032
- Figure 44: Europe Global Sodium Hyaluronate-based Products Market Volume (K Unit), by Country 2024 & 2032
- Figure 45: Europe Global Sodium Hyaluronate-based Products Market Revenue Share (%), by Country 2024 & 2032
- Figure 46: Europe Global Sodium Hyaluronate-based Products Market Volume Share (%), by Country 2024 & 2032
- Figure 47: Asia Pacific Global Sodium Hyaluronate-based Products Market Revenue (Million), by Type 2024 & 2032
- Figure 48: Asia Pacific Global Sodium Hyaluronate-based Products Market Volume (K Unit), by Type 2024 & 2032
- Figure 49: Asia Pacific Global Sodium Hyaluronate-based Products Market Revenue Share (%), by Type 2024 & 2032
- Figure 50: Asia Pacific Global Sodium Hyaluronate-based Products Market Volume Share (%), by Type 2024 & 2032
- Figure 51: Asia Pacific Global Sodium Hyaluronate-based Products Market Revenue (Million), by Application 2024 & 2032
- Figure 52: Asia Pacific Global Sodium Hyaluronate-based Products Market Volume (K Unit), by Application 2024 & 2032
- Figure 53: Asia Pacific Global Sodium Hyaluronate-based Products Market Revenue Share (%), by Application 2024 & 2032
- Figure 54: Asia Pacific Global Sodium Hyaluronate-based Products Market Volume Share (%), by Application 2024 & 2032
- Figure 55: Asia Pacific Global Sodium Hyaluronate-based Products Market Revenue (Million), by Country 2024 & 2032
- Figure 56: Asia Pacific Global Sodium Hyaluronate-based Products Market Volume (K Unit), by Country 2024 & 2032
- Figure 57: Asia Pacific Global Sodium Hyaluronate-based Products Market Revenue Share (%), by Country 2024 & 2032
- Figure 58: Asia Pacific Global Sodium Hyaluronate-based Products Market Volume Share (%), by Country 2024 & 2032
- Figure 59: Middle East and Africa Global Sodium Hyaluronate-based Products Market Revenue (Million), by Type 2024 & 2032
- Figure 60: Middle East and Africa Global Sodium Hyaluronate-based Products Market Volume (K Unit), by Type 2024 & 2032
- Figure 61: Middle East and Africa Global Sodium Hyaluronate-based Products Market Revenue Share (%), by Type 2024 & 2032
- Figure 62: Middle East and Africa Global Sodium Hyaluronate-based Products Market Volume Share (%), by Type 2024 & 2032
- Figure 63: Middle East and Africa Global Sodium Hyaluronate-based Products Market Revenue (Million), by Application 2024 & 2032
- Figure 64: Middle East and Africa Global Sodium Hyaluronate-based Products Market Volume (K Unit), by Application 2024 & 2032
- Figure 65: Middle East and Africa Global Sodium Hyaluronate-based Products Market Revenue Share (%), by Application 2024 & 2032
- Figure 66: Middle East and Africa Global Sodium Hyaluronate-based Products Market Volume Share (%), by Application 2024 & 2032
- Figure 67: Middle East and Africa Global Sodium Hyaluronate-based Products Market Revenue (Million), by Country 2024 & 2032
- Figure 68: Middle East and Africa Global Sodium Hyaluronate-based Products Market Volume (K Unit), by Country 2024 & 2032
- Figure 69: Middle East and Africa Global Sodium Hyaluronate-based Products Market Revenue Share (%), by Country 2024 & 2032
- Figure 70: Middle East and Africa Global Sodium Hyaluronate-based Products Market Volume Share (%), by Country 2024 & 2032
- Figure 71: South America Global Sodium Hyaluronate-based Products Market Revenue (Million), by Type 2024 & 2032
- Figure 72: South America Global Sodium Hyaluronate-based Products Market Volume (K Unit), by Type 2024 & 2032
- Figure 73: South America Global Sodium Hyaluronate-based Products Market Revenue Share (%), by Type 2024 & 2032
- Figure 74: South America Global Sodium Hyaluronate-based Products Market Volume Share (%), by Type 2024 & 2032
- Figure 75: South America Global Sodium Hyaluronate-based Products Market Revenue (Million), by Application 2024 & 2032
- Figure 76: South America Global Sodium Hyaluronate-based Products Market Volume (K Unit), by Application 2024 & 2032
- Figure 77: South America Global Sodium Hyaluronate-based Products Market Revenue Share (%), by Application 2024 & 2032
- Figure 78: South America Global Sodium Hyaluronate-based Products Market Volume Share (%), by Application 2024 & 2032
- Figure 79: South America Global Sodium Hyaluronate-based Products Market Revenue (Million), by Country 2024 & 2032
- Figure 80: South America Global Sodium Hyaluronate-based Products Market Volume (K Unit), by Country 2024 & 2032
- Figure 81: South America Global Sodium Hyaluronate-based Products Market Revenue Share (%), by Country 2024 & 2032
- Figure 82: South America Global Sodium Hyaluronate-based Products Market Volume Share (%), by Country 2024 & 2032
List of Tables
- Table 1: Global Sodium Hyaluronate-based Products Market Revenue Million Forecast, by Region 2019 & 2032
- Table 2: Global Sodium Hyaluronate-based Products Market Volume K Unit Forecast, by Region 2019 & 2032
- Table 3: Global Sodium Hyaluronate-based Products Market Revenue Million Forecast, by Type 2019 & 2032
- Table 4: Global Sodium Hyaluronate-based Products Market Volume K Unit Forecast, by Type 2019 & 2032
- Table 5: Global Sodium Hyaluronate-based Products Market Revenue Million Forecast, by Application 2019 & 2032
- Table 6: Global Sodium Hyaluronate-based Products Market Volume K Unit Forecast, by Application 2019 & 2032
- Table 7: Global Sodium Hyaluronate-based Products Market Revenue Million Forecast, by Region 2019 & 2032
- Table 8: Global Sodium Hyaluronate-based Products Market Volume K Unit Forecast, by Region 2019 & 2032
- Table 9: Global Sodium Hyaluronate-based Products Market Revenue Million Forecast, by Country 2019 & 2032
- Table 10: Global Sodium Hyaluronate-based Products Market Volume K Unit Forecast, by Country 2019 & 2032
- Table 11: United States Global Sodium Hyaluronate-based Products Market Revenue (Million) Forecast, by Application 2019 & 2032
- Table 12: United States Global Sodium Hyaluronate-based Products Market Volume (K Unit) Forecast, by Application 2019 & 2032
- Table 13: Canada Global Sodium Hyaluronate-based Products Market Revenue (Million) Forecast, by Application 2019 & 2032
- Table 14: Canada Global Sodium Hyaluronate-based Products Market Volume (K Unit) Forecast, by Application 2019 & 2032
- Table 15: Mexico Global Sodium Hyaluronate-based Products Market Revenue (Million) Forecast, by Application 2019 & 2032
- Table 16: Mexico Global Sodium Hyaluronate-based Products Market Volume (K Unit) Forecast, by Application 2019 & 2032
- Table 17: Global Sodium Hyaluronate-based Products Market Revenue Million Forecast, by Country 2019 & 2032
- Table 18: Global Sodium Hyaluronate-based Products Market Volume K Unit Forecast, by Country 2019 & 2032
- Table 19: Germany Global Sodium Hyaluronate-based Products Market Revenue (Million) Forecast, by Application 2019 & 2032
- Table 20: Germany Global Sodium Hyaluronate-based Products Market Volume (K Unit) Forecast, by Application 2019 & 2032
- Table 21: United Kingdom Global Sodium Hyaluronate-based Products Market Revenue (Million) Forecast, by Application 2019 & 2032
- Table 22: United Kingdom Global Sodium Hyaluronate-based Products Market Volume (K Unit) Forecast, by Application 2019 & 2032
- Table 23: France Global Sodium Hyaluronate-based Products Market Revenue (Million) Forecast, by Application 2019 & 2032
- Table 24: France Global Sodium Hyaluronate-based Products Market Volume (K Unit) Forecast, by Application 2019 & 2032
- Table 25: Italy Global Sodium Hyaluronate-based Products Market Revenue (Million) Forecast, by Application 2019 & 2032
- Table 26: Italy Global Sodium Hyaluronate-based Products Market Volume (K Unit) Forecast, by Application 2019 & 2032
- Table 27: Spain Global Sodium Hyaluronate-based Products Market Revenue (Million) Forecast, by Application 2019 & 2032
- Table 28: Spain Global Sodium Hyaluronate-based Products Market Volume (K Unit) Forecast, by Application 2019 & 2032
- Table 29: Rest of Europe Global Sodium Hyaluronate-based Products Market Revenue (Million) Forecast, by Application 2019 & 2032
- Table 30: Rest of Europe Global Sodium Hyaluronate-based Products Market Volume (K Unit) Forecast, by Application 2019 & 2032
- Table 31: Global Sodium Hyaluronate-based Products Market Revenue Million Forecast, by Country 2019 & 2032
- Table 32: Global Sodium Hyaluronate-based Products Market Volume K Unit Forecast, by Country 2019 & 2032
- Table 33: China Global Sodium Hyaluronate-based Products Market Revenue (Million) Forecast, by Application 2019 & 2032
- Table 34: China Global Sodium Hyaluronate-based Products Market Volume (K Unit) Forecast, by Application 2019 & 2032
- Table 35: Japan Global Sodium Hyaluronate-based Products Market Revenue (Million) Forecast, by Application 2019 & 2032
- Table 36: Japan Global Sodium Hyaluronate-based Products Market Volume (K Unit) Forecast, by Application 2019 & 2032
- Table 37: India Global Sodium Hyaluronate-based Products Market Revenue (Million) Forecast, by Application 2019 & 2032
- Table 38: India Global Sodium Hyaluronate-based Products Market Volume (K Unit) Forecast, by Application 2019 & 2032
- Table 39: Australia Global Sodium Hyaluronate-based Products Market Revenue (Million) Forecast, by Application 2019 & 2032
- Table 40: Australia Global Sodium Hyaluronate-based Products Market Volume (K Unit) Forecast, by Application 2019 & 2032
- Table 41: South Korea Global Sodium Hyaluronate-based Products Market Revenue (Million) Forecast, by Application 2019 & 2032
- Table 42: South Korea Global Sodium Hyaluronate-based Products Market Volume (K Unit) Forecast, by Application 2019 & 2032
- Table 43: Rest of Asia Pacific Global Sodium Hyaluronate-based Products Market Revenue (Million) Forecast, by Application 2019 & 2032
- Table 44: Rest of Asia Pacific Global Sodium Hyaluronate-based Products Market Volume (K Unit) Forecast, by Application 2019 & 2032
- Table 45: Global Sodium Hyaluronate-based Products Market Revenue Million Forecast, by Country 2019 & 2032
- Table 46: Global Sodium Hyaluronate-based Products Market Volume K Unit Forecast, by Country 2019 & 2032
- Table 47: GCC Global Sodium Hyaluronate-based Products Market Revenue (Million) Forecast, by Application 2019 & 2032
- Table 48: GCC Global Sodium Hyaluronate-based Products Market Volume (K Unit) Forecast, by Application 2019 & 2032
- Table 49: South Africa Global Sodium Hyaluronate-based Products Market Revenue (Million) Forecast, by Application 2019 & 2032
- Table 50: South Africa Global Sodium Hyaluronate-based Products Market Volume (K Unit) Forecast, by Application 2019 & 2032
- Table 51: Rest of Middle East and Africa Global Sodium Hyaluronate-based Products Market Revenue (Million) Forecast, by Application 2019 & 2032
- Table 52: Rest of Middle East and Africa Global Sodium Hyaluronate-based Products Market Volume (K Unit) Forecast, by Application 2019 & 2032
- Table 53: Global Sodium Hyaluronate-based Products Market Revenue Million Forecast, by Country 2019 & 2032
- Table 54: Global Sodium Hyaluronate-based Products Market Volume K Unit Forecast, by Country 2019 & 2032
- Table 55: Brazil Global Sodium Hyaluronate-based Products Market Revenue (Million) Forecast, by Application 2019 & 2032
- Table 56: Brazil Global Sodium Hyaluronate-based Products Market Volume (K Unit) Forecast, by Application 2019 & 2032
- Table 57: Argentina Global Sodium Hyaluronate-based Products Market Revenue (Million) Forecast, by Application 2019 & 2032
- Table 58: Argentina Global Sodium Hyaluronate-based Products Market Volume (K Unit) Forecast, by Application 2019 & 2032
- Table 59: Rest of South America Global Sodium Hyaluronate-based Products Market Revenue (Million) Forecast, by Application 2019 & 2032
- Table 60: Rest of South America Global Sodium Hyaluronate-based Products Market Volume (K Unit) Forecast, by Application 2019 & 2032
- Table 61: Global Sodium Hyaluronate-based Products Market Revenue Million Forecast, by Type 2019 & 2032
- Table 62: Global Sodium Hyaluronate-based Products Market Volume K Unit Forecast, by Type 2019 & 2032
- Table 63: Global Sodium Hyaluronate-based Products Market Revenue Million Forecast, by Application 2019 & 2032
- Table 64: Global Sodium Hyaluronate-based Products Market Volume K Unit Forecast, by Application 2019 & 2032
- Table 65: Global Sodium Hyaluronate-based Products Market Revenue Million Forecast, by Country 2019 & 2032
- Table 66: Global Sodium Hyaluronate-based Products Market Volume K Unit Forecast, by Country 2019 & 2032
- Table 67: United States Global Sodium Hyaluronate-based Products Market Revenue (Million) Forecast, by Application 2019 & 2032
- Table 68: United States Global Sodium Hyaluronate-based Products Market Volume (K Unit) Forecast, by Application 2019 & 2032
- Table 69: Canada Global Sodium Hyaluronate-based Products Market Revenue (Million) Forecast, by Application 2019 & 2032
- Table 70: Canada Global Sodium Hyaluronate-based Products Market Volume (K Unit) Forecast, by Application 2019 & 2032
- Table 71: Mexico Global Sodium Hyaluronate-based Products Market Revenue (Million) Forecast, by Application 2019 & 2032
- Table 72: Mexico Global Sodium Hyaluronate-based Products Market Volume (K Unit) Forecast, by Application 2019 & 2032
- Table 73: Global Sodium Hyaluronate-based Products Market Revenue Million Forecast, by Type 2019 & 2032
- Table 74: Global Sodium Hyaluronate-based Products Market Volume K Unit Forecast, by Type 2019 & 2032
- Table 75: Global Sodium Hyaluronate-based Products Market Revenue Million Forecast, by Application 2019 & 2032
- Table 76: Global Sodium Hyaluronate-based Products Market Volume K Unit Forecast, by Application 2019 & 2032
- Table 77: Global Sodium Hyaluronate-based Products Market Revenue Million Forecast, by Country 2019 & 2032
- Table 78: Global Sodium Hyaluronate-based Products Market Volume K Unit Forecast, by Country 2019 & 2032
- Table 79: Germany Global Sodium Hyaluronate-based Products Market Revenue (Million) Forecast, by Application 2019 & 2032
- Table 80: Germany Global Sodium Hyaluronate-based Products Market Volume (K Unit) Forecast, by Application 2019 & 2032
- Table 81: United Kingdom Global Sodium Hyaluronate-based Products Market Revenue (Million) Forecast, by Application 2019 & 2032
- Table 82: United Kingdom Global Sodium Hyaluronate-based Products Market Volume (K Unit) Forecast, by Application 2019 & 2032
- Table 83: France Global Sodium Hyaluronate-based Products Market Revenue (Million) Forecast, by Application 2019 & 2032
- Table 84: France Global Sodium Hyaluronate-based Products Market Volume (K Unit) Forecast, by Application 2019 & 2032
- Table 85: Italy Global Sodium Hyaluronate-based Products Market Revenue (Million) Forecast, by Application 2019 & 2032
- Table 86: Italy Global Sodium Hyaluronate-based Products Market Volume (K Unit) Forecast, by Application 2019 & 2032
- Table 87: Spain Global Sodium Hyaluronate-based Products Market Revenue (Million) Forecast, by Application 2019 & 2032
- Table 88: Spain Global Sodium Hyaluronate-based Products Market Volume (K Unit) Forecast, by Application 2019 & 2032
- Table 89: Rest of Europe Global Sodium Hyaluronate-based Products Market Revenue (Million) Forecast, by Application 2019 & 2032
- Table 90: Rest of Europe Global Sodium Hyaluronate-based Products Market Volume (K Unit) Forecast, by Application 2019 & 2032
- Table 91: Global Sodium Hyaluronate-based Products Market Revenue Million Forecast, by Type 2019 & 2032
- Table 92: Global Sodium Hyaluronate-based Products Market Volume K Unit Forecast, by Type 2019 & 2032
- Table 93: Global Sodium Hyaluronate-based Products Market Revenue Million Forecast, by Application 2019 & 2032
- Table 94: Global Sodium Hyaluronate-based Products Market Volume K Unit Forecast, by Application 2019 & 2032
- Table 95: Global Sodium Hyaluronate-based Products Market Revenue Million Forecast, by Country 2019 & 2032
- Table 96: Global Sodium Hyaluronate-based Products Market Volume K Unit Forecast, by Country 2019 & 2032
- Table 97: China Global Sodium Hyaluronate-based Products Market Revenue (Million) Forecast, by Application 2019 & 2032
- Table 98: China Global Sodium Hyaluronate-based Products Market Volume (K Unit) Forecast, by Application 2019 & 2032
- Table 99: Japan Global Sodium Hyaluronate-based Products Market Revenue (Million) Forecast, by Application 2019 & 2032
- Table 100: Japan Global Sodium Hyaluronate-based Products Market Volume (K Unit) Forecast, by Application 2019 & 2032
- Table 101: India Global Sodium Hyaluronate-based Products Market Revenue (Million) Forecast, by Application 2019 & 2032
- Table 102: India Global Sodium Hyaluronate-based Products Market Volume (K Unit) Forecast, by Application 2019 & 2032
- Table 103: Australia Global Sodium Hyaluronate-based Products Market Revenue (Million) Forecast, by Application 2019 & 2032
- Table 104: Australia Global Sodium Hyaluronate-based Products Market Volume (K Unit) Forecast, by Application 2019 & 2032
- Table 105: South Korea Global Sodium Hyaluronate-based Products Market Revenue (Million) Forecast, by Application 2019 & 2032
- Table 106: South Korea Global Sodium Hyaluronate-based Products Market Volume (K Unit) Forecast, by Application 2019 & 2032
- Table 107: Rest of Asia Pacific Global Sodium Hyaluronate-based Products Market Revenue (Million) Forecast, by Application 2019 & 2032
- Table 108: Rest of Asia Pacific Global Sodium Hyaluronate-based Products Market Volume (K Unit) Forecast, by Application 2019 & 2032
- Table 109: Global Sodium Hyaluronate-based Products Market Revenue Million Forecast, by Type 2019 & 2032
- Table 110: Global Sodium Hyaluronate-based Products Market Volume K Unit Forecast, by Type 2019 & 2032
- Table 111: Global Sodium Hyaluronate-based Products Market Revenue Million Forecast, by Application 2019 & 2032
- Table 112: Global Sodium Hyaluronate-based Products Market Volume K Unit Forecast, by Application 2019 & 2032
- Table 113: Global Sodium Hyaluronate-based Products Market Revenue Million Forecast, by Country 2019 & 2032
- Table 114: Global Sodium Hyaluronate-based Products Market Volume K Unit Forecast, by Country 2019 & 2032
- Table 115: GCC Global Sodium Hyaluronate-based Products Market Revenue (Million) Forecast, by Application 2019 & 2032
- Table 116: GCC Global Sodium Hyaluronate-based Products Market Volume (K Unit) Forecast, by Application 2019 & 2032
- Table 117: South Africa Global Sodium Hyaluronate-based Products Market Revenue (Million) Forecast, by Application 2019 & 2032
- Table 118: South Africa Global Sodium Hyaluronate-based Products Market Volume (K Unit) Forecast, by Application 2019 & 2032
- Table 119: Rest of Middle East and Africa Global Sodium Hyaluronate-based Products Market Revenue (Million) Forecast, by Application 2019 & 2032
- Table 120: Rest of Middle East and Africa Global Sodium Hyaluronate-based Products Market Volume (K Unit) Forecast, by Application 2019 & 2032
- Table 121: Global Sodium Hyaluronate-based Products Market Revenue Million Forecast, by Type 2019 & 2032
- Table 122: Global Sodium Hyaluronate-based Products Market Volume K Unit Forecast, by Type 2019 & 2032
- Table 123: Global Sodium Hyaluronate-based Products Market Revenue Million Forecast, by Application 2019 & 2032
- Table 124: Global Sodium Hyaluronate-based Products Market Volume K Unit Forecast, by Application 2019 & 2032
- Table 125: Global Sodium Hyaluronate-based Products Market Revenue Million Forecast, by Country 2019 & 2032
- Table 126: Global Sodium Hyaluronate-based Products Market Volume K Unit Forecast, by Country 2019 & 2032
- Table 127: Brazil Global Sodium Hyaluronate-based Products Market Revenue (Million) Forecast, by Application 2019 & 2032
- Table 128: Brazil Global Sodium Hyaluronate-based Products Market Volume (K Unit) Forecast, by Application 2019 & 2032
- Table 129: Argentina Global Sodium Hyaluronate-based Products Market Revenue (Million) Forecast, by Application 2019 & 2032
- Table 130: Argentina Global Sodium Hyaluronate-based Products Market Volume (K Unit) Forecast, by Application 2019 & 2032
- Table 131: Rest of South America Global Sodium Hyaluronate-based Products Market Revenue (Million) Forecast, by Application 2019 & 2032
- Table 132: Rest of South America Global Sodium Hyaluronate-based Products Market Volume (K Unit) Forecast, by Application 2019 & 2032
Frequently Asked Questions
1. What is the projected Compound Annual Growth Rate (CAGR) of the Global Sodium Hyaluronate-based Products Market?
The projected CAGR is approximately 7.90%.
2. Which companies are prominent players in the Global Sodium Hyaluronate-based Products Market?
Key companies in the market include Anika Therpeutics Inc, LG Chem Ltd, Bohus BioTech AB, Galderma S A, Syner-Med (Pharmaceutical Products) Ltd, Fidia Farmaceutici S p A , Zydus Cadila Pharmaceuticals Ltd, Ferring Pharmaceuticals B V, Allergan Inc (a part of AbbVie Inc ).
3. What are the main segments of the Global Sodium Hyaluronate-based Products Market?
The market segments include Type, Application.
4. Can you provide details about the market size?
The market size is estimated to be USD XX Million as of 2022.
5. What are some drivers contributing to market growth?
Increasing Geriatric Population and Prevalence of Osteoarthritis & Eye Diseases; Growing Demand for Minimally Invasive Cosmetic Procedures.
6. What are the notable trends driving market growth?
Injectable Segment is Expected to Hold Significant Market Share in the Process Component Segment.
7. Are there any restraints impacting market growth?
Associated Adverse Effects of Sodium Hyaluronate-Based Products.
8. Can you provide examples of recent developments in the market?
In April 2022, Bobbi Brown & Jones Road launched "WTF" foundation formulated with jojoba oil, vitamin E, and sodium hyaluronate (a humectant that attracts moisture when applied to the skin)
9. What pricing options are available for accessing the report?
Pricing options include single-user, multi-user, and enterprise licenses priced at USD 4750, USD 5250, and USD 8750 respectively.
10. Is the market size provided in terms of value or volume?
The market size is provided in terms of value, measured in Million and volume, measured in K Unit.
11. Are there any specific market keywords associated with the report?
Yes, the market keyword associated with the report is "Global Sodium Hyaluronate-based Products Market," which aids in identifying and referencing the specific market segment covered.
12. How do I determine which pricing option suits my needs best?
The pricing options vary based on user requirements and access needs. Individual users may opt for single-user licenses, while businesses requiring broader access may choose multi-user or enterprise licenses for cost-effective access to the report.
13. Are there any additional resources or data provided in the Global Sodium Hyaluronate-based Products Market report?
While the report offers comprehensive insights, it's advisable to review the specific contents or supplementary materials provided to ascertain if additional resources or data are available.
14. How can I stay updated on further developments or reports in the Global Sodium Hyaluronate-based Products Market?
To stay informed about further developments, trends, and reports in the Global Sodium Hyaluronate-based Products Market, consider subscribing to industry newsletters, following relevant companies and organizations, or regularly checking reputable industry news sources and publications.
Methodology
Step 1 - Identification of Relevant Samples Size from Population Database


Step 2 - Approaches for Defining Global Market Size (Value, Volume* & Price*)

Note*: In applicable scenarios
Step 3 - Data Sources
Primary Research
- Web Analytics
- Survey Reports
- Research Institute
- Latest Research Reports
- Opinion Leaders
Secondary Research
- Annual Reports
- White Paper
- Latest Press Release
- Industry Association
- Paid Database
- Investor Presentations

Step 4 - Data Triangulation
Involves using different sources of information in order to increase the validity of a study
These sources are likely to be stakeholders in a program - participants, other researchers, program staff, other community members, and so on.
Then we put all data in single framework & apply various statistical tools to find out the dynamic on the market.
During the analysis stage, feedback from the stakeholder groups would be compared to determine areas of agreement as well as areas of divergence


